Copyright
©The Author(s) 2018.
World J Gastroenterol. Dec 14, 2018; 24(46): 5259-5270
Published online Dec 14, 2018. doi: 10.3748/wjg.v24.i46.5259
Published online Dec 14, 2018. doi: 10.3748/wjg.v24.i46.5259
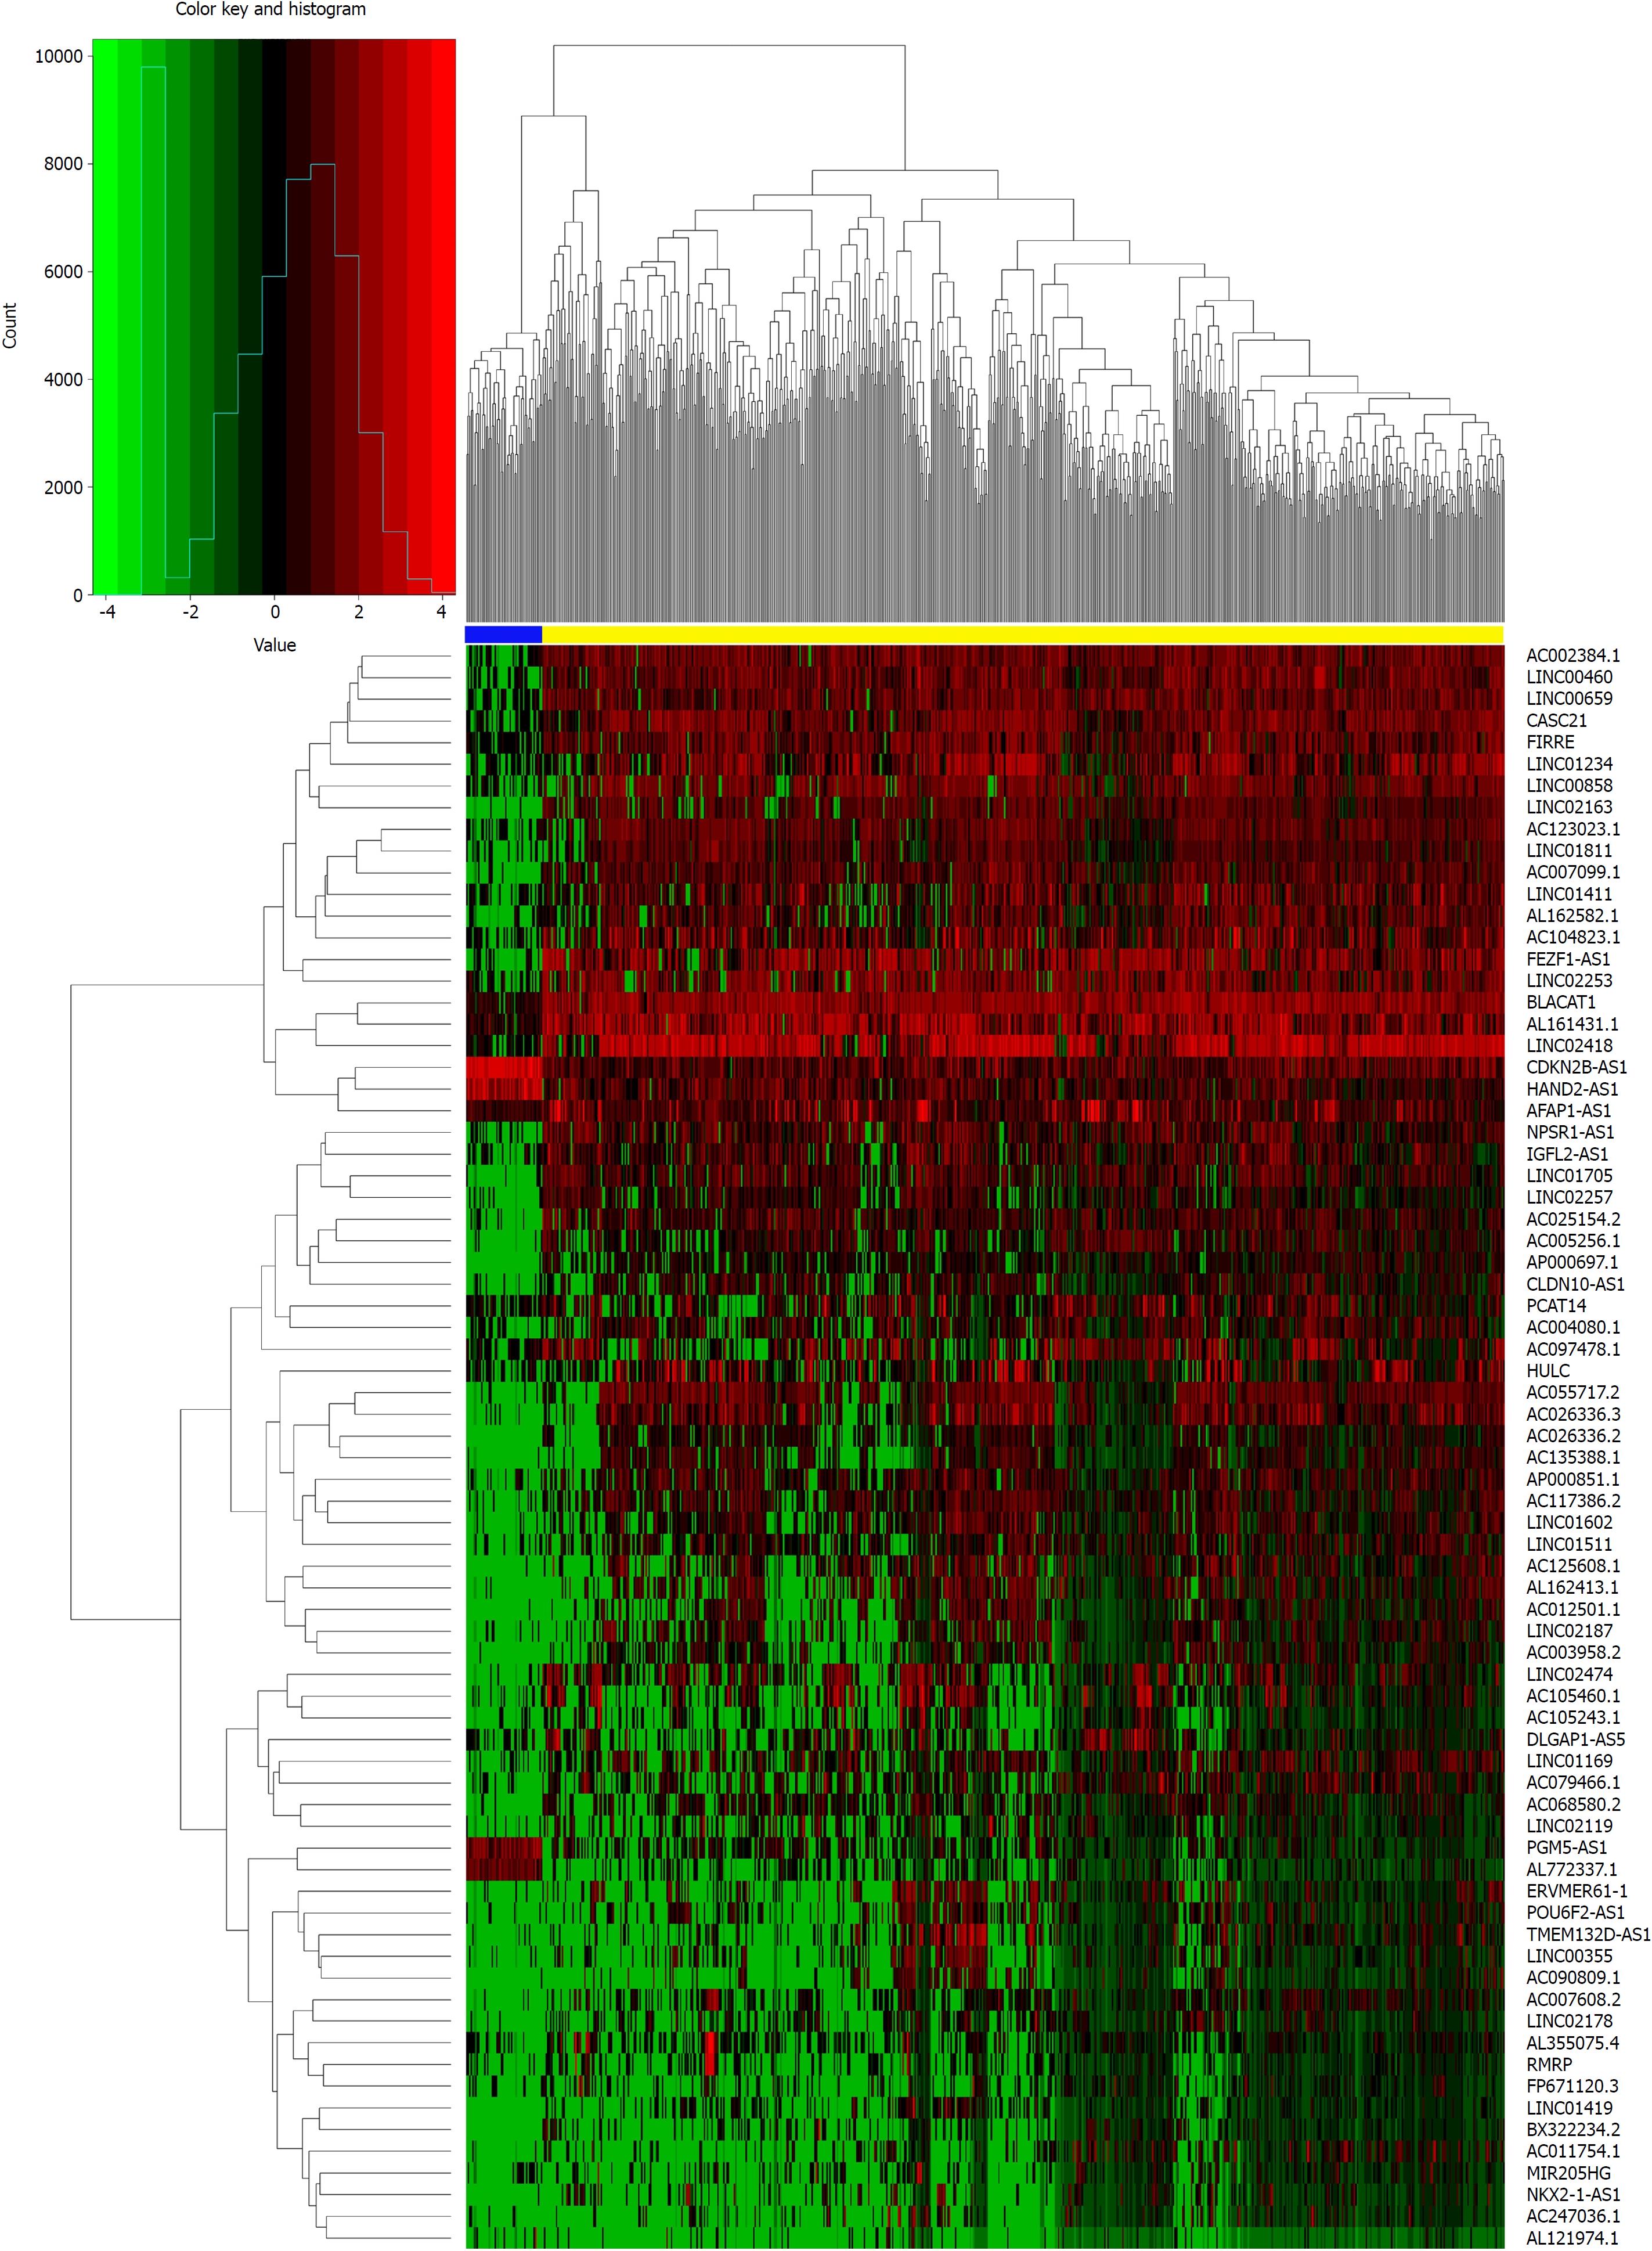
Figure 1 Heat map of differentially expressed long-noncoding RNAs (log2 FC > 5, P < 0.
01). The above horizontal axis shows clusters of samples. The left vertical axis shows clusters of differentially expressed long-noncoding RNAs (DElncRNAs) and right vertical axis represents lncRNA names. Red represents up-regulated genes and green represents down-regulated genes. The yellow color column represents colorectal cancer; the blue represents normal.
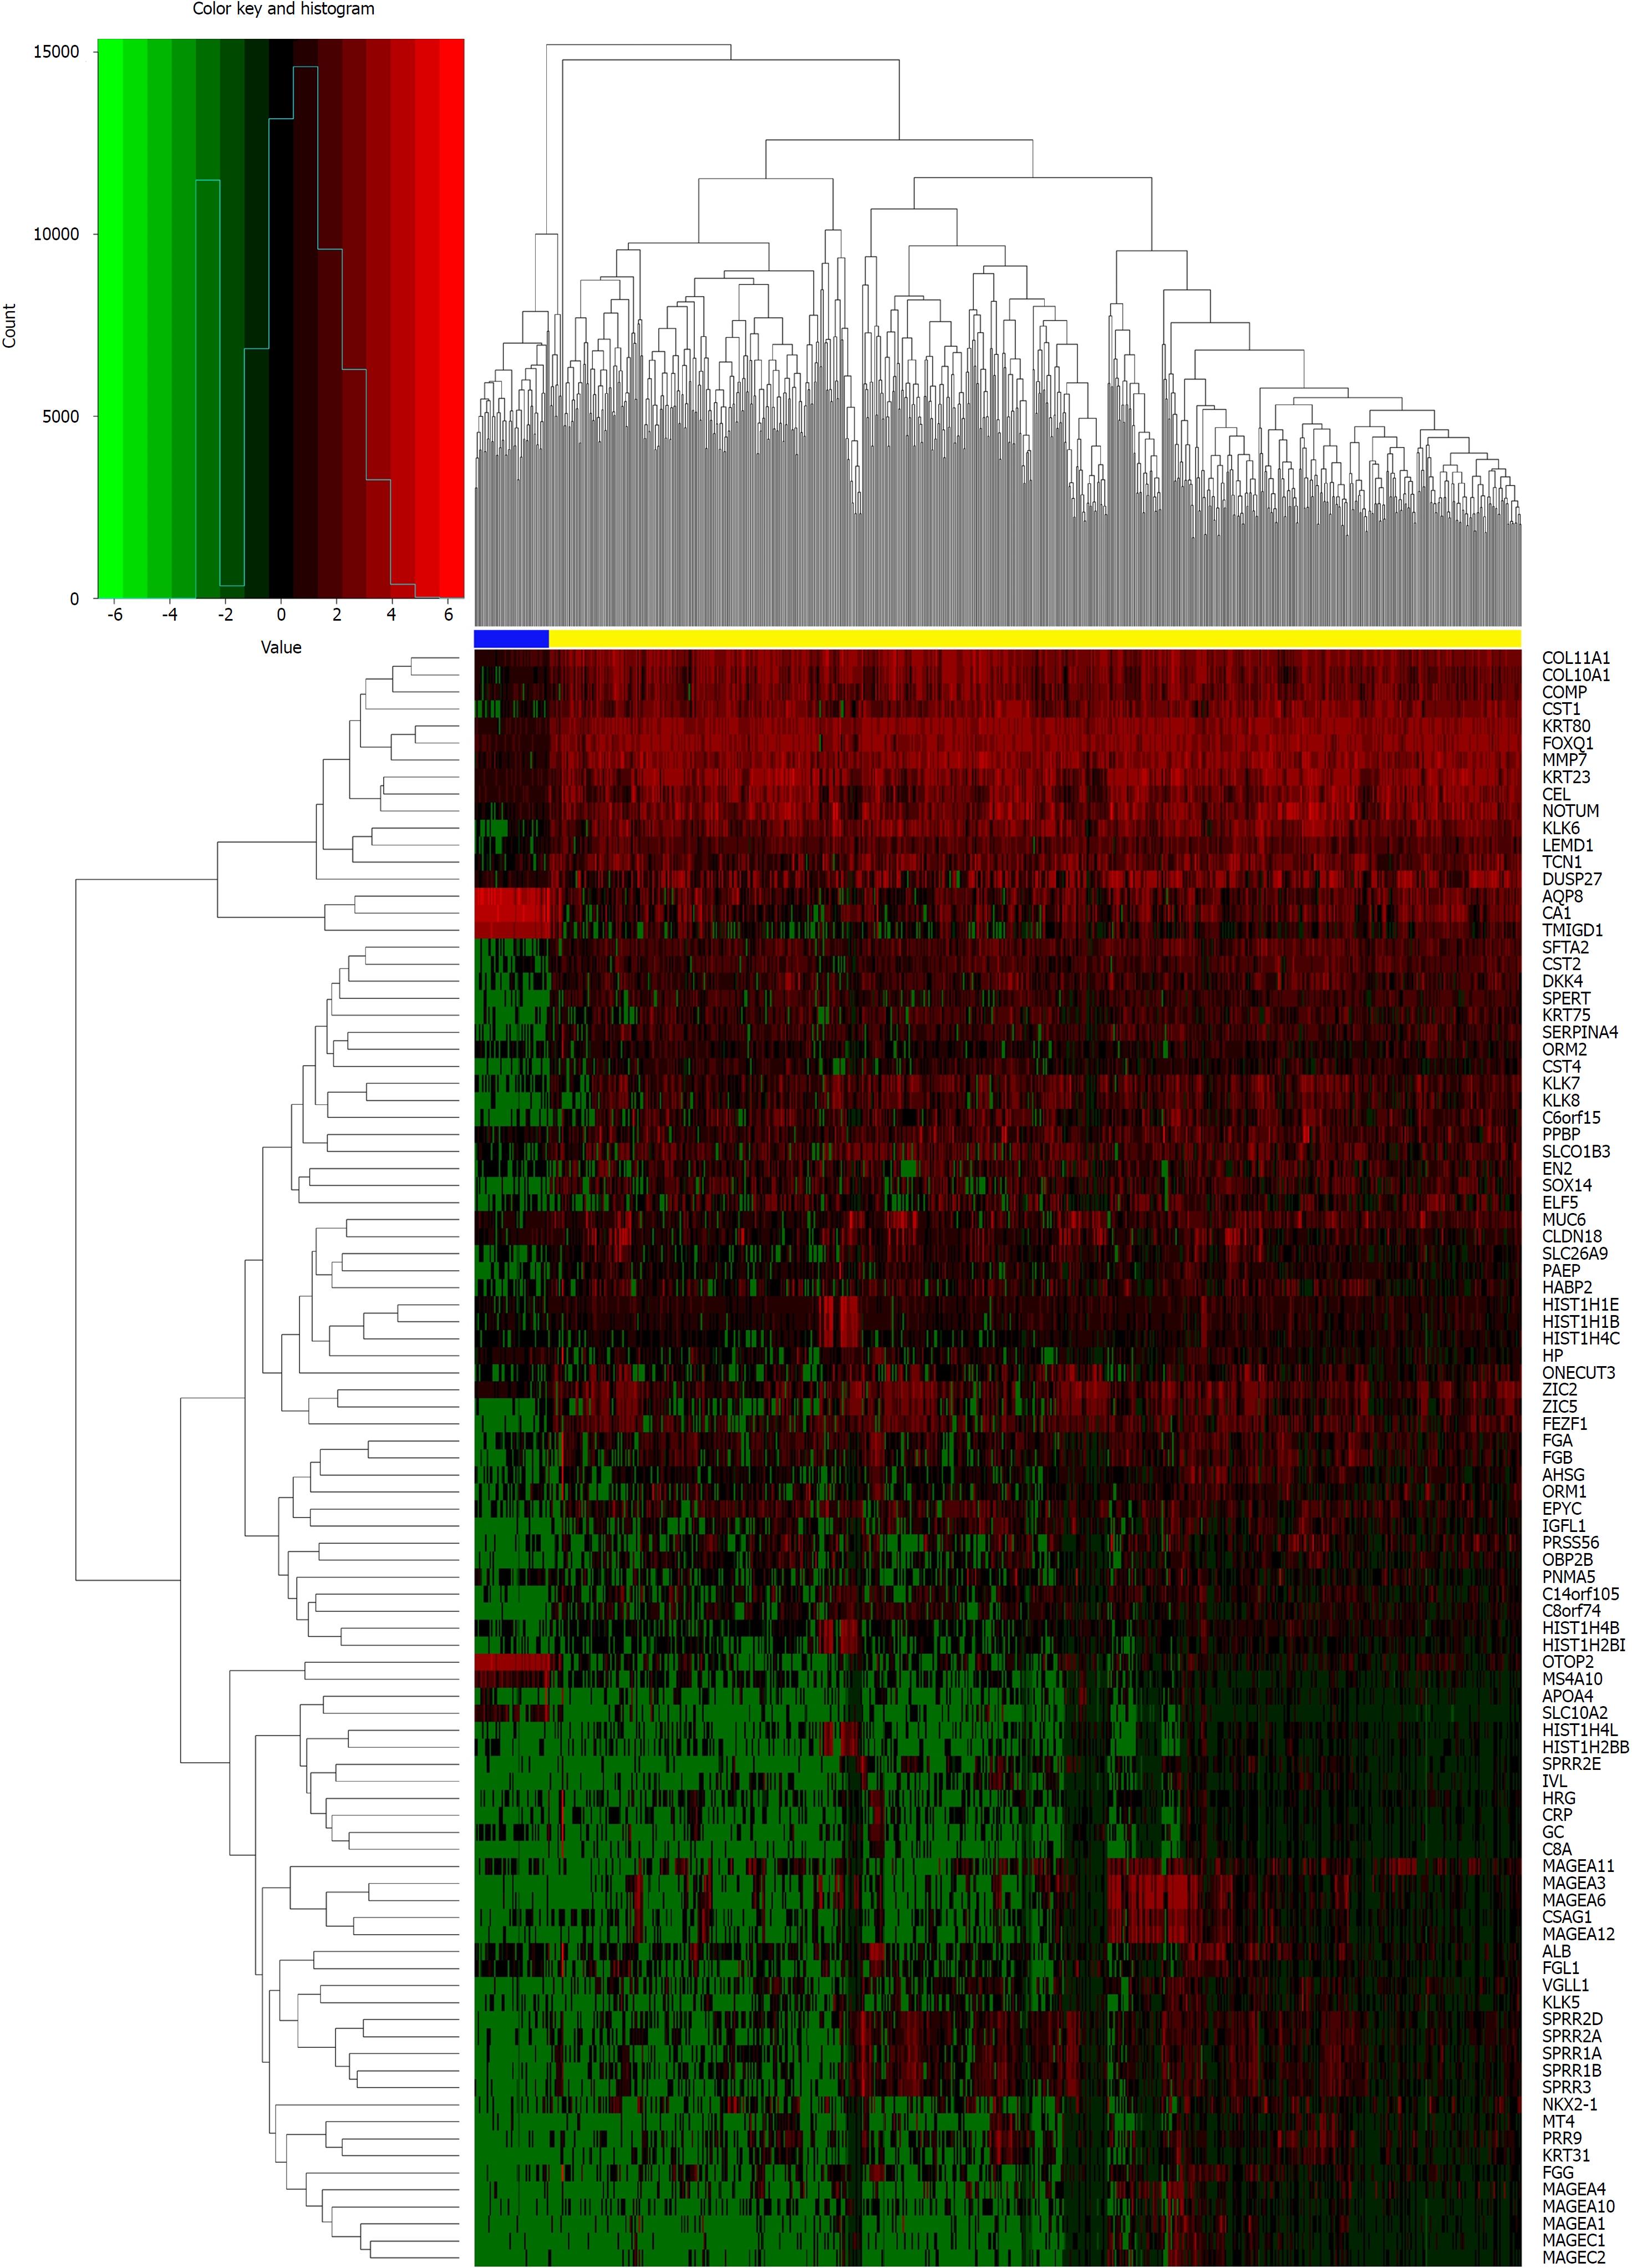
Figure 2 Heat map of differentially expressed mRNAs (log2 FC > 5, P < 0.
01). The above horizontal axis shows clusters of samples. The left vertical axis shows clusters of differentially expressed mRNAs and right vertical axis represents mRNA names. Red represents up-regulated genes and green represents down-regulated genes. The yellow color column represents colorectal cancer; the blue represents normal.
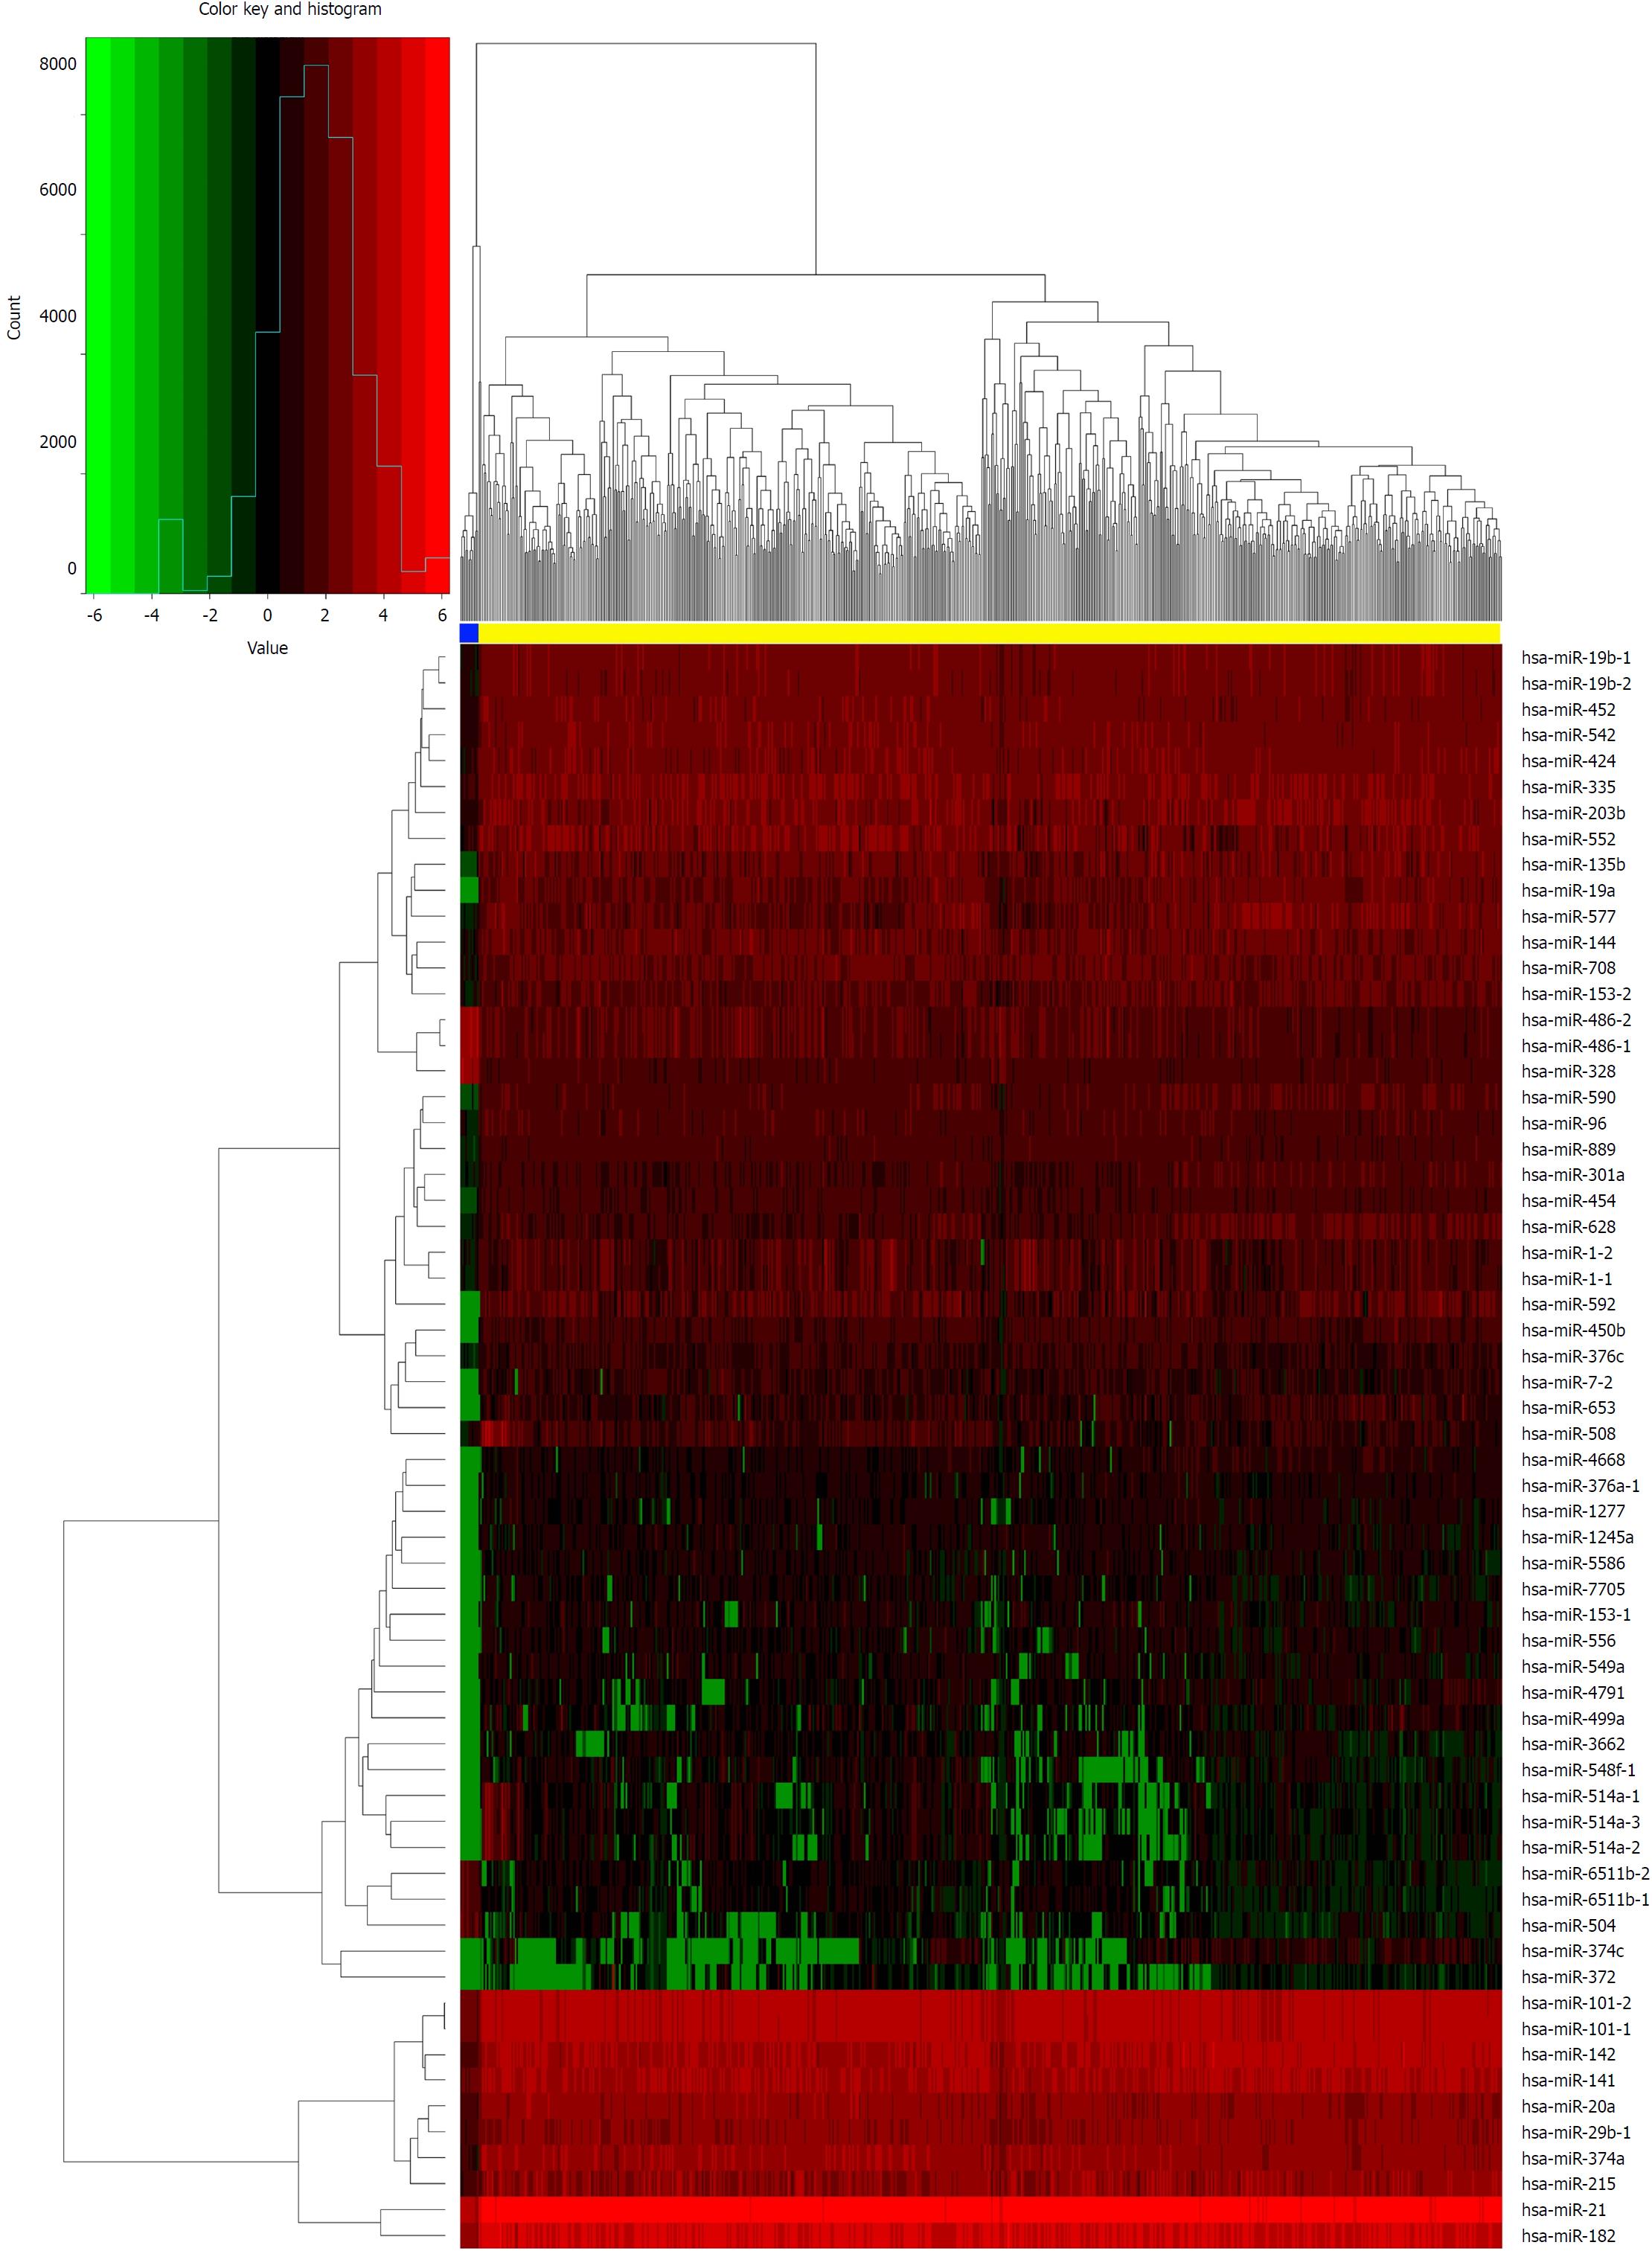
Figure 3 Heat map of differentially expressed microRNAs (log2 FC > 5, P < 0.
01). The above horizontal axis shows clusters of samples. The left vertical axis shows clusters of differentially expressed microRNAs (DEmiRNAs) and right vertical axis represents miRNA names. Red represents up-regulated genes and green represents down-regulated genes. The yellow color column represents colorectal cancer; the blue represents normal.
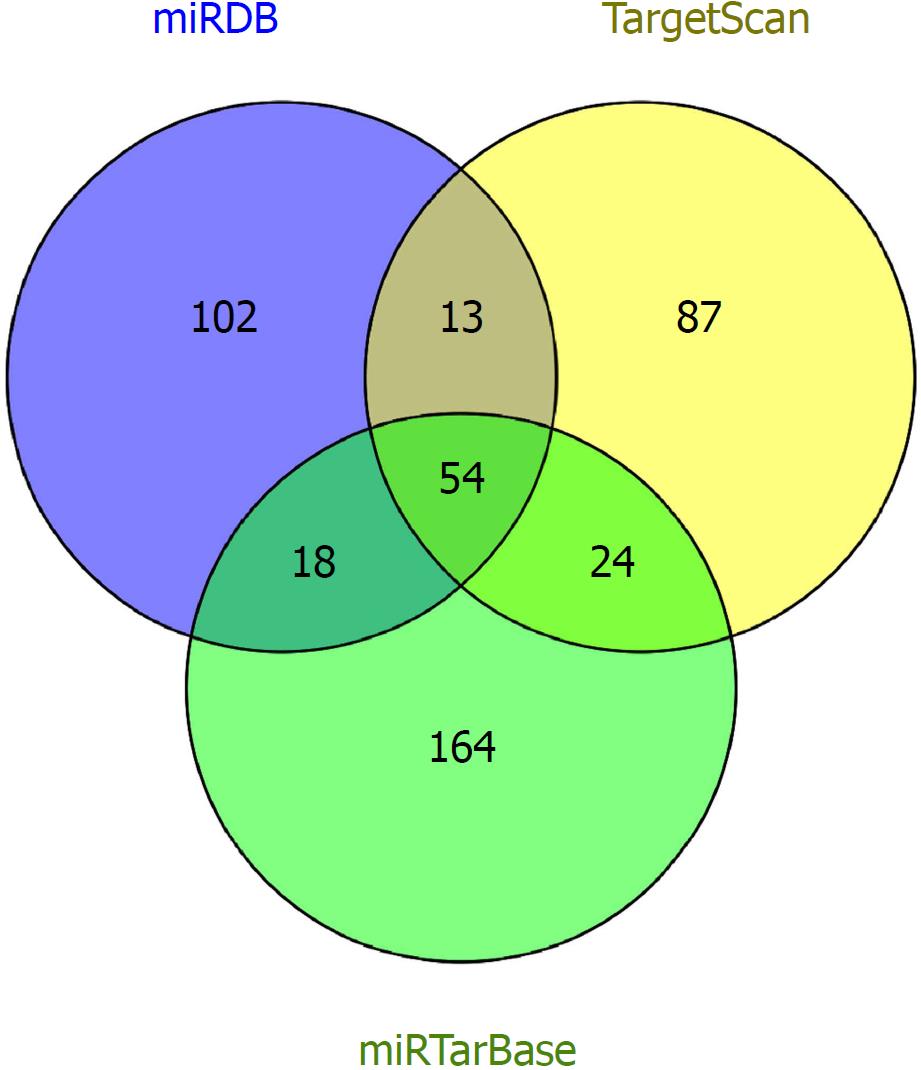
Figure 4 Consensus target genes of differentially expressed microRNAs.
The target genes of the differentially expressed microRNAs were predicted with three online databases (TargetScan, miRDB, and miRTarBase).
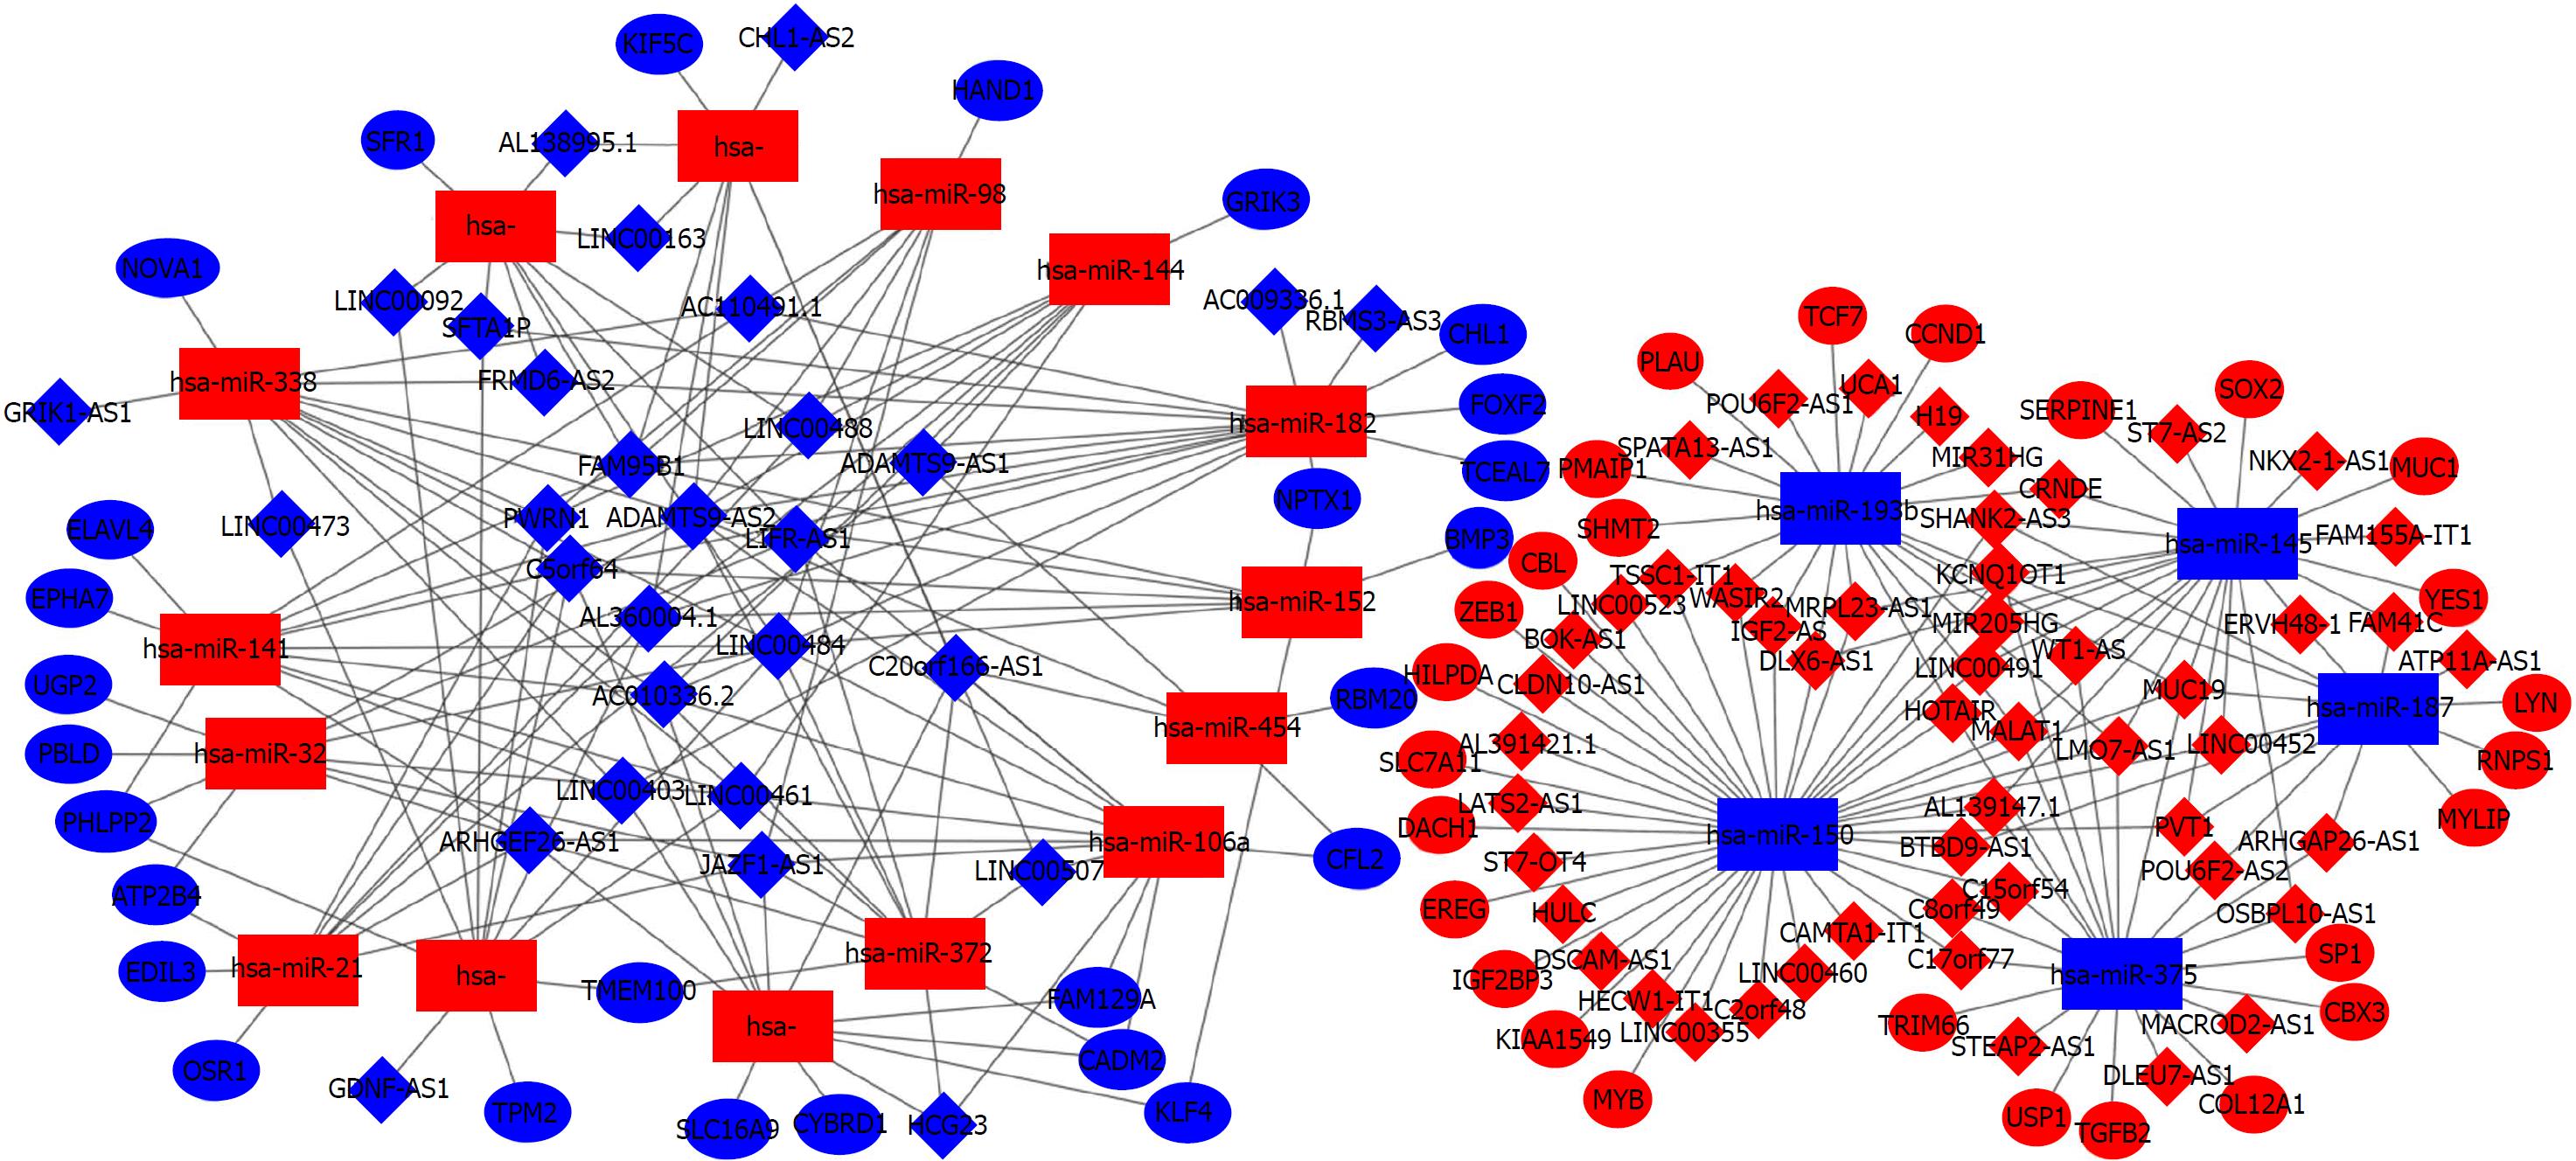
Figure 5 CeRNA networks of long-noncoding RNA-microRNA-mRNA in colorectal cancer.
The red represents the upregulated and the blue represents downregulated. Diamonds represent long-noncoding RNAs, balls represent mRNAs, and rectangles represent microRNAs.
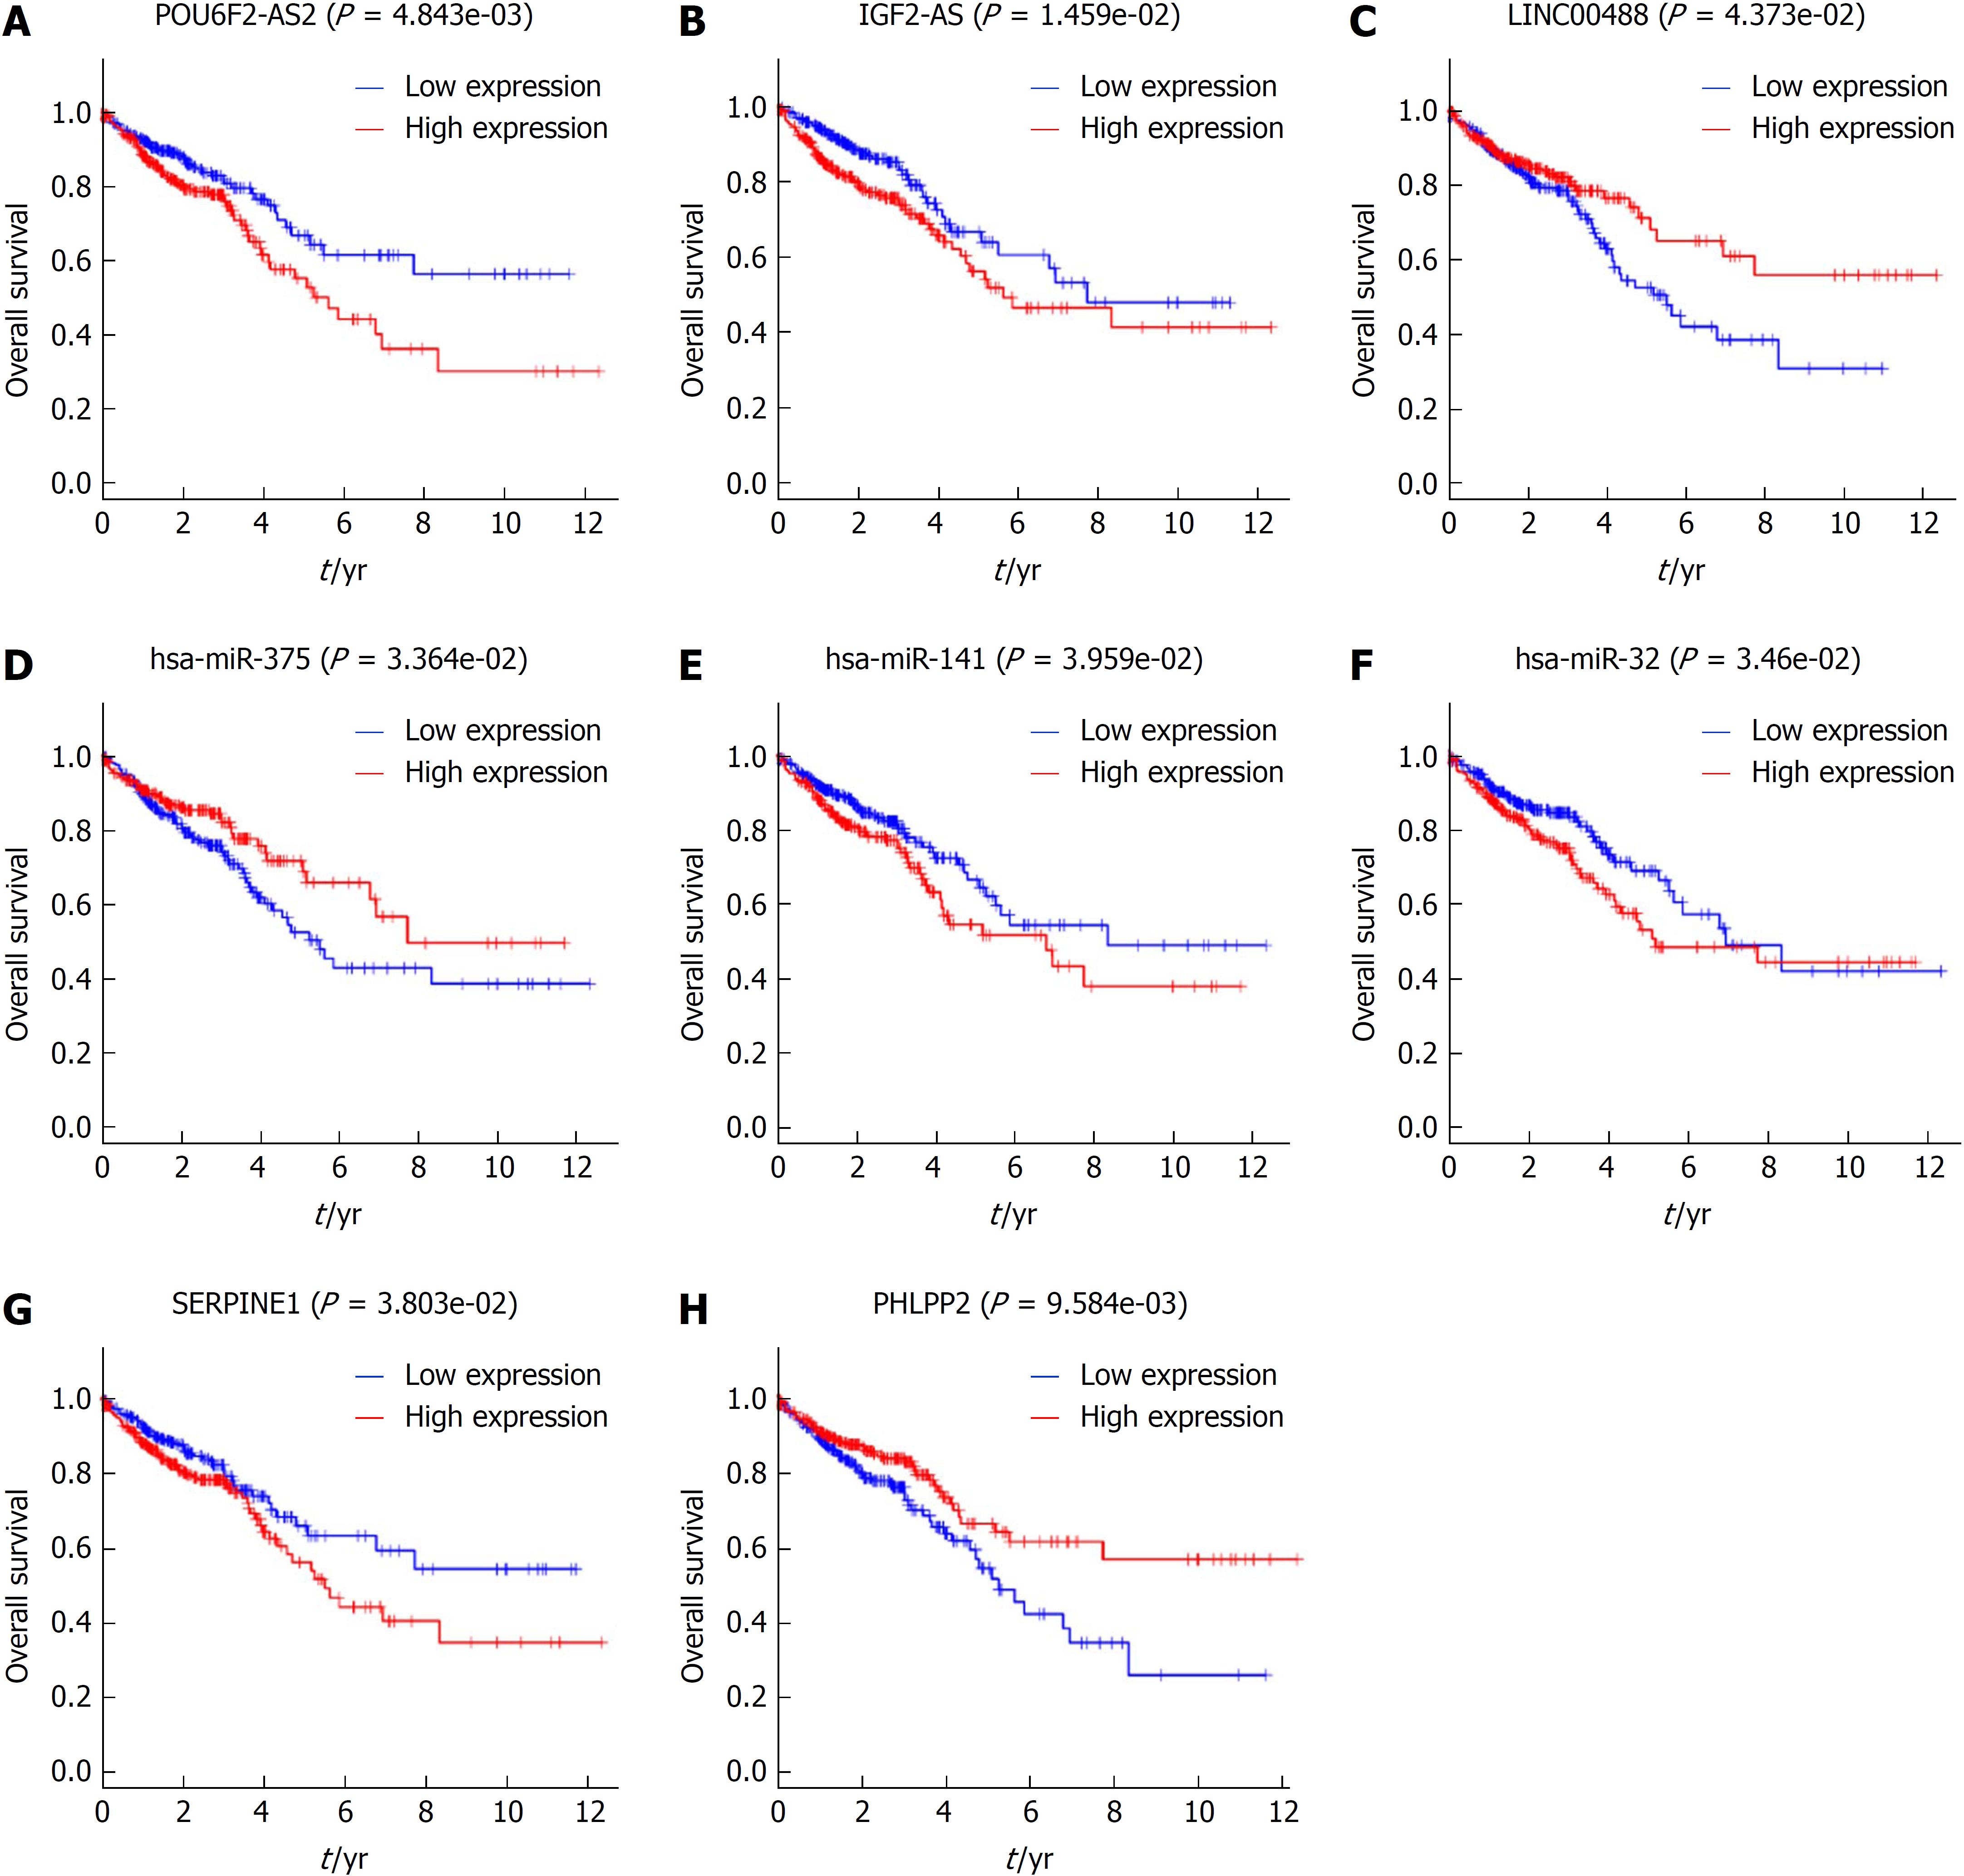
Figure 6 Kaplan-Meier curves for the 3 long-noncoding RNAs, 3 microRNAs, and 2 mRNAs that are associated with overall survival in colorectal cancer.
The differentially expressed genes were ranked by the median of expression and then scored for each colorectal cancer patient in accordance with high or low-level expression (horizontal axis: overall survival time; vertical axis: survival function).
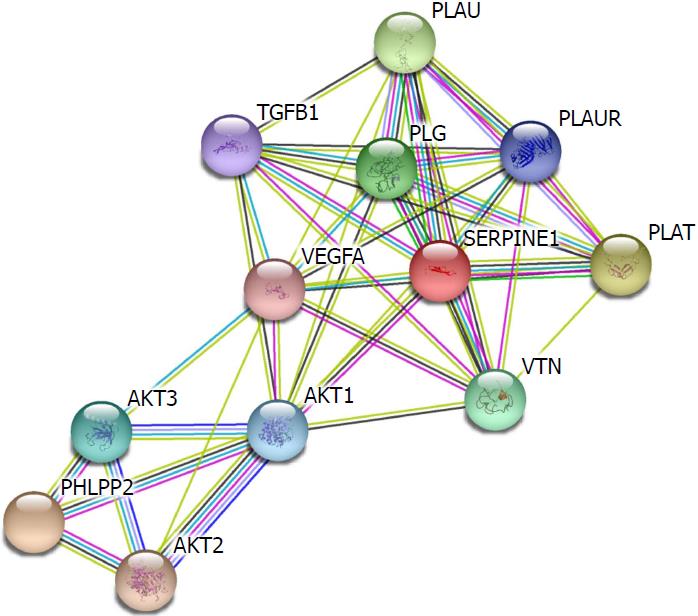
Figure 7 Protein-protein interactions of PHLPP2 and SERPINE1.
The STRING protein database was utilized to analyze the protein-protein interactions of SERPINE1 and PHLPP2.
Figure 8 IGF2-AS, POU6F2-AS2, and LINC00488 expression levels in colorectal cancer cell lines.
The expression of the three long-noncoding RNAs in HT29, LoVo, and SW480 and normal intestinal epithelial cell line NCM460 was detected by RT-qPCR and GAPDH was used as an internal control. aP < 0.01.
- Citation: Liang Y, Zhang C, Ma MH, Dai DQ. Identification and prediction of novel non-coding and coding RNA-associated competing endogenous RNA networks in colorectal cancer. World J Gastroenterol 2018; 24(46): 5259-5270
- URL: https://www.wjgnet.com/1007-9327/full/v24/i46/5259.htm
- DOI: https://dx.doi.org/10.3748/wjg.v24.i46.5259


