Copyright
©The Author(s) 2018.
World J Gastroenterol. Dec 7, 2018; 24(45): 5179-5188
Published online Dec 7, 2018. doi: 10.3748/wjg.v24.i45.5179
Published online Dec 7, 2018. doi: 10.3748/wjg.v24.i45.5179
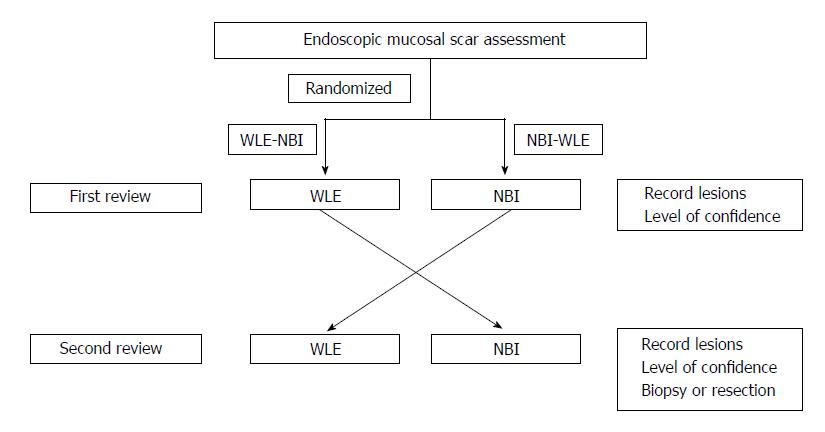
Figure 1 Study protocol.
Prediction of residual adenoma/hyperplastic tissue by the endoscopist with a level of confidence: Positive or: Negative. WLE: White light endoscopy; NBI: Narrow band imaging.
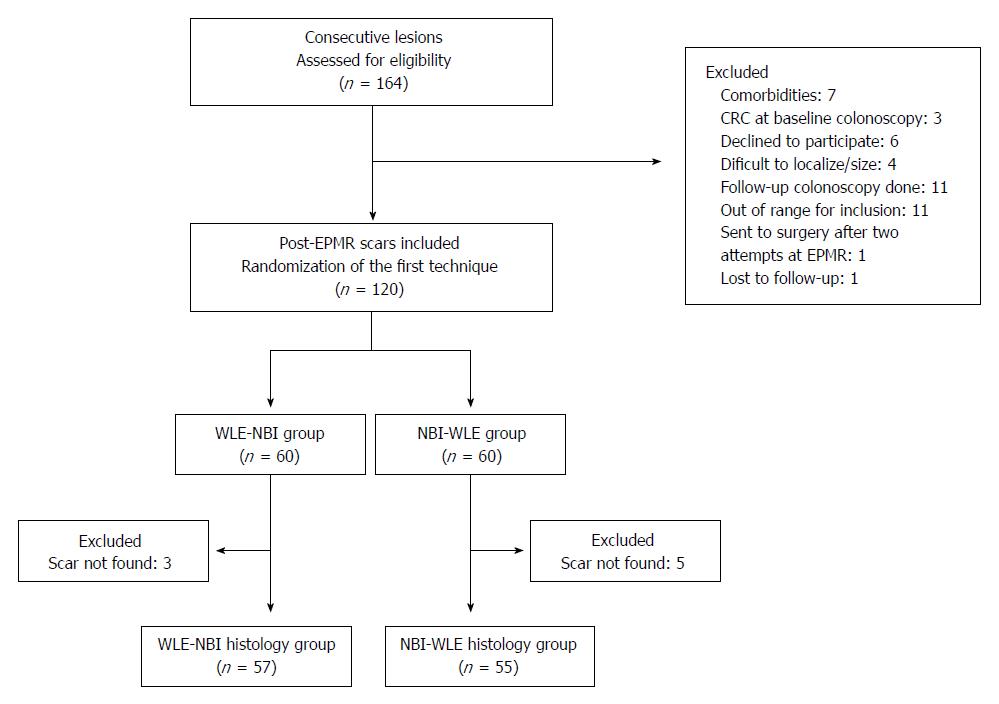
Figure 2 Flow diagram of study selection.
WLE: White light endoscopy; NBI: Narrow band imaging; EPMR: Endoscopic piecemeal mucosal resection; CRC: Colorectal cancer.
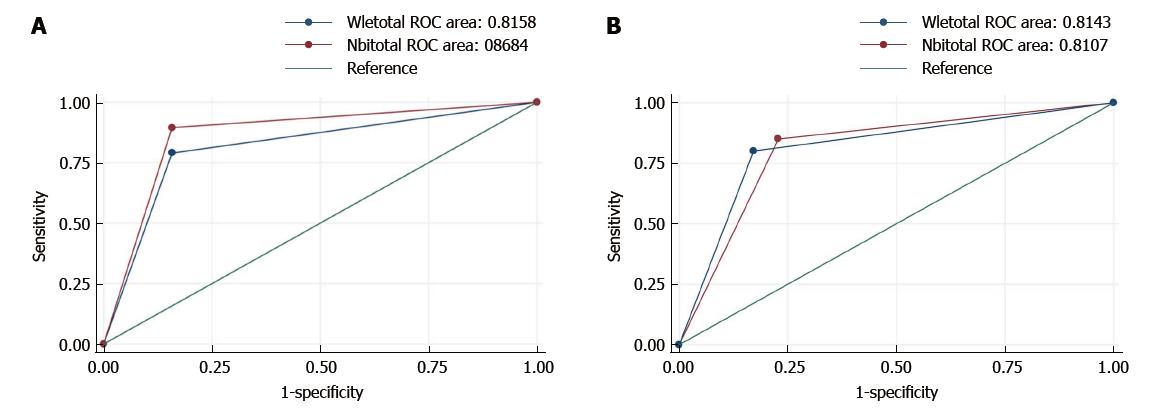
Figure 3 Receiver operating characteristic curve.
Global assessment of white light endoscopy (WLE) and narrow band imaging (NBI) is drawn for each group. A: WLE-NBI; B: NBI-WLE. The cut-off of the best area under the operating characteristic curve (ROC) curve is the true positive rate (sensitivity) plotted to the false positive rate (1.0-specificity). The closer the ROC curve to the upper left corner, the higher the accuracy of the test.
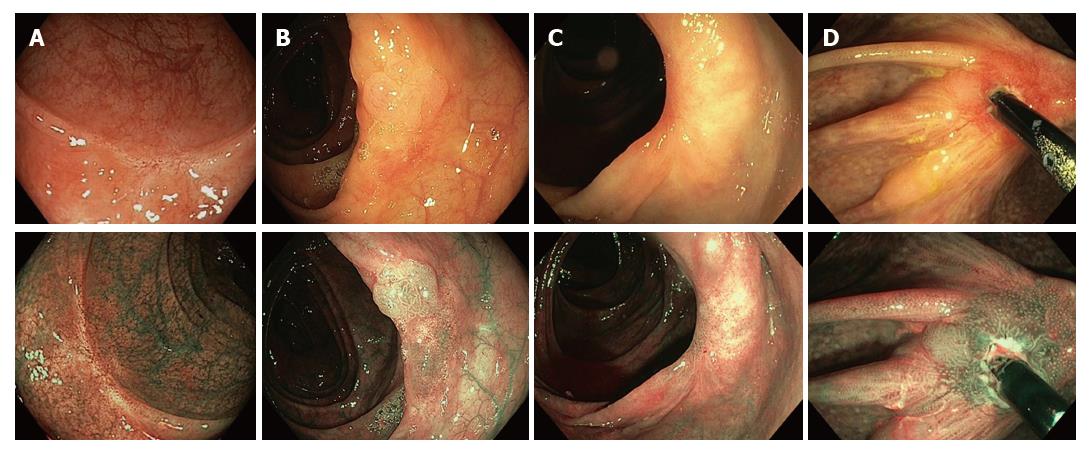
Figure 4 Examples of endoscopic mucosal scar with white light endoscopy and narrow band imaging (above and below and from left to right).
A: Normal scar; B: Clear residual tissue of a surprisingly sessile serrated polyp/adenoma with no dysplasia on either the scar or endoscopic piecemeal mucosal resection; C: Apparent normal tissue with low-grade dysplasia at histology; D: Small residual tissue with low-grade dysplasia surrounding a clip (a clip artifact).
- Citation: Riu Pons F, Andreu M, Gimeno Beltran J, Álvarez-Gonzalez MA, Seoane Urgorri A, Dedeu JM, Barranco Priego L, Bessa X. Narrow band imaging and white light endoscopy in the characterization of a polypectomy scar: A single-blind observational study. World J Gastroenterol 2018; 24(45): 5179-5188
- URL: https://www.wjgnet.com/1007-9327/full/v24/i45/5179.htm
- DOI: https://dx.doi.org/10.3748/wjg.v24.i45.5179


