Copyright
©The Author(s) 2018.
World J Gastroenterol. Nov 21, 2018; 24(43): 4906-4919
Published online Nov 21, 2018. doi: 10.3748/wjg.v24.i43.4906
Published online Nov 21, 2018. doi: 10.3748/wjg.v24.i43.4906
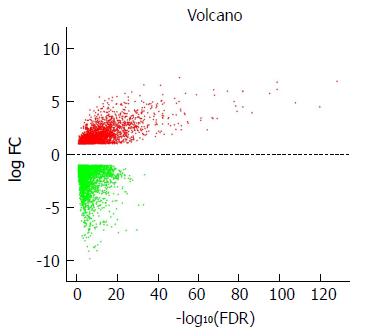
Figure 1 Volcano plot of the differentially expressed mRNAs between stomach adenocarcinoma and para-carcinoma tissues.
Red indicates high expression and green indicates low expression (|log2FC| > 1 and adjusted P value < 0.05). The X axis represents a false discovery rate (FDR) value and the Y axis represents a log2FC. Differential mRNAs were calculated by edgeR. There were 2456 highly expressed and 3775 lowly expressed mRNAs. This volcano plot was conducted by the ggplot2 package of R language. FDR: False discovery rate.
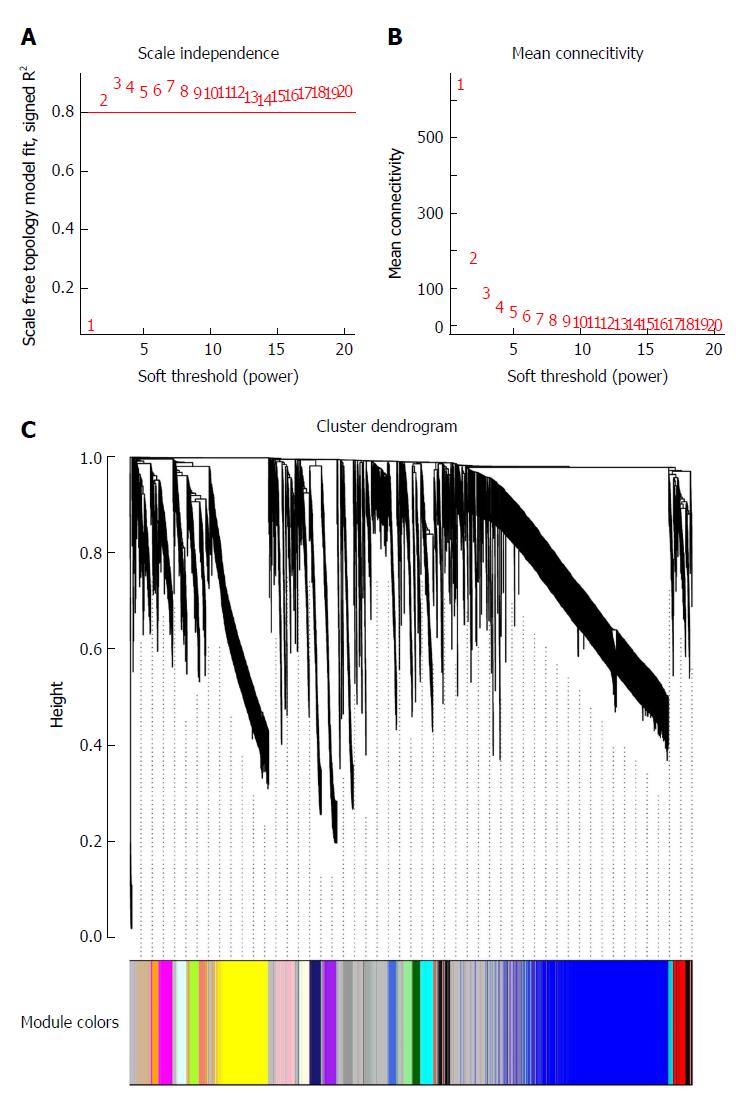
Figure 2 Determination of soft-thresholding power in weighted gene co-expression network analysis and gene clustering dendrograms.
A: Analysis of the scale-free fit index for various soft-thresholding powers (β); B: Analysis of the mean connectivity for various soft-thresholding powers; C: Gene clustering tree (dendrogram) obtained by hierarchical clustering of adjacency-based dissimilarity.
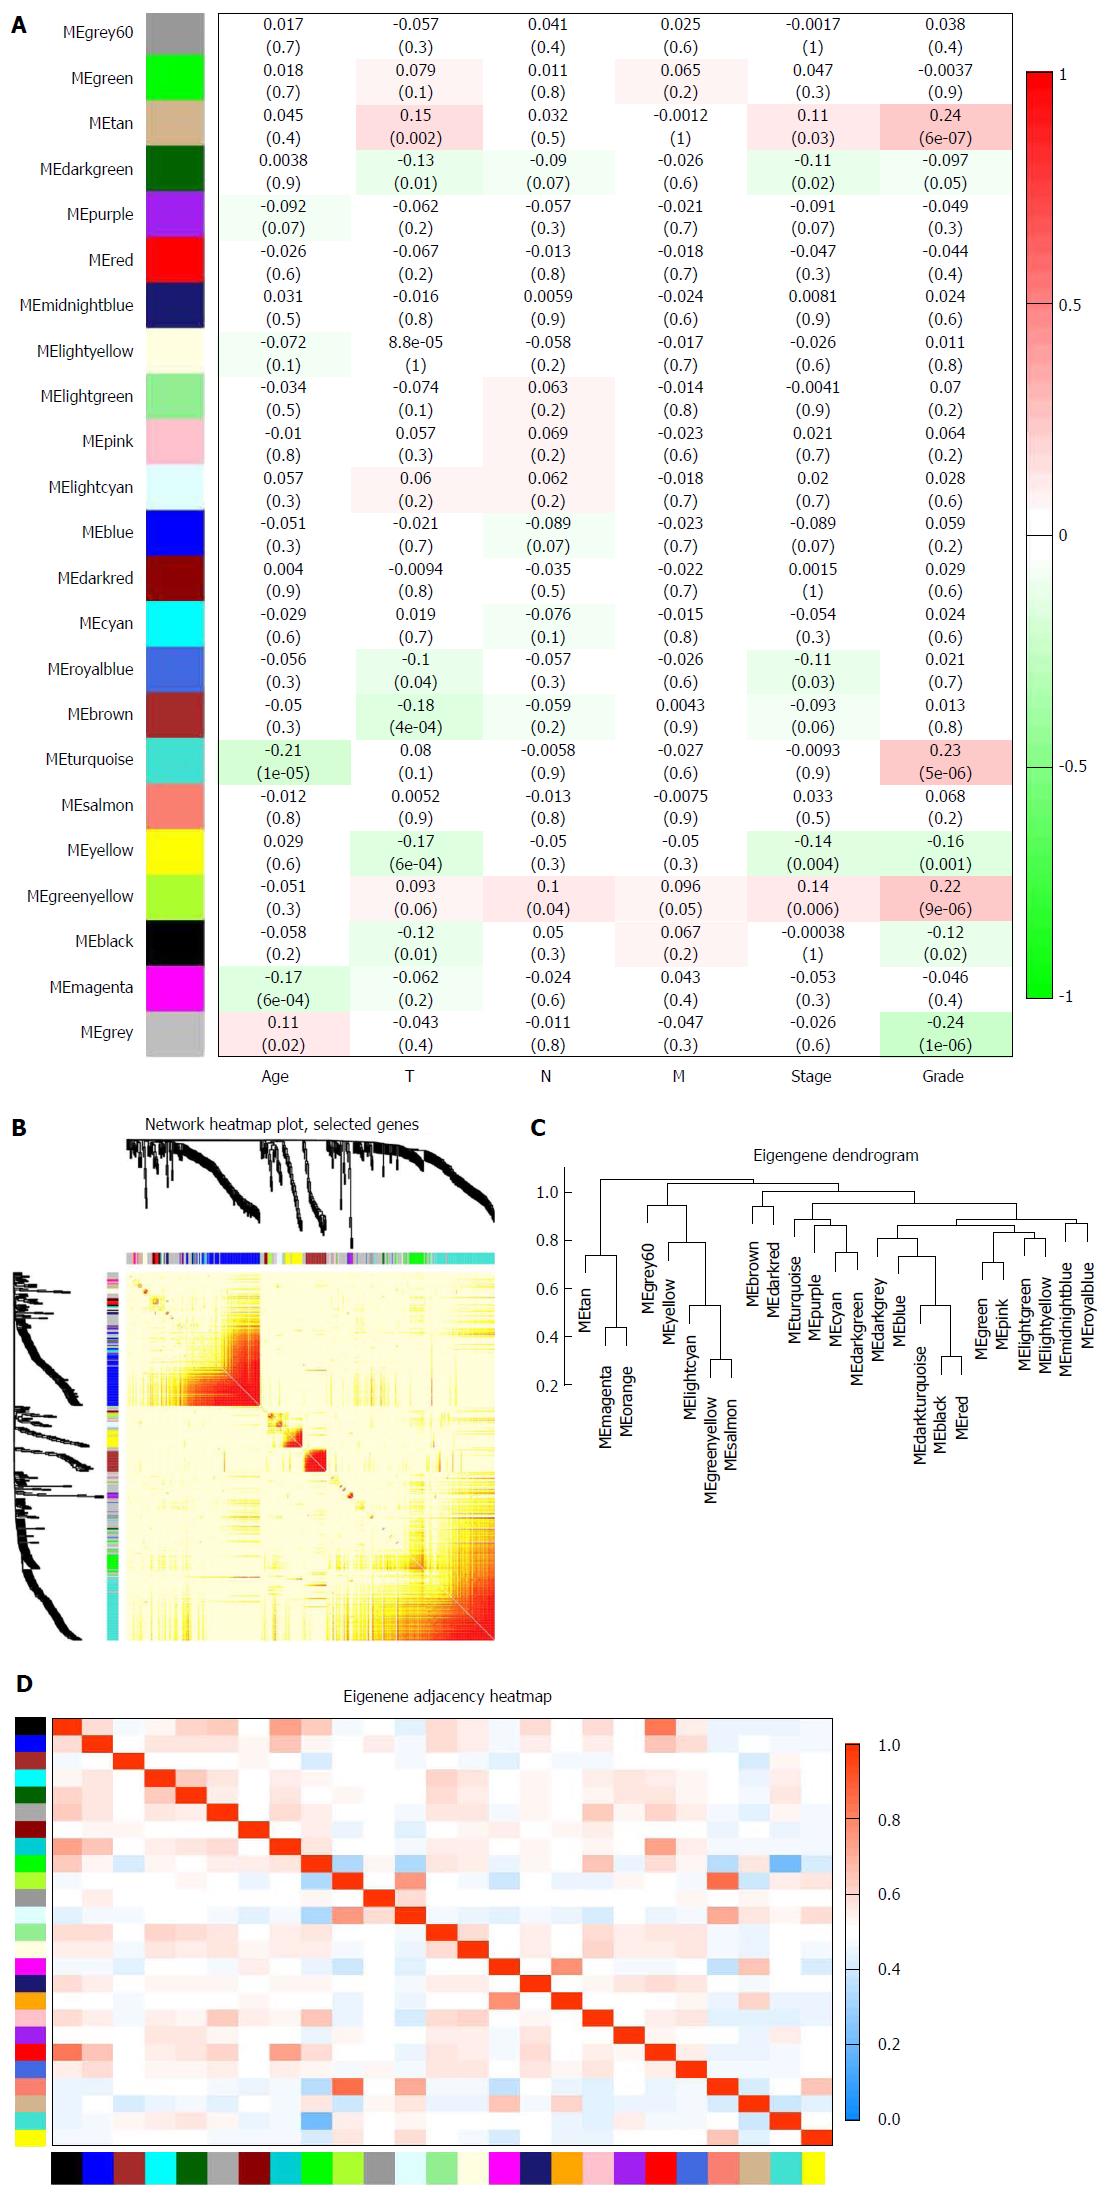
Figure 3 Identification of modules associated with clinical traits of stomach adenocarcinoma.
A: Heat map of the correlation between module eigengenes and clinical traits of stomach adenocarcinoma (SA); B: Topological overlap matrix (TOM) plot; C: Visualization of hierarchical clustering dendrogram of the eigengenes. The eigen gene network represents the relationships among modules; D: Heat map of the eigengene adjacency. The color bars on the left and below indicate the module for each row or column.
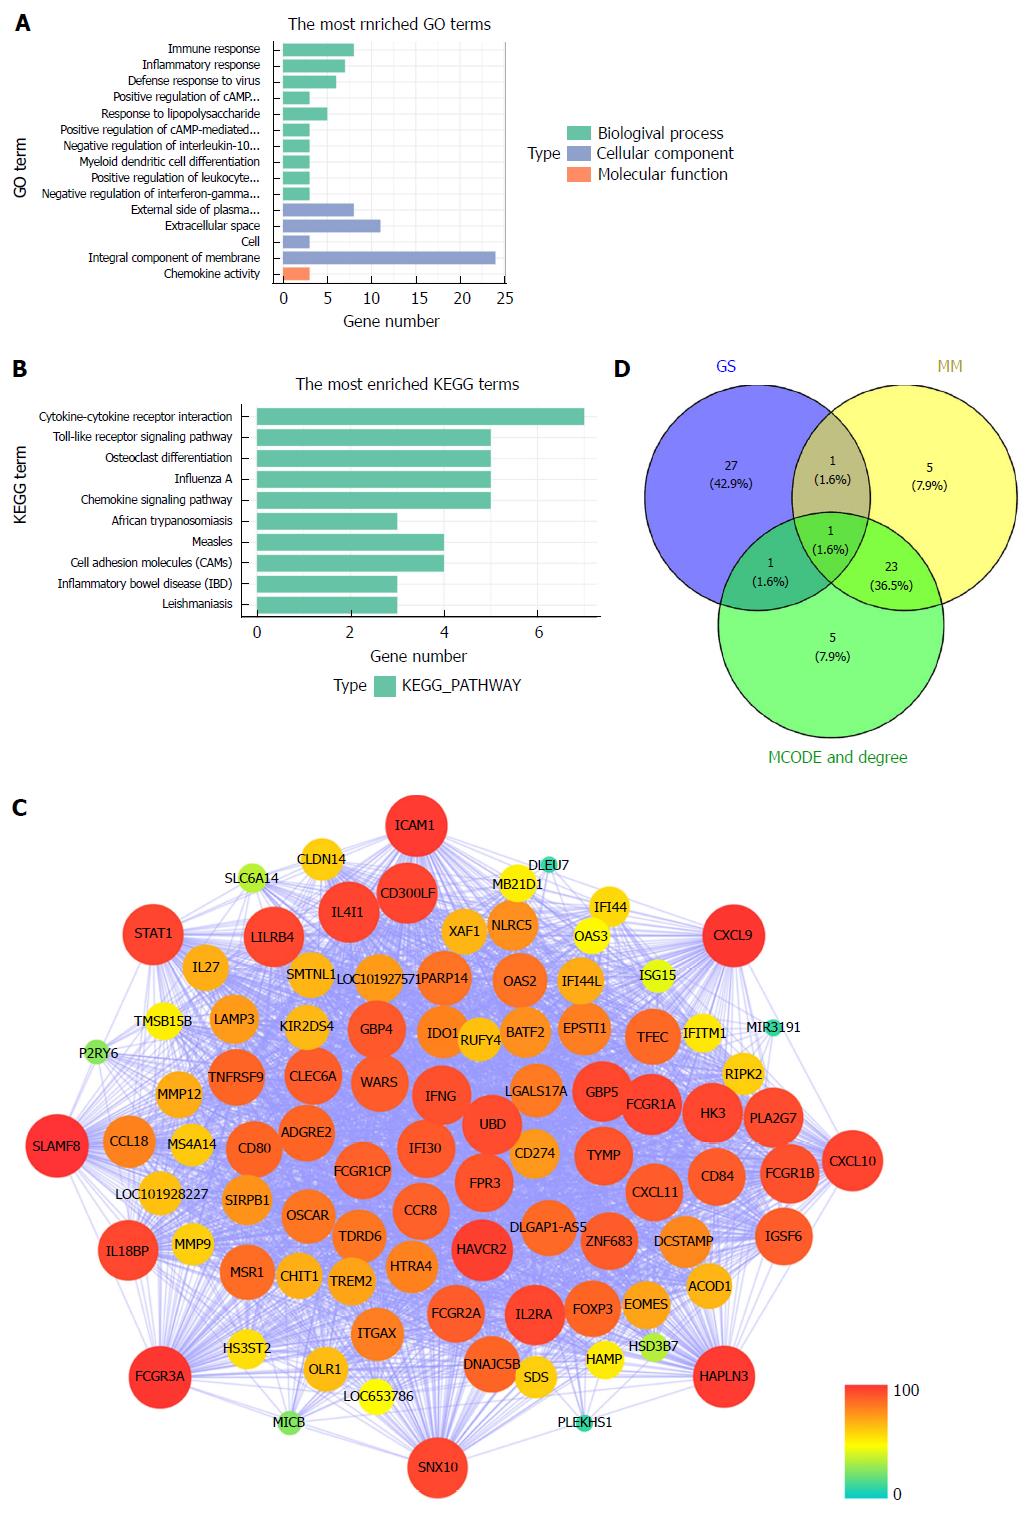
Figure 4 Module functional annotation and hub gene identification.
A and B: Gene Ontology (GO) functional and Kyoto Encyclopedia of Genes and Genomes (KEGG) pathway analysis for genes in the tan-module. The X-axis shows the number of genes and the Y-axis shows the GO and KEGG terms; C: Weighted co-expression network for tan-module genes. (nodes are colored according to the degree, and sized according to the Molecular Complex Detection (MCODE) score); D: Hub genes were screened with module membership (MM), gene significance (GS) and MCODE. GO: Gene Ontology; KEGG: Kyoto Encyclopedia of Genes and Genomes; GS: Gene significance; MM: Module membership; MCODE: Molecular Complex Detection.
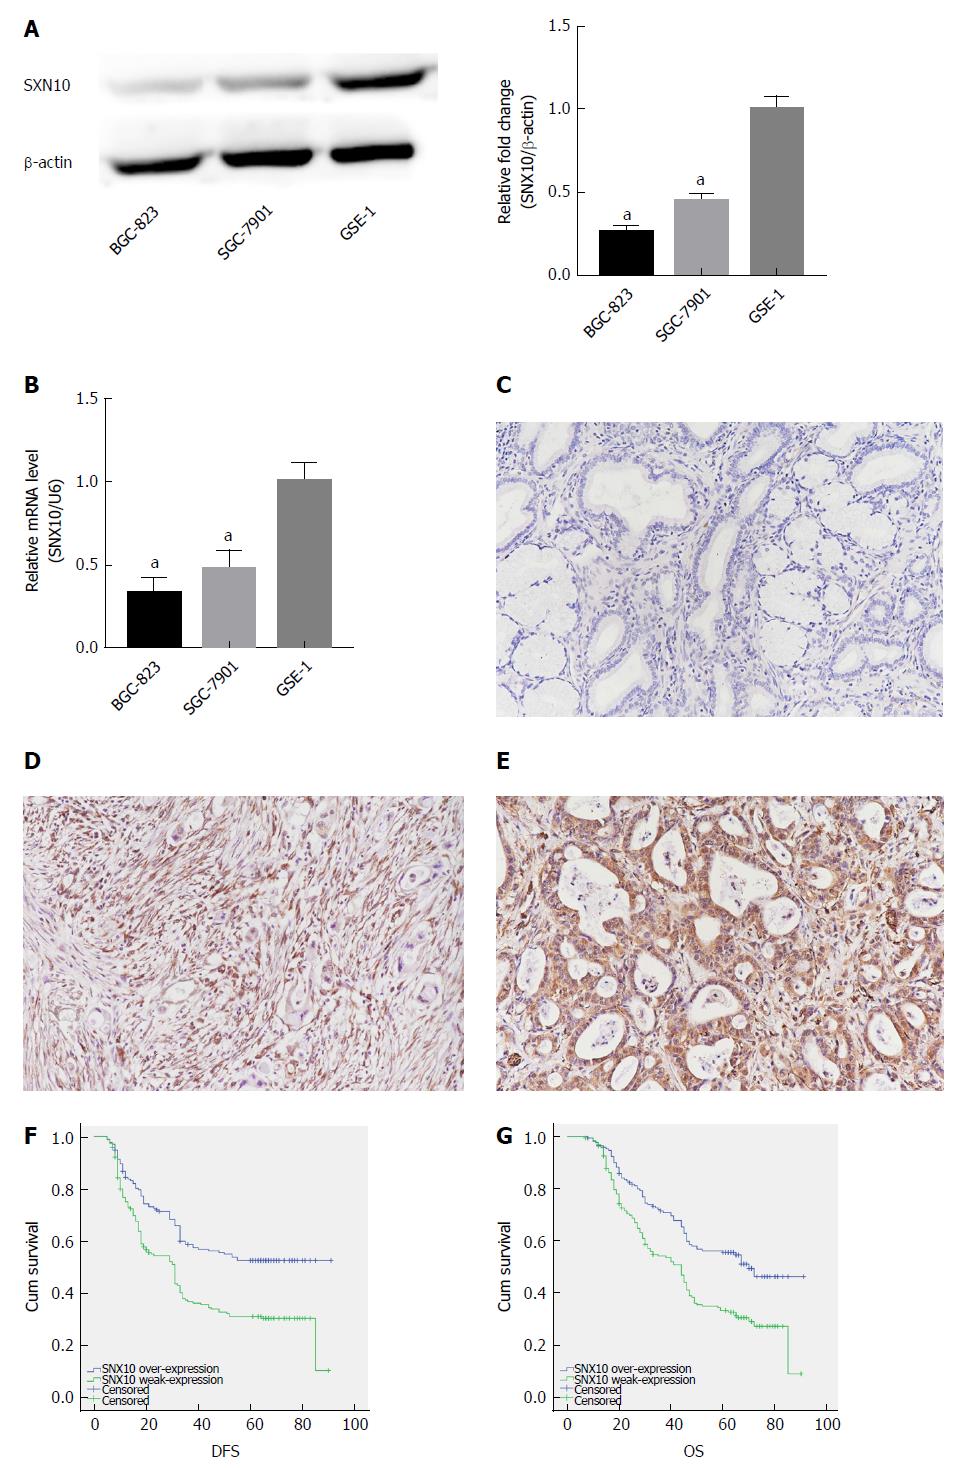
Figure 5 Expression of sorting nexin 10 in stomach adenocarcinoma cells and tissue and its effect on survival.
A: Sorting nexin 10 (SNX10) protein expression in stomach adenocarcinoma (SA) cell lines (SGC-7901 and BGC-823) and the human normal gastric epithelial cell line (GSE-1) by western blot. β-actin was used as a loading control; n = 3, aP < 0.05; B: SNX10 mRNA expression in SGC-7901, BGC-823 and GSE-1 by real time-PCR; n = 3, aP < 0.05; C: The representative negative result in SA tissue; magnifications are 200 ×; D: SNX10 was weakly expressed in SA tissue; magnifications are 200 ×; E: SNX10 had strong expression in SA tissue; magnifications are 200 ×; F: Disease free survival curves stratified by SNX10 expression (P = 0.00); G: Overall survival curves stratified by SNX10 expression (P = 0.00). DFS: Disease-free survival; OS: Overall survival; SNX10: Sorting nexin 10.
- Citation: Zhang J, Wu Y, Jin HY, Guo S, Dong Z, Zheng ZC, Wang Y, Zhao Y. Prognostic value of sorting nexin 10 weak expression in stomach adenocarcinoma revealed by weighted gene co-expression network analysis. World J Gastroenterol 2018; 24(43): 4906-4919
- URL: https://www.wjgnet.com/1007-9327/full/v24/i43/4906.htm
- DOI: https://dx.doi.org/10.3748/wjg.v24.i43.4906


