Copyright
©The Author(s) 2018.
World J Gastroenterol. Nov 21, 2018; 24(43): 4880-4892
Published online Nov 21, 2018. doi: 10.3748/wjg.v24.i43.4880
Published online Nov 21, 2018. doi: 10.3748/wjg.v24.i43.4880
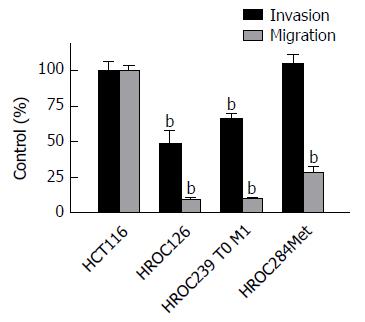
Figure 1 Migratory potential and invasiveness of individual rectal cancer cell lines.
Invasion and migration of HROC126, HROC239 T0 M1 and HROC284Met were analyzed in comparison to reference cell line HCT116. Cells were subjected to migration assay (migration, grey bars) and matrigel invasion assay (invasion, black bars). Values are mean ± SEM of n = 3; t-test bP < 0.01 vs HCT116.
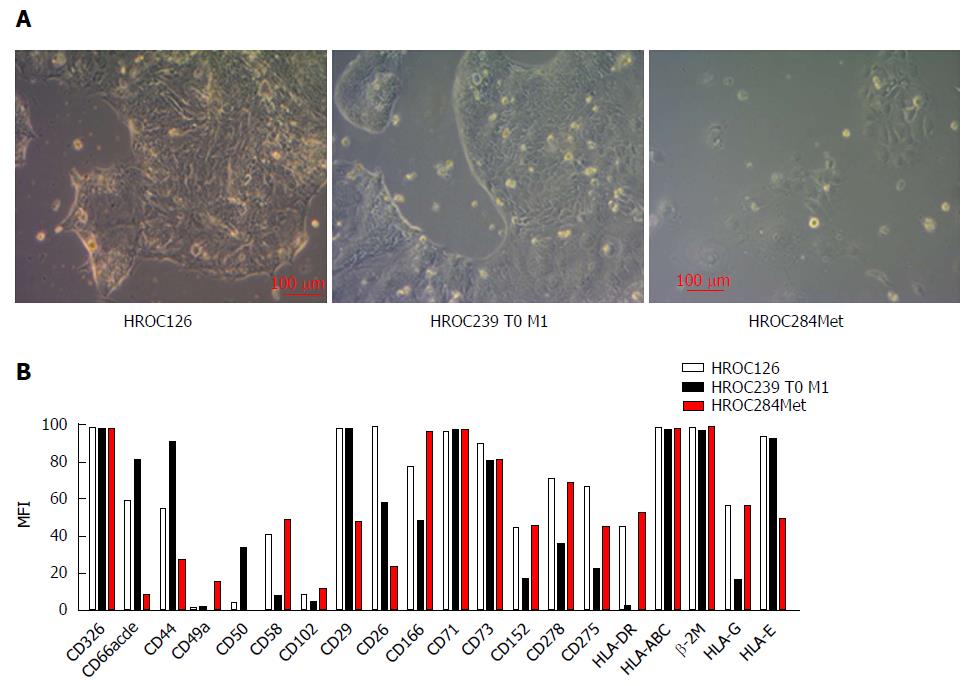
Figure 2 Morphology and phenotype of individual rectal cancer cell lines.
A: Light microscopy of freshly established tumor cell lines (all passage 6-11). Cell lines were established from patients’ tumor material as described in material and methods. Original magnification × 100; B: Phenotyping was conducted by flow cytometry (BD FACSARIA II) using fluorochrome-labeled mAbs as given on the x-axis. Exemplary data of one analysis out of three biological replicates are given. Some markers display a high variation in dependence from cell density in the culture vessels. HLA: Human leukocyte antigen.
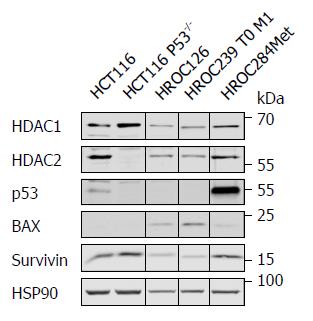
Figure 3 Expression of p53 and some of its targets in individual rectal cancer cell lines.
Western blot analysis of untreated HROC126, HROC239 T0 M1 and HROC284Met cells compared to HCT116 (p53 wildtype) and HCT116 p53-/- was performed. The levels of HDAC1, HDAC2, p53, BAX and survivin were assessed using specific antibodies. HSP90 was used as loading control.
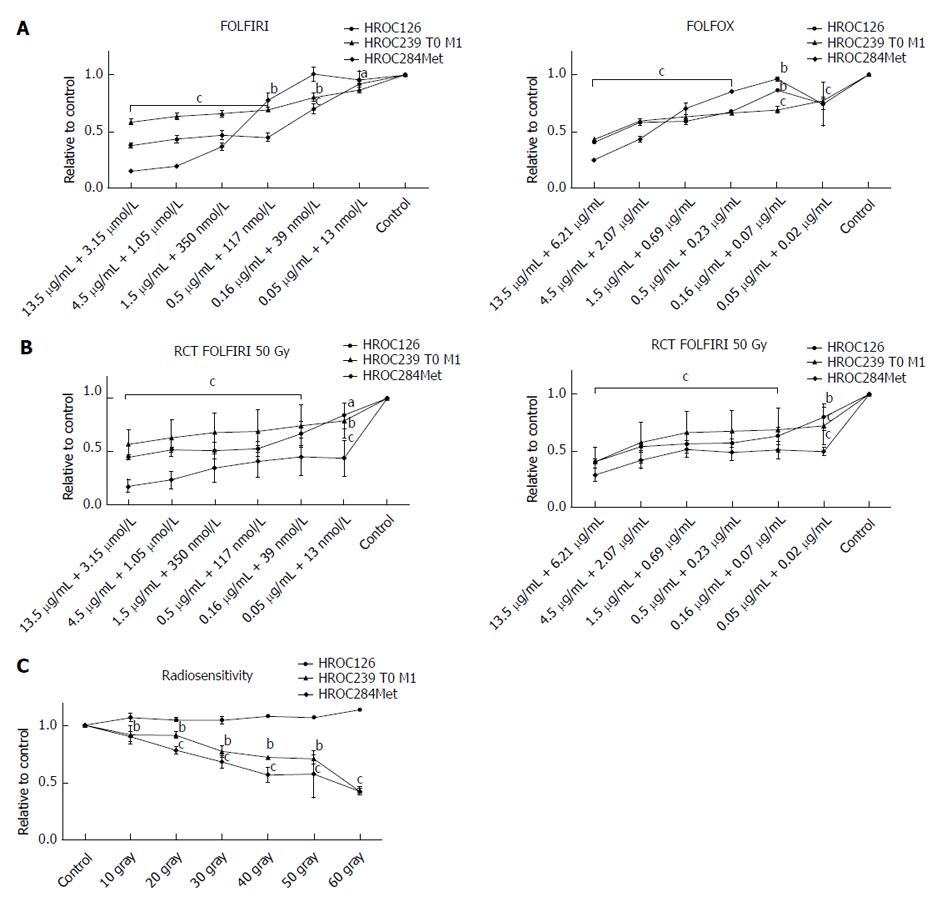
Figure 4 Analysis of chemo- and radiosensitivity.
A: Sensitivity of individual rectal cancer cell lines to FOLFOX and FOLFIRI chemotherapy; B: Sensitivity of cell lines to combination of irradion with 50 Gy and chemotherapy with FOLFIRI or FOLFOX; C: Radiosensitivity of rectal cancer cells. Cells were irradiated to different doses using a 137Cs-source. Cell viability of all experiments was measured using crystal violet assay. Values represent the mean absorbance at 570 nm ± SEM of n = 3 analyses; t-test aP < 0.05 vs control, bP < 0.01 vs control, cP < 0.0001 vs control.
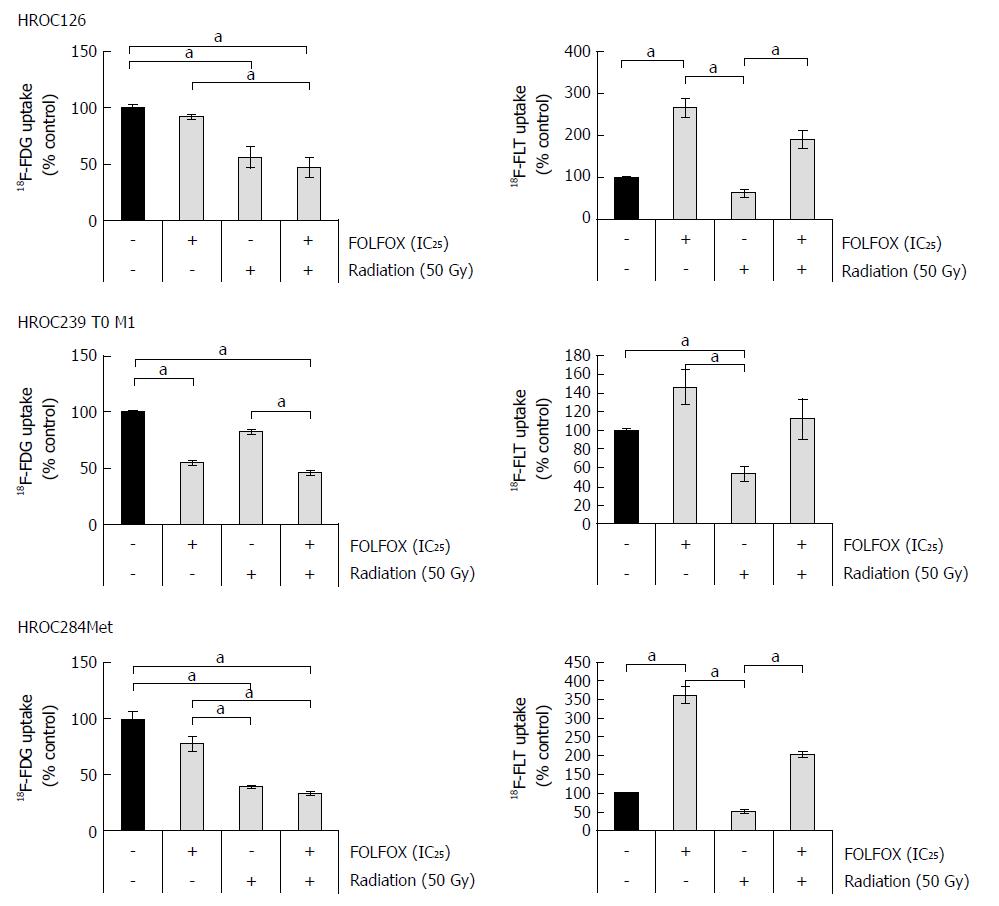
Figure 5 18F-fluorodeoxyglucose and 18F-fluorothymidine uptake.
Subconfluent-growing rectal cancer cells were either radiated (50 Gy), treated with FOLFOX (IC25) or challenged with combinations thereof. Rectal cancer cells were incubated with 18F-fluorodeoxyglucose or 18F-fluorothymidine, and uptake was quantified as described in the “materials and methods” section. Counts per minute were normalized to total protein content of the samples. One hundred percent 18F uptake corresponds to solvent-treated cancer cells (n = 10); aP < 0.05 vs control cultures (Kruskal-Wallis test with post hoc Dunn’s test). 18F-FDG: 18F-fluorodeoxyglucose; 18F-FLT: 18F-fluorothymidine.
- Citation: Gock M, Mullins CS, Bergner C, Prall F, Ramer R, Göder A, Krämer OH, Lange F, Krause BJ, Klar E, Linnebacher M. Establishment, functional and genetic characterization of three novel patient-derived rectal cancer cell lines. World J Gastroenterol 2018; 24(43): 4880-4892
- URL: https://www.wjgnet.com/1007-9327/full/v24/i43/4880.htm
- DOI: https://dx.doi.org/10.3748/wjg.v24.i43.4880


