Copyright
©The Author(s) 2018.
World J Gastroenterol. Nov 7, 2018; 24(41): 4663-4678
Published online Nov 7, 2018. doi: 10.3748/wjg.v24.i41.4663
Published online Nov 7, 2018. doi: 10.3748/wjg.v24.i41.4663
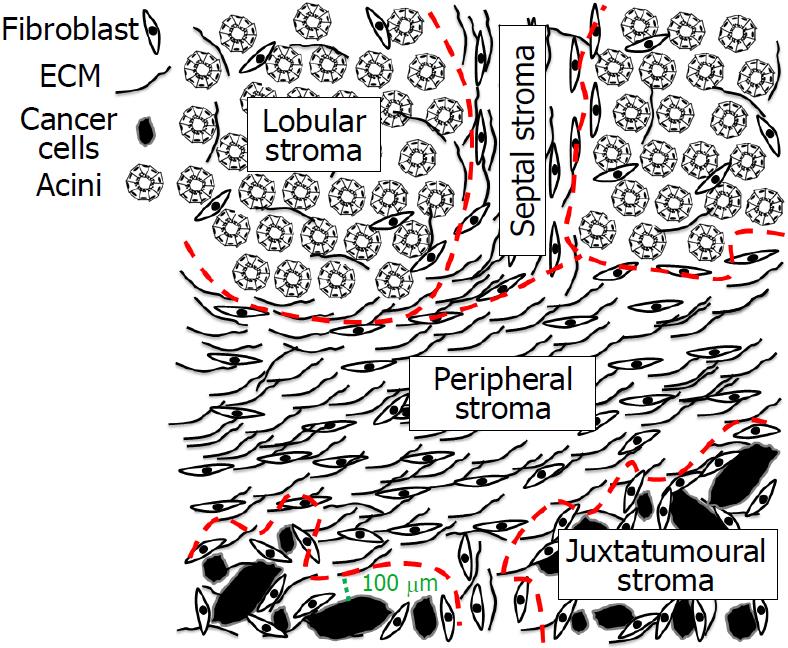
Figure 1 Simplified, schematic depiction of four stromal compartments in surgical specimens with pancreatic cancer.
We defined two compartments within the tumour (the juxtatumoural and the peripheral stroma) and two compartments in the surrounding pancreatic parenchyma (the lobular and the septal stroma). The juxtatumoural stromal compartment, containing juxtatumoural cancer-associated fibroblasts and juxtatumoural extracellular matrix, is defined as the stroma at a distance of ≤ 100 μm away from the cancer cells. The peripheral stromal compartment, containing peripheral cancer-associated fibroblasts and peripheral extracellular matrix (p-ECM), is located > 100 μm away from the cancer cells. The lobular stromal compartment, containing lobular fibroblasts and lobular ECM, is defined as the stroma located in the intralobular areas, surrounding acinar cells and islets of Langerhans. The septal stromal compartment, containing septal fibroblasts and septal ECM, is defined as the stroma in the perilobular areas, surrounding the pancreatic lobuli. ECM: Extracellular matrix.
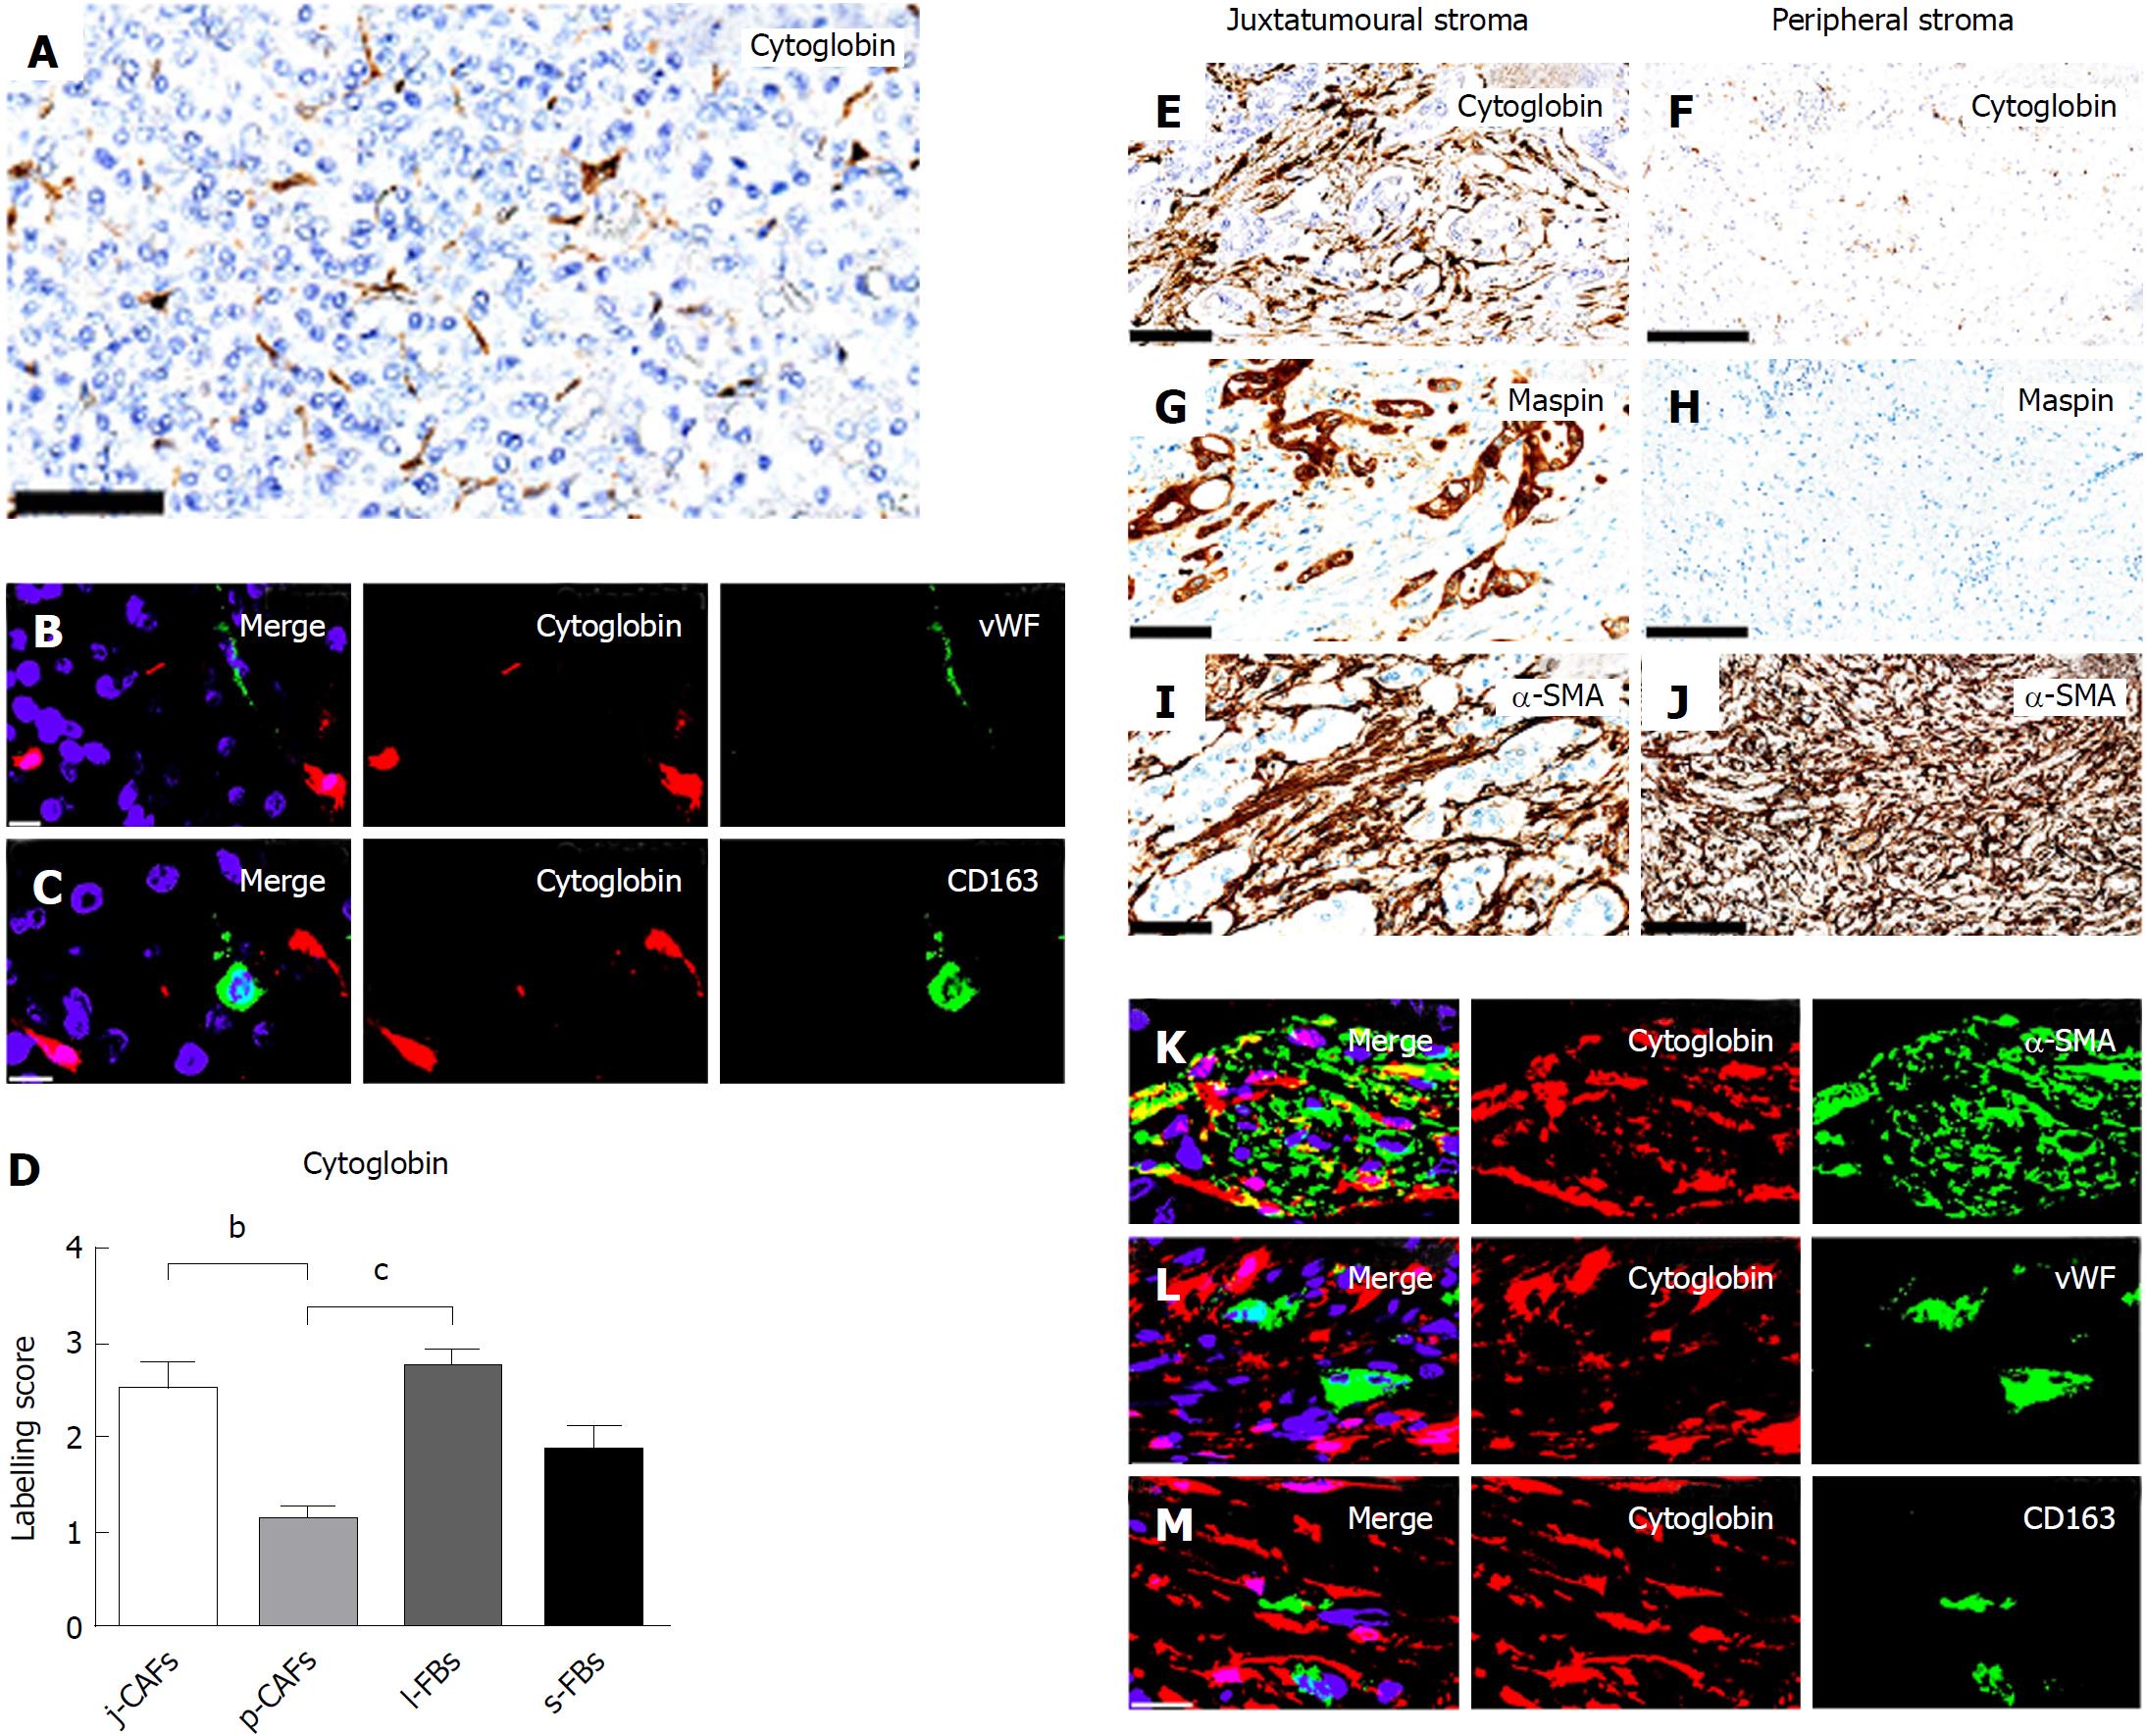
Figure 2 Cytoglobin expression in the normal pancreas and in pancreatic cancer.
In the normal pancreas, cytoglobin expression was observed. A: In periacinar quiescent pancreatic stellate cells (cytoglobin immunostaining; scale bars, 50 μm). No co-expression of cytoglobin with; B: The endothelial marker von Willebrand factor (vWf) [double-immunofluorescence (d-IF) of vWF (green) and cytoglobin (red); scale bar, 10 μm]; C: With the histiocyte marker CD163 [d-IF of CD163 (green) and cytoglobin (red); scale bar 10 μm] was observed in the normal pancreas; D: Semi-quantitative mean labelling scores of cytoglobin expression in juxtatumoural cancer-associated fibroblasts (j-CAFs) = 2.5, peripheral cancer-associated fibroblasts (p-CAFs) = 1.1, lobular fibroblasts (l-FBs) = 2.8, and septal fibroblasts = 1.9. Cytoglobin was expressed at significantly higher levels in j-CAFs than in p-CAFs and in l-FBs than in p-CAFs. bP < 0.01, cP < 0.001; E: Moderate cytoglobin expression in j-CAFs (scale bar, 100 μm); F: In p-CAFs, only barely perceptible cytoglobin expression was observed (scale bar, 250 μm); G: Strong maspin expression in cancer cells surrounded by juxtatumoural stroma (scale bar, 100 μm); H: Peripheral stroma is shown, lacking maspin-positive cancer cells (scale bar, 250 μm). Strong α-smooth muscle actin (α-SMA) expression in I: j-CAFs (scale bar, 100 μm); and J: p-CAFs (scale bar, 250 μm); K: Co-expression of cytoglobin and α-SMA in j-CAFs [d-IF of α-SMA (green) and cytoglobin (red); scale bar, 10 μm]; L: No co-expression of cytoglobin with the endothelial marker vWf in PC [d-IF of vWf (green) and cytoglobin (red); scale bar, 20 μm]; M: No co-expression of cytoglobin with the histiocyte marker CD163 in PC [d-IF of CD163 (green) and cytoglobin (red); scale bar, 20 μm]. j-CAFs: Juxtatumoural cancer-associated fibroblasts; p-CAFs: Peripheral cancer-associated fibroblasts; l-FBs: Lobular fibroblasts; s-FBs: Septal fibroblasts.
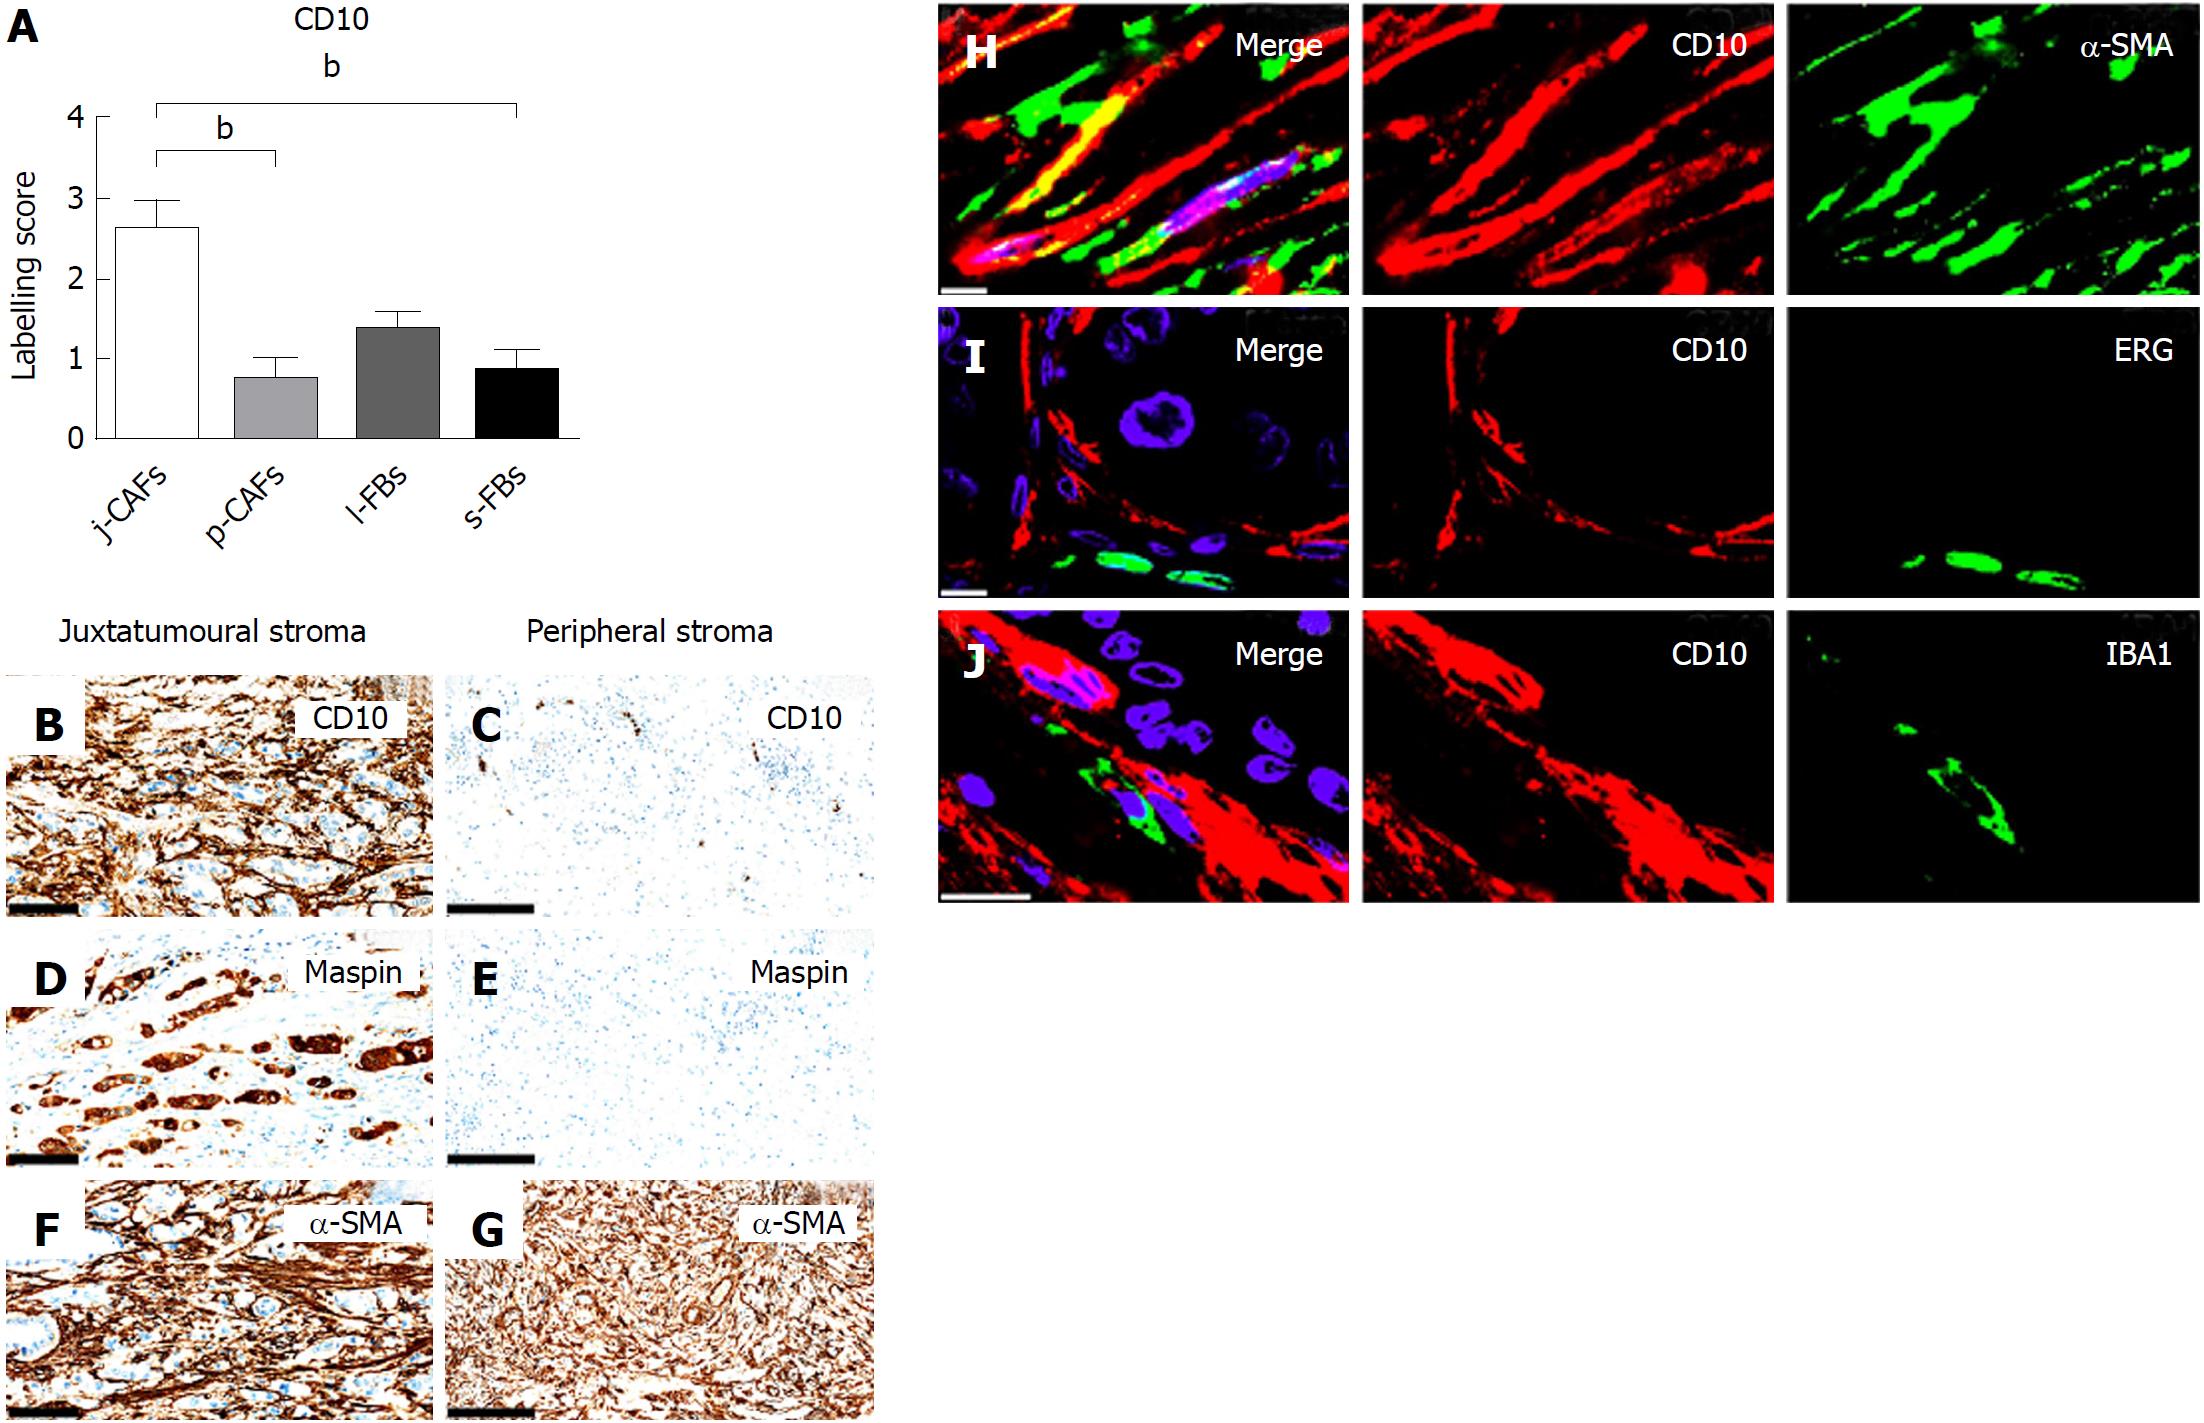
Figure 3 CD10 expression in pancreatic cancer.
A: Semi-quantitative mean labelling scores of CD10 in juxtatumoural cancer-associated fibroblasts (j-CAFs) = 2.6, peripheral cancer-associated fibroblasts (p-CAFs) = 0.8, lobular fibroblasts = 1.4, and septal fibroblasts (s-FBs) = 0.9. CD10 is expressed at significantly higher levels in j-CAFs than in p-CAFs and s-FBs. bP < 0.01; B: Moderate CD10 expression in j-CAFs (scale bar, 100 μm); C: In p-CAFs, CD10 expression is only barely perceptible (scale bar, 250 μm). Maspin-positive cancer cells are; D: present in juxtatumoural stroma (scale bar, 100 μm) but; E: not in peripheral stroma (scale bar, 250 μm). Strong α-smooth muscle actin (α-SMA) expression in F: j-CAFs (scale bar, 100 μm); and G: p-CAFs (scale bar, 250 μm); H: Co-expression of CD10 and α-SMA in j-CAFs is shown [double-immunofluorescence (d-IF) of α-SMA (green) and CD10 (red); scale bar, 10 μm]. No co-expression of CD10 with; I: the endothelial marker ETS-related gene (ERG) [d-IF of ERG (green) and CD10 (red); scale bar, 10 μm]; or J: with the histiocyte marker IBA1 [d-IF of IBA1 (green) and CD10 (red); scale bar, 20 μm]. j-CAFs: Juxtatumoural cancer-associated fibroblasts; p-CAFs: Peripheral cancer-associated fibroblasts; l-FBs: Lobular fibroblasts; s-FBs: Septal fibroblasts.
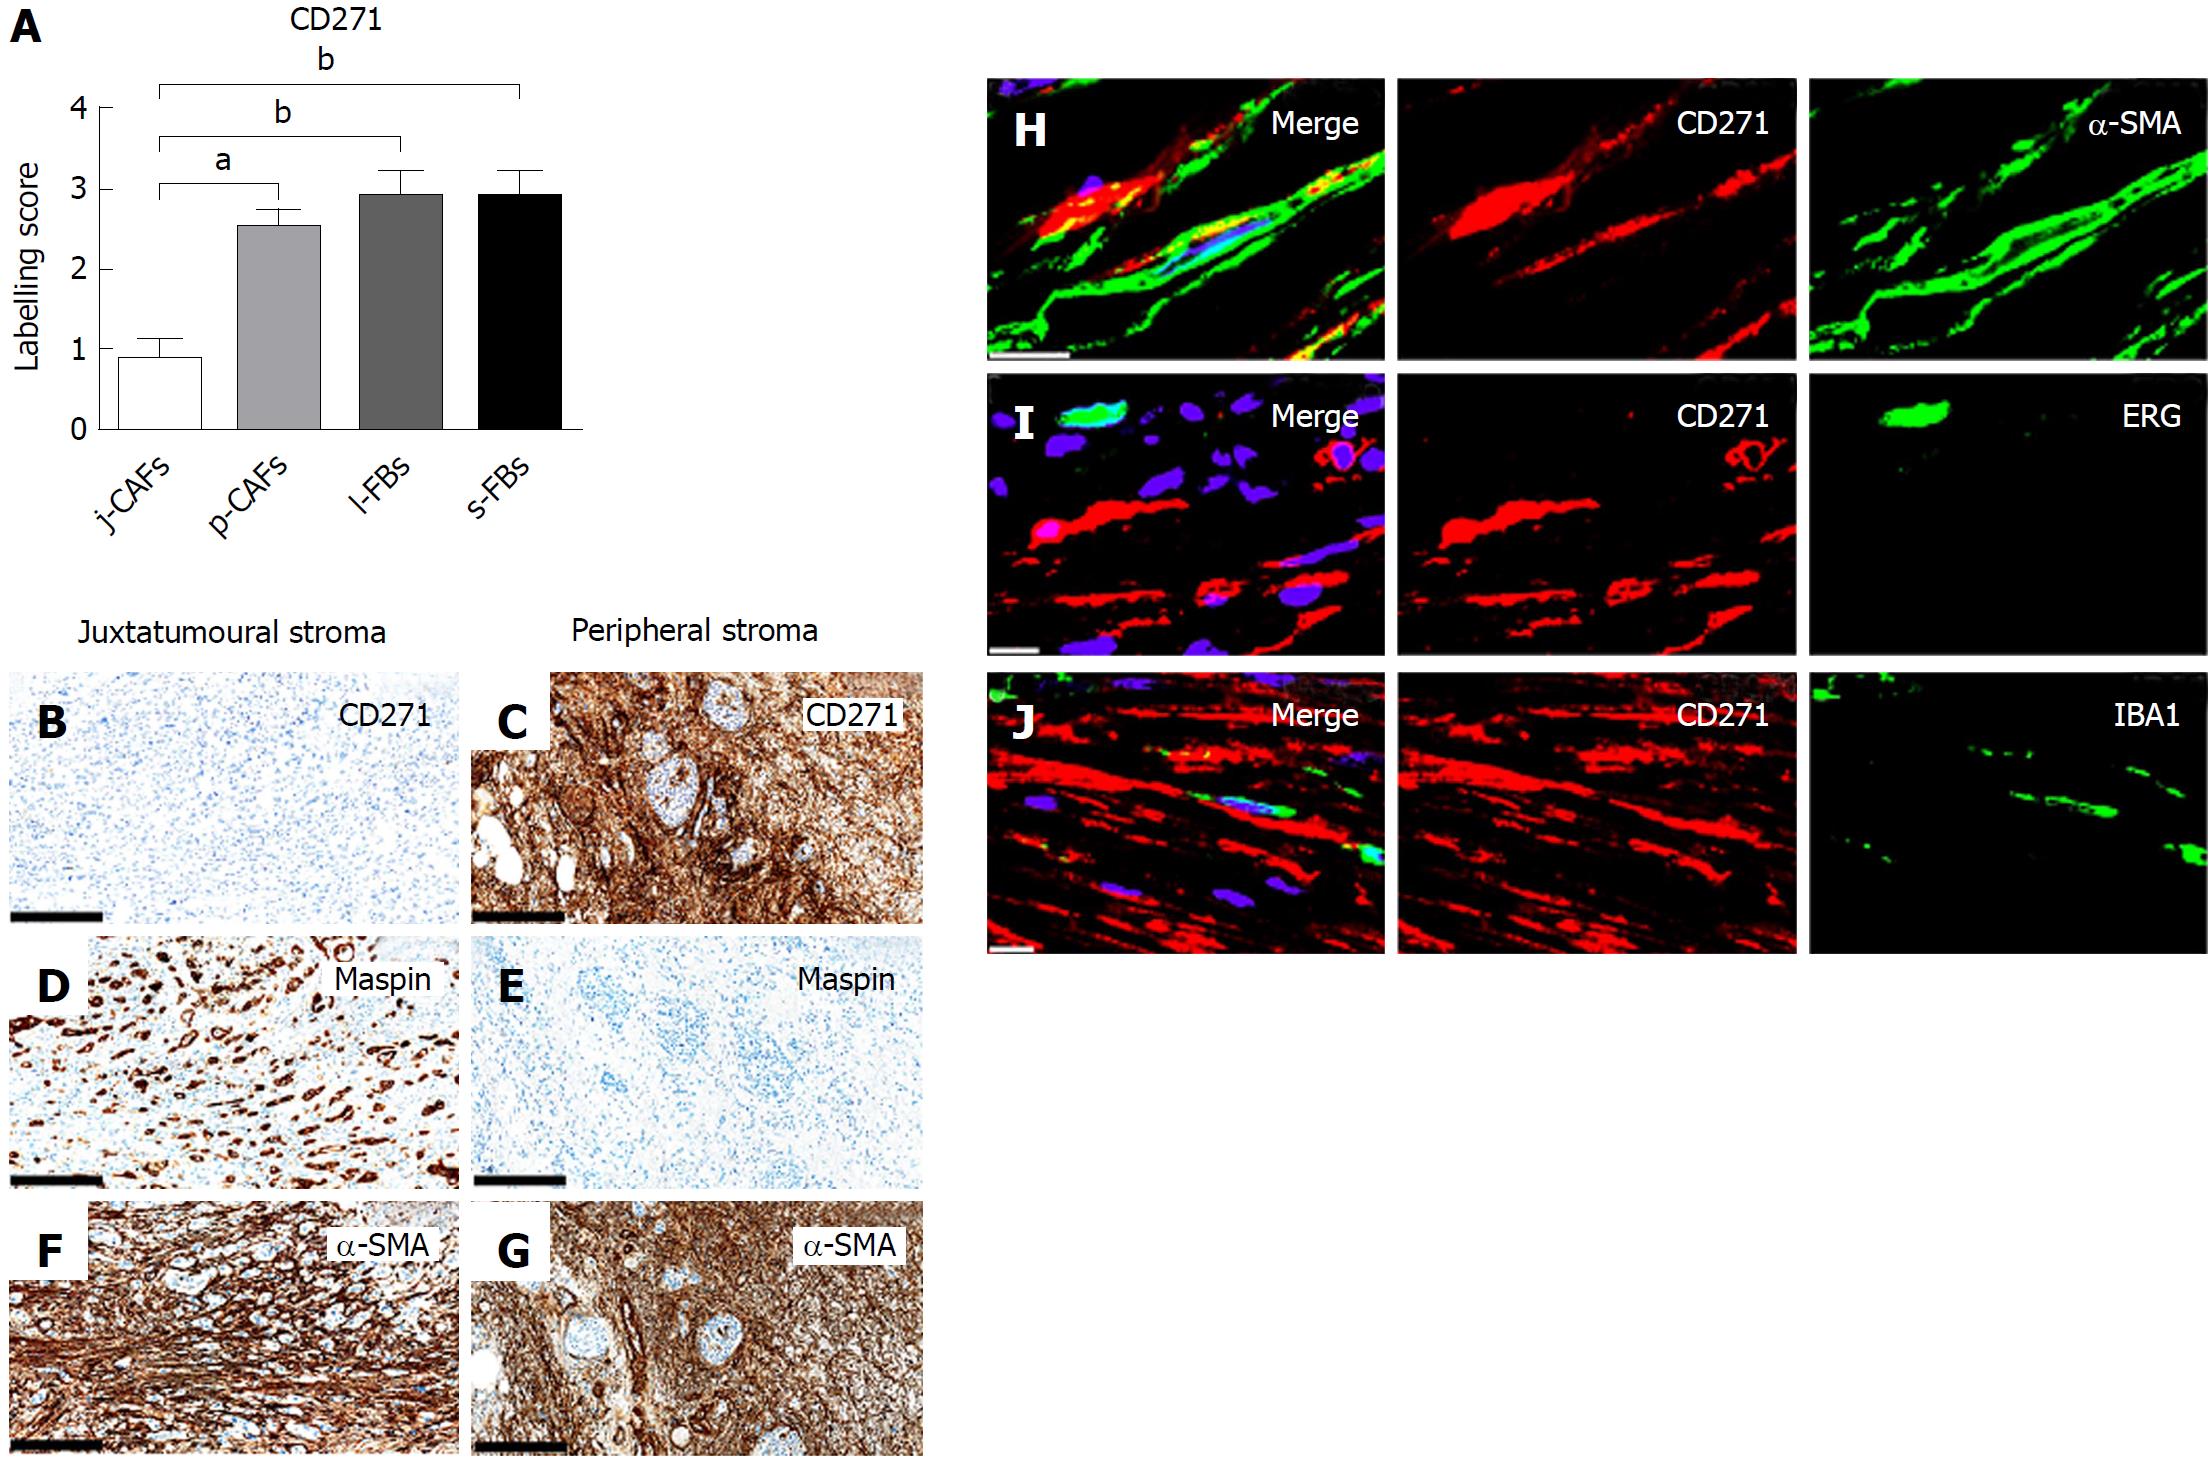
Figure 4 CD271 expression in pancreatic cancer.
A: Semi-quantitative mean labelling scores of CD271 in juxtatumoural cancer-associated fibroblasts (j-CAFs) = 0.9, peripheral cancer-associated fibroblasts (p-CAFs) = 2.5, lobular fibroblasts (l-FBs) = 2.9, and septal fibroblasts (s-FBs) = 2.9. CD271 is expressed at significantly higher levels in p-CAFs, l-FBs and s-FBs than in j-CAFs. aP < 0.05, bP < 0.01; B: Barely perceptible CD271 expression in spindle-shaped cells in the juxtatumoural stroma; C: In the peripheral stroma, moderate CD271 expression in p-CAFs. Maspin-positive cancer cells are D: present in the juxtatumoural stroma; but E: not in the peripheral stroma. Strong α-smooth muscle actin (α-SMA) expression in F: j-CAFs and G: p-CAFs (scale bars, 250 μm); H: p-CAFs co-express CD271 and α-SMA [double-immunofluorescence (d-IF) of α-SMA (green) and CD271 (red); scale bar 10 μm]; I: No co-expression of CD271 with the endothelial marker ETS-related gene (ERG) [d-IF of ERG (green) and CD271 (red); scale bar, 10 μm]; J: No co-expression of CD10 with IBA1 in histiocytic cells [d-IF of IBA1 (green) and CD10 (red); scale bar, 20 μm]; j-CAFs: Juxtatumoural cancer-associated fibroblasts; p-CAFs: Peripheral cancer-associated fibroblasts; l-FBs: Lobular fibroblasts; s-FBs: Septal fibroblasts.
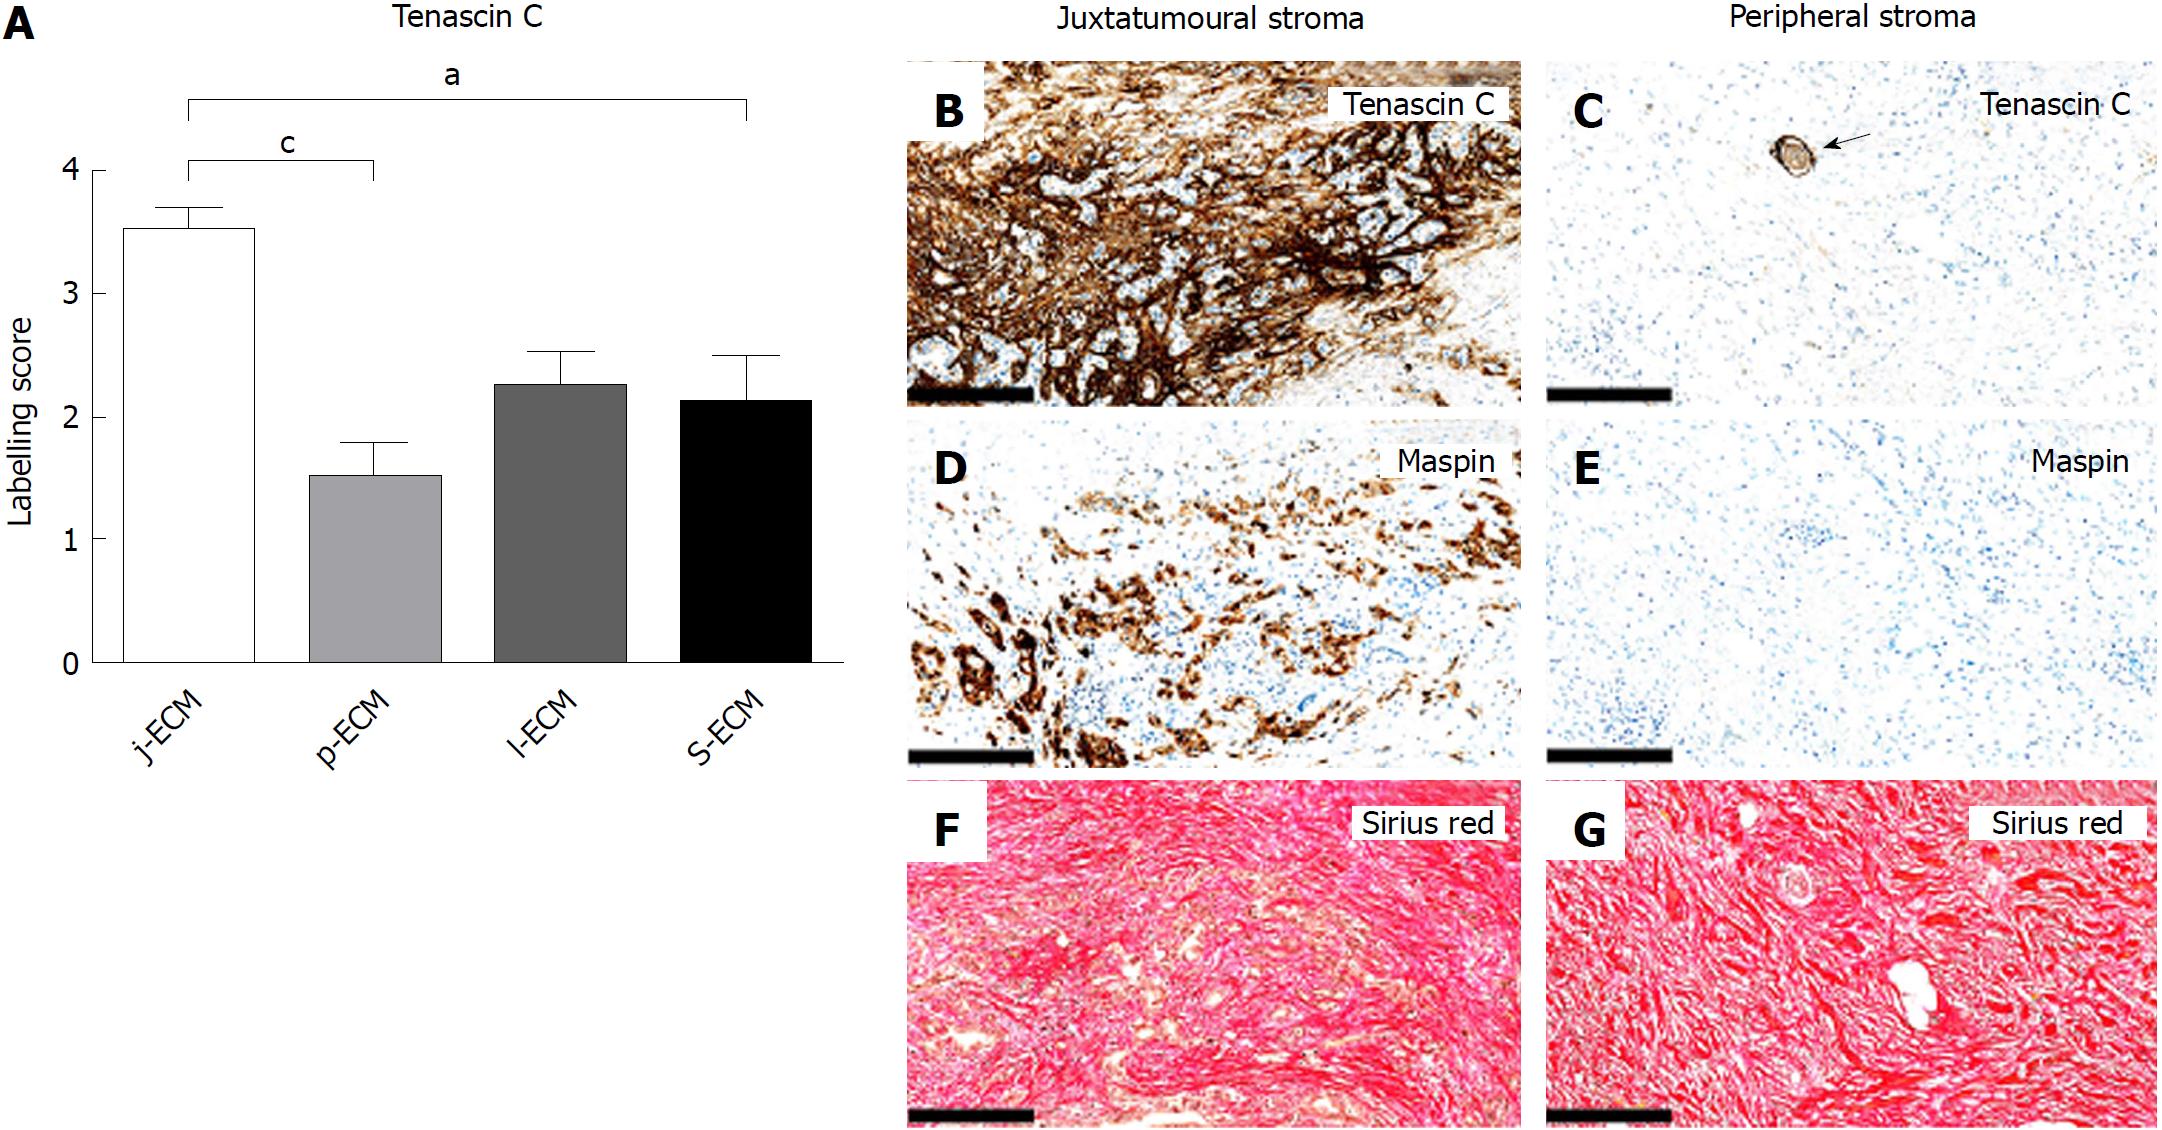
Figure 5 Tenascin C expression in pancreatic cancer.
A: Semi-quantitative mean labelling scores of tenascin C in juxtatumoural extracellular matrix (j-ECM) = 3.5, peripheral extracellular matrix (p-ECM) = 1.5, lobular extracellular matrix = 2.3, and septal extracellular matrix (s-ECM) = 2.1. Tenascin C is expressed at significantly higher levels in j-ECM than in p-ECM and s-ECM. aP < 0.05, cP < 0.001; B: Strong tenascin C expression in the ECM of the juxtatumoural stroma; C: In the peripheral stroma, weak tenascin C expression was observed in the ECM. Tenascin C was abundantly expressed around nerves (arrow). Maspin-positive cancer cells are D: present in the juxtatumoural stroma but; E: not in the peripheral stroma. Strong Sirius Red staining in F: j-ECM and G: p-ECM (scale bars, 250 μm). j-ECM: Juxtatumoural extracellular matrix; p-ECM: Peripheral extracellular matrix; l-ECM: Lobular extracellular matrix; s-ECM: Septal extracellular matrix.
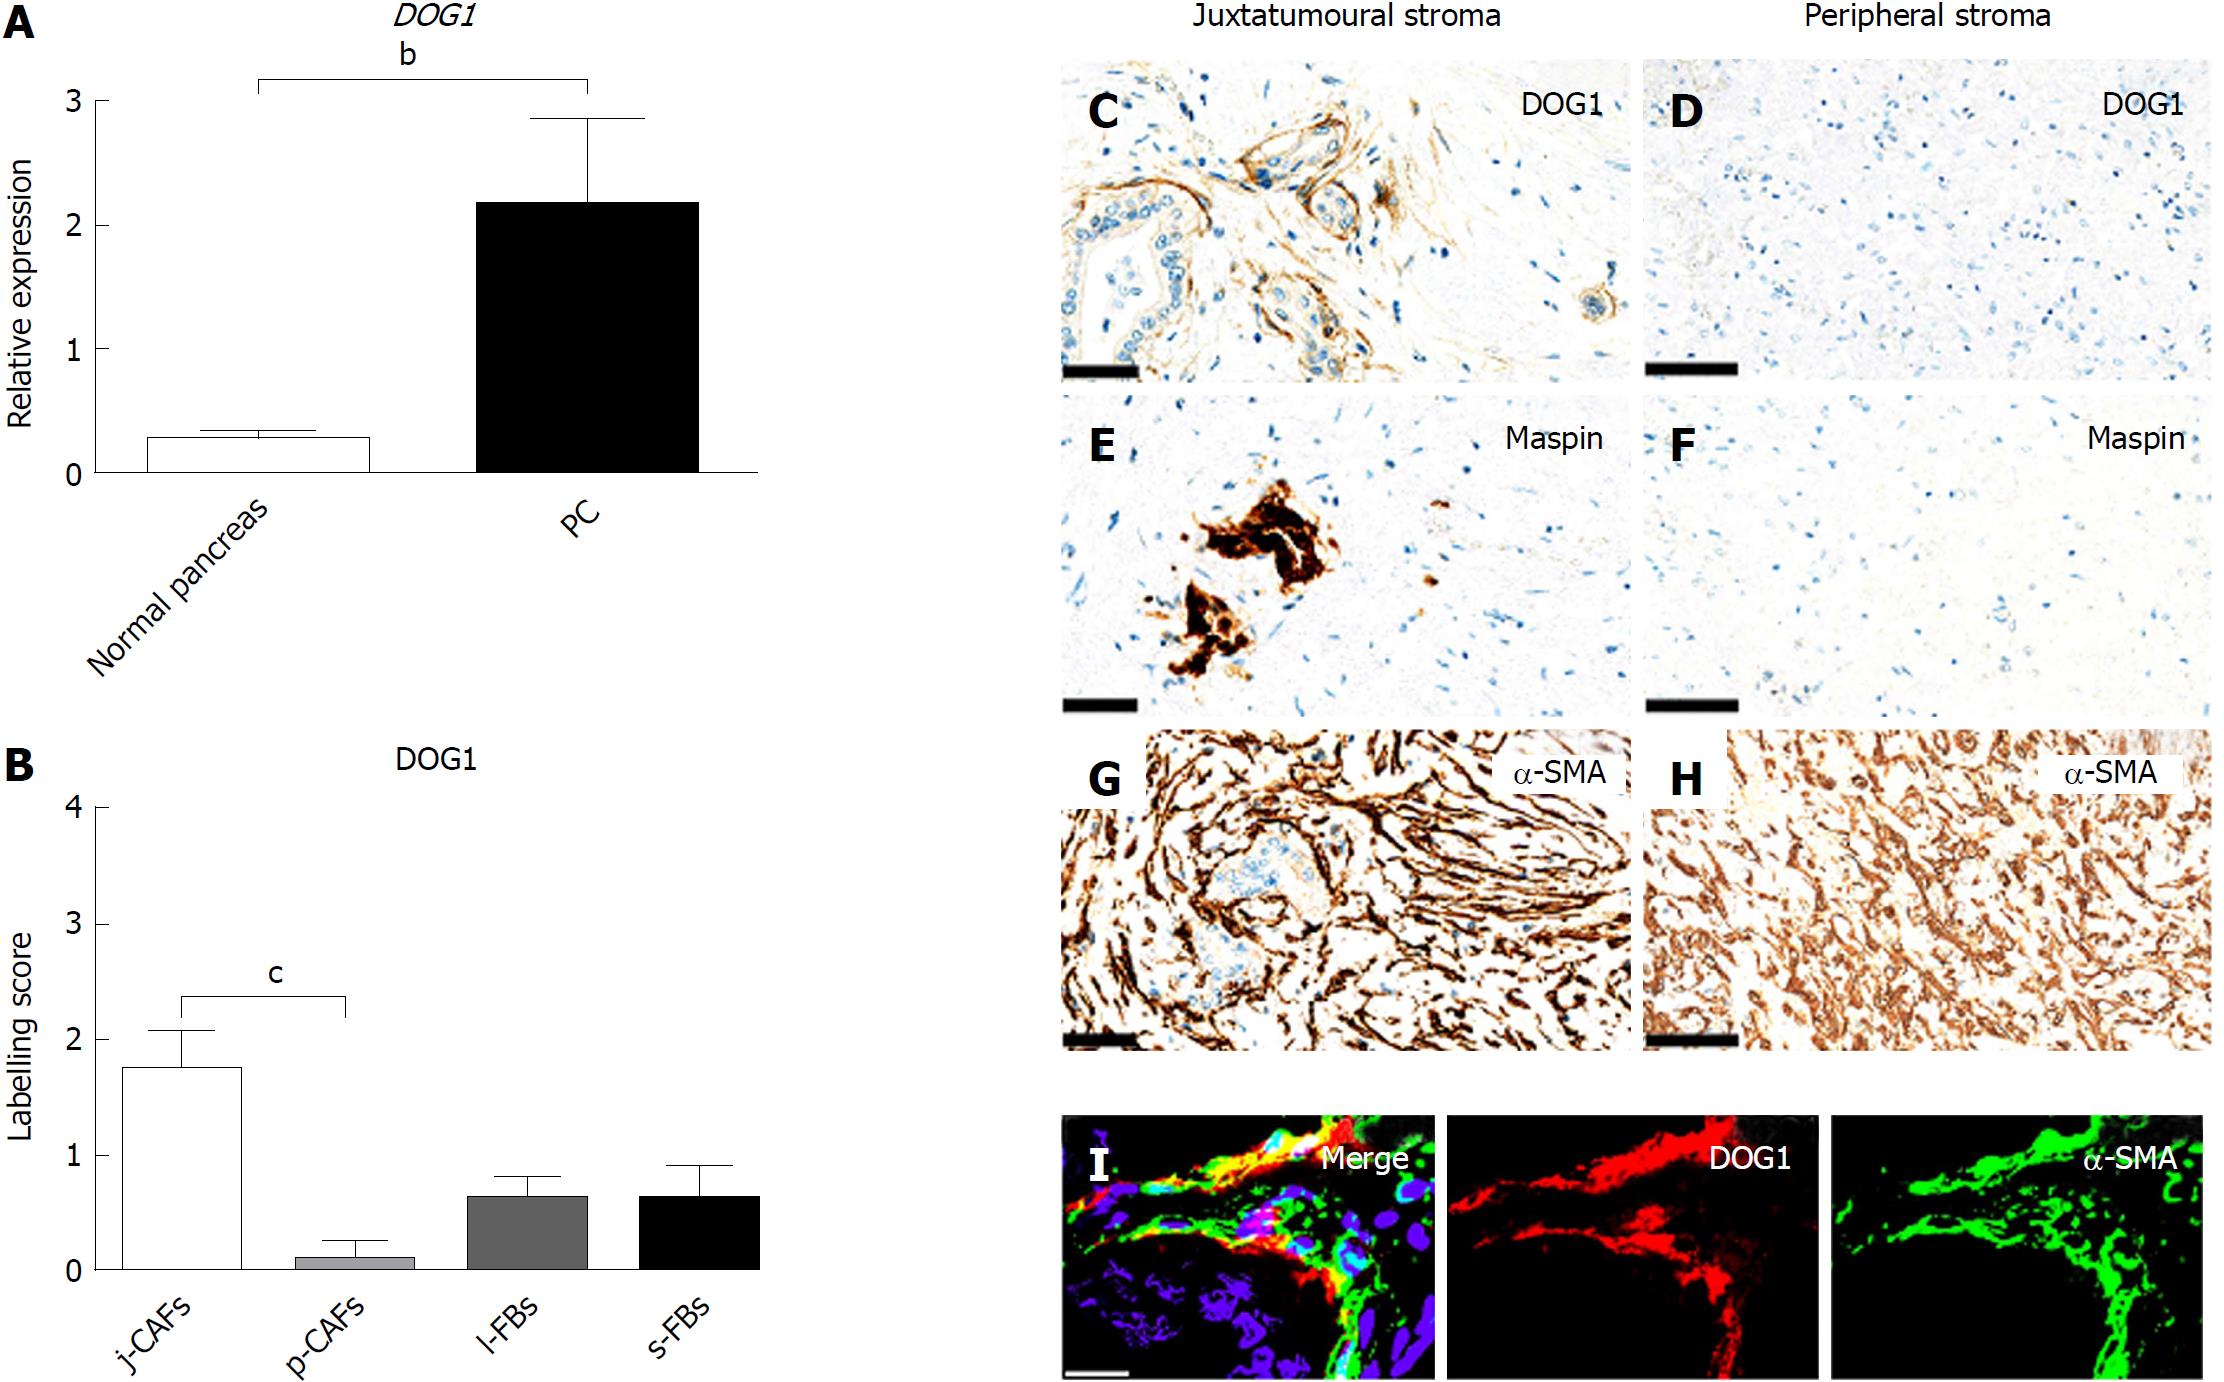
Figure 6 DOG1 gene and DOG1 protein expression in pancreatic cancer.
A: Expression of the DOG1 gene was significantly upregulated in pancreatic cancer compared to normal pancreatic specimens. bP < 0.01; B: Semi-quantitative mean labelling scores of DOG1 in juxtatumoural cancer-associated fibroblasts (j-CAFs) = 1.8, peripheral cancer-associated fibroblasts (p-CAFs) = 0.1, lobular fibroblasts = 0.6, and septal fibroblasts = 0.6. DOG1 is expressed at significantly higher levels in j-CAFs than in p-CAFs. cP < 0.001; C: Weak DOG1 expression in spindle-shaped cells in the juxtatumoural stroma. Some adenocarcinoma cells also expressed DOG1 (scale bar, 50 μm); D: No DOG1 expression was observed in the peripheral stroma (scale bar 100μm). Maspin-positive cancer cells are E: present in the juxtatumoural stroma (scale bar, 50 μm); but F: not in the peripheral stroma (scale bar, 100 μm). Strong α-smooth muscle actin (α-SMA) expression in G: j-CAFs (scale bar, 50 μm); and H: p-CAFs (scale bar, 100 μm); I: j-CAFs co-express DOG1 and α-SMA [double-immunofluorescence of α-SMA (green) and DOG1 (red); scale bar, 20 μm]. j-CAFs: Juxtatumoural cancer-associated fibroblasts; p-CAFs: Peripheral cancer-associated fibroblasts; l-FBs: Lobular fibroblasts; s-FBs: Septal fibroblasts; PC: Pancreatic cancer.
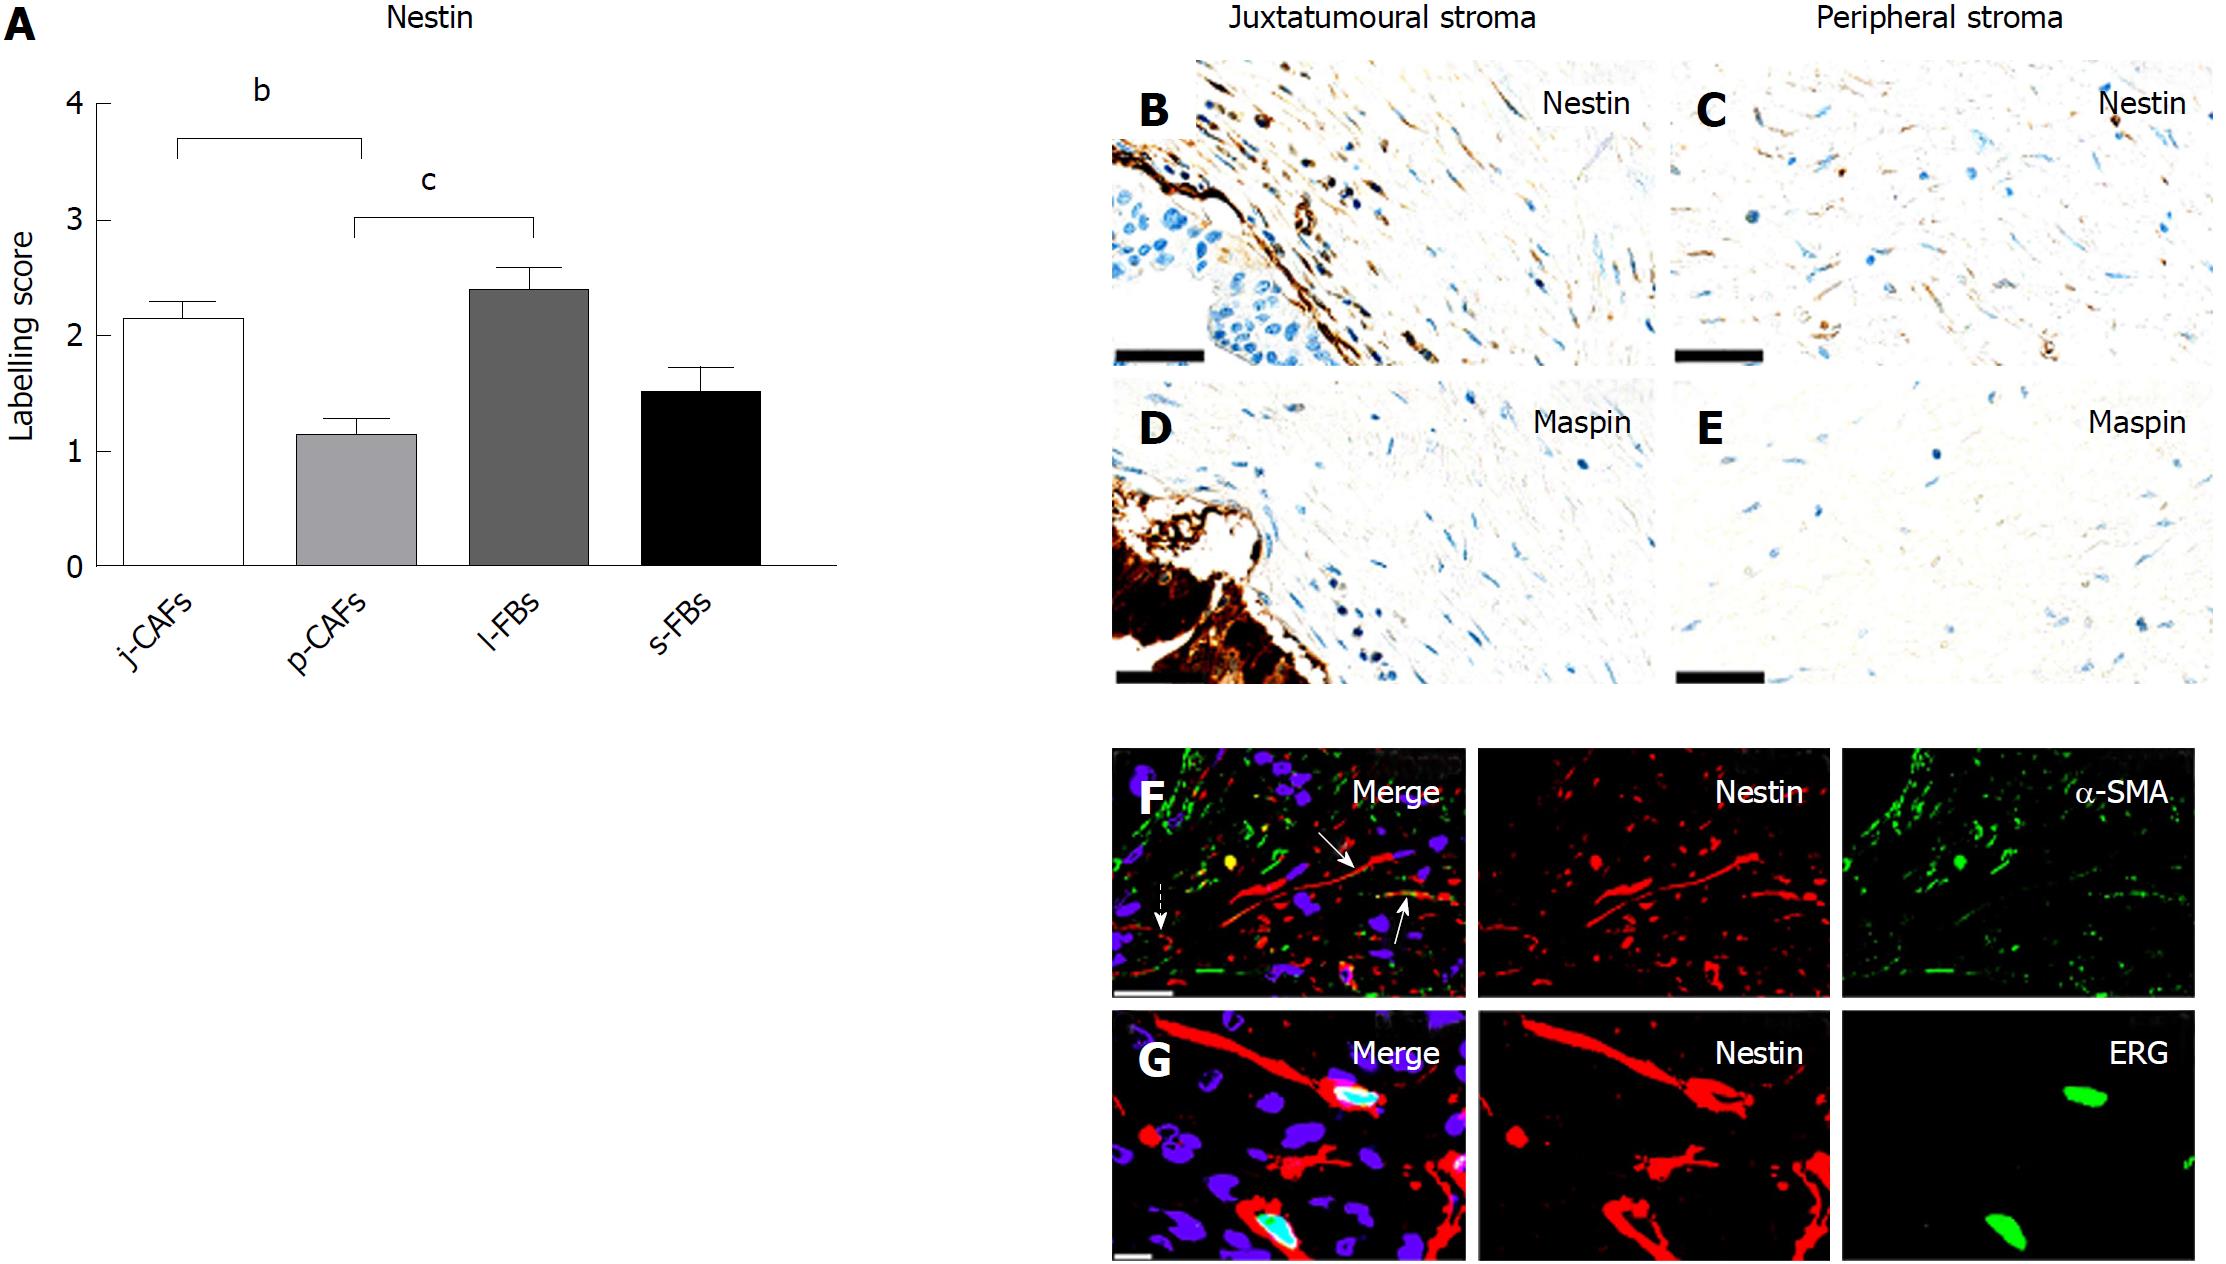
Figure 7 Nestin expression in pancreatic cancer.
A: Semi-quantitative mean labelling scores of nestin in juxtatumoural cancer-associated fibroblasts (j-CAFs) = 2.1, peripheral cancer-associated fibroblasts (p-CAFs) = 1.1, lobular fibroblasts (l-FBs) = 2.4, and septal fibroblasts (s-FBs) = 1.5. Nestin is expressed at significantly higher levels in j-CAFs and l-FBs than in p-CAFs. bP < 0.01, cP < 0.001; B: Weak nestin expression in a small fraction of spindle-shaped cells in the juxtatumoural stroma; C: Barely perceptible nestin expression in the peripheral stroma. Maspin-positive cancer cells are D: present in the juxtatumoural stroma but; E: not in the peripheral stroma (scale bars, 50 μm); F: Some j-CAFs co-express nestin and α-smooth muscle actin (α-SMA) (closed arrows). Additional expression was observed in α-SMA-negative endothelia (dotted arrow) [double-immunofluorescence (d-IF) of α-SMA (green) and nestin (red); scale bar, 20 μm]; G: Nestin and ETS-related gene (ERG) are co-expressed in endothelial cells [d-IF of ERG (green) and nestin (red); scale bar, 10 μm]. j-CAFs: Juxtatumoural cancer-associated fibroblasts; p-CAFs: Peripheral cancer-associated fibroblasts; l-FBs: Lobular fibroblasts; s-FBs: Septal fibroblasts.
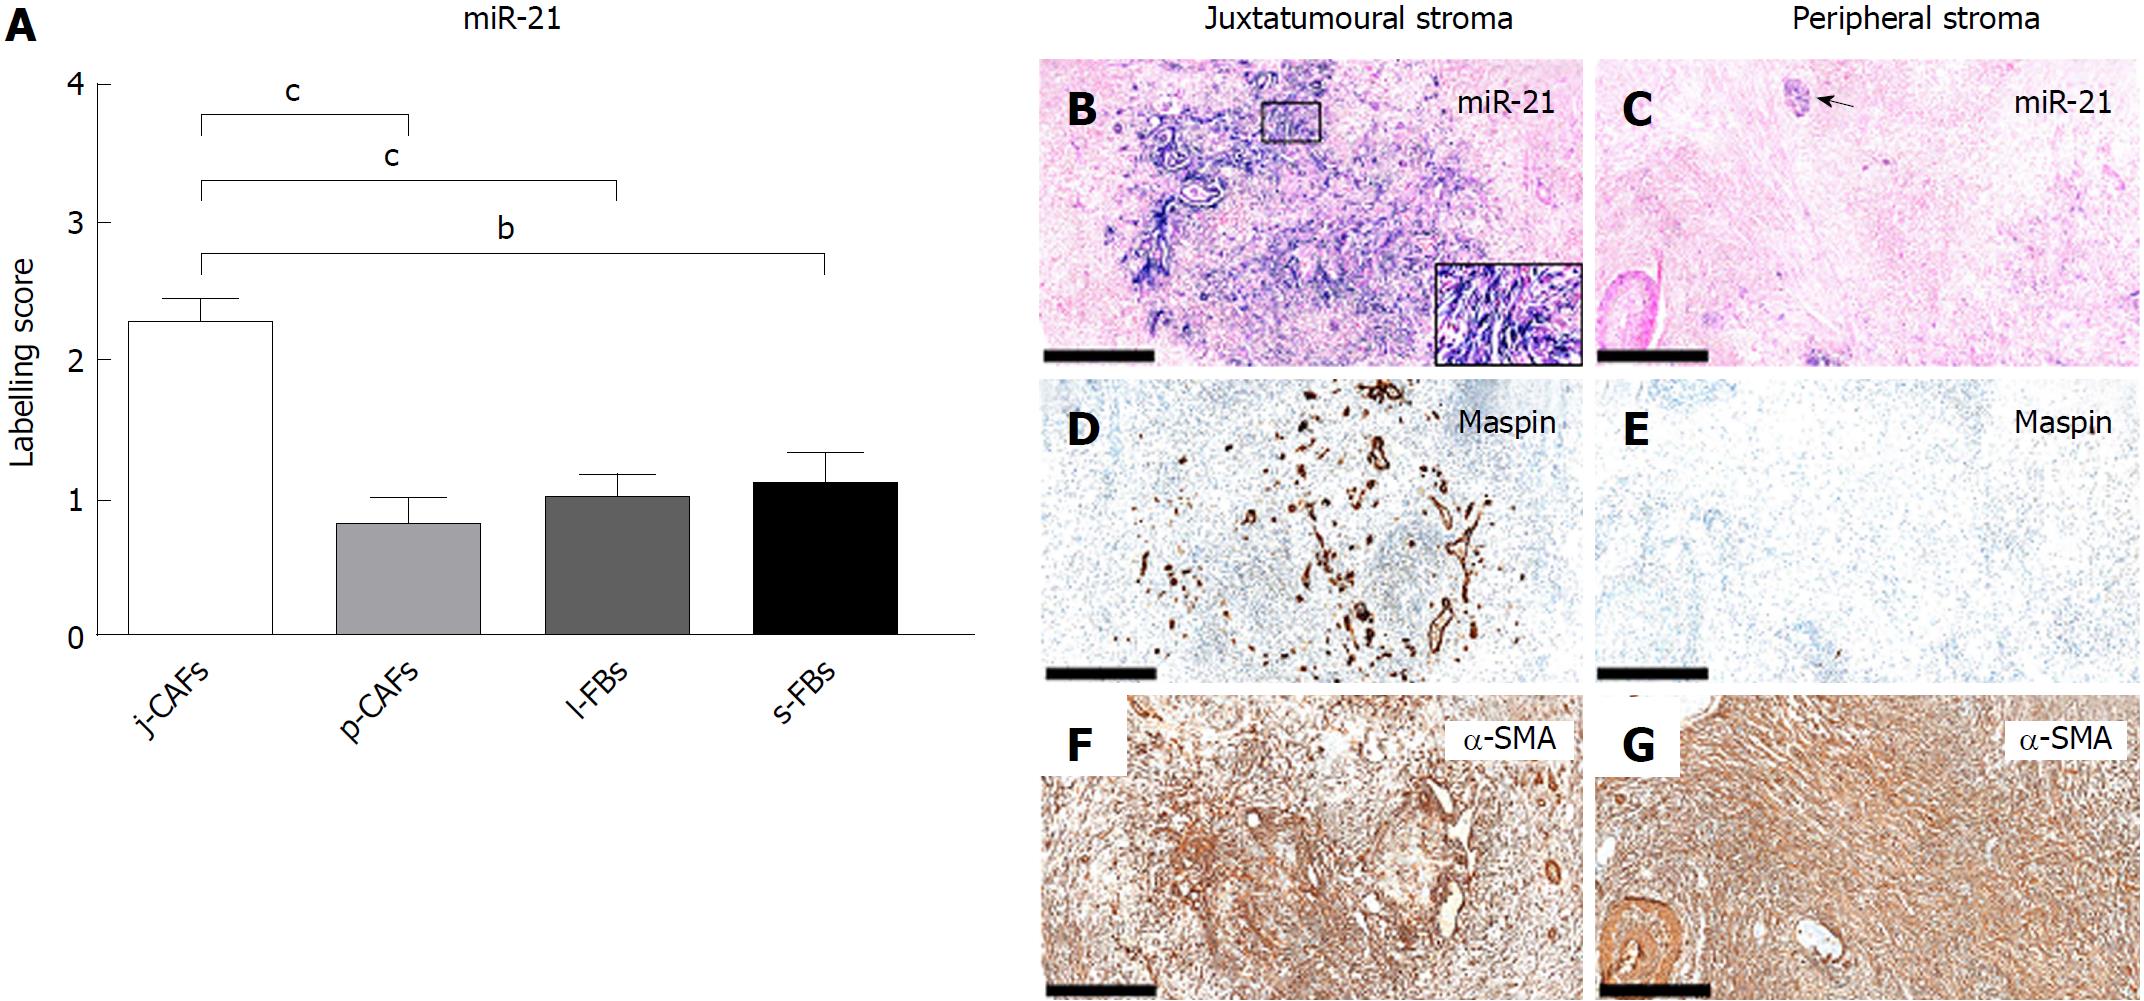
Figure 8 miR-21 expression in pancreatic cancer.
A: Semi-quantitative mean labelling scores of miR-21 in juxtatumoural cancer-associated fibroblasts (j-CAFs) = 2.2, peripheral cancer-associated fibroblasts (p-CAFs) = 0.8, lobular fibroblasts (l-FBs) = 1.0, and septal fibroblasts (s-FBs) = 1.1. miR-21 is expressed at significantly higher levels in j-CAFs than in p-CAFs, l-FBs and s-FBs. bP < 0.01, cP < 0.001; B: Moderate miR-21 expression in spindle-shaped cells in the juxtatumoural stroma (insert). Adenocarcinoma cells also expressed miR-21; C: Expression of miR-21 in the peripheral stroma was barely perceptible. Large nerves expressed miR-21 (arrow). Maspin-positive cancer cells are D: present in the juxtatumoural stroma; but E: not in the peripheral stroma. Strong α-smooth muscle actin expression in F: j-CAFs; and G: p-CAFs (scale bars, 500 μm). j-CAFs: Juxtatumoural cancer-associated fibroblasts; p-CAFs: Peripheral cancer-associated fibroblasts; l-FBs: Lobular fibroblasts; s-FBs: Septal fibroblasts.
- Citation: Nielsen MFB, Mortensen MB, Detlefsen S. Typing of pancreatic cancer-associated fibroblasts identifies different subpopulations. World J Gastroenterol 2018; 24(41): 4663-4678
- URL: https://www.wjgnet.com/1007-9327/full/v24/i41/4663.htm
- DOI: https://dx.doi.org/10.3748/wjg.v24.i41.4663


