Copyright
©The Author(s) 2018.
World J Gastroenterol. Oct 14, 2018; 24(38): 4341-4355
Published online Oct 14, 2018. doi: 10.3748/wjg.v24.i38.4341
Published online Oct 14, 2018. doi: 10.3748/wjg.v24.i38.4341
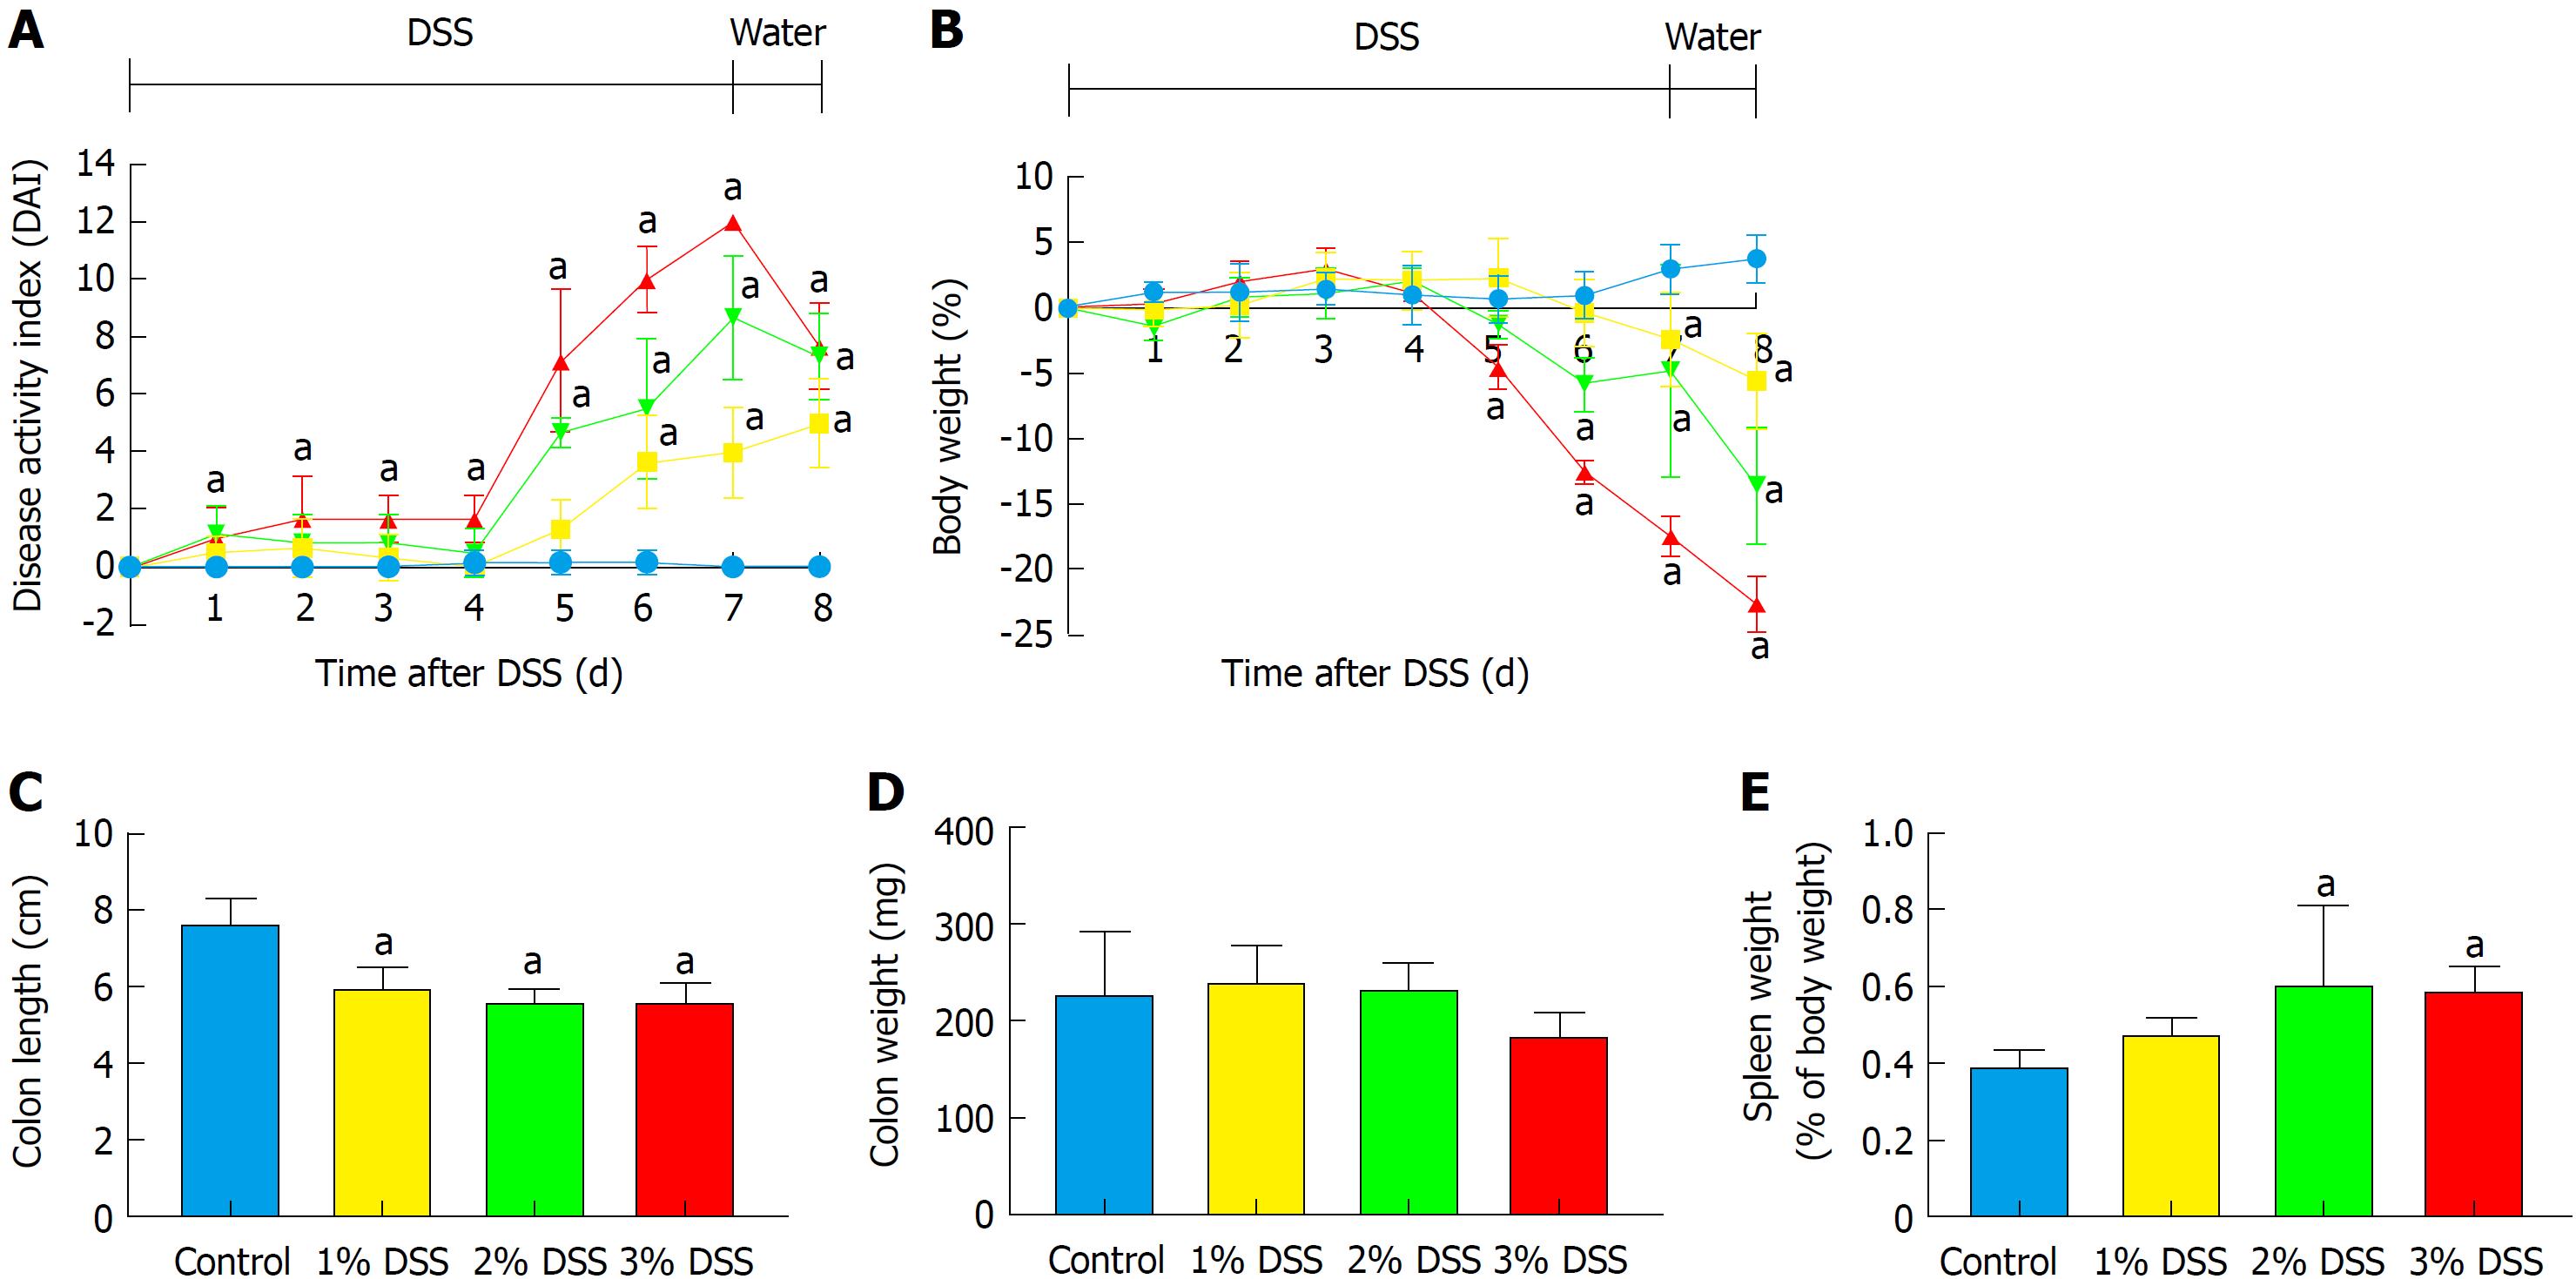
Figure 1 Comparison between 1%, 2% and 3% dextran sulfate sodium.
Experimental colitis was induced by the administration of DSS in drinking water for 7 d at three different concentrations. Were performed daily clinical evaluations for (A) disease activity index and (B) weight loss. At the end of 8 d, animals were euthanized and were collected measurements for (C) colon length, (D) colon weight and (E) spleen weight. Multiple student’s t test for clinical scores and one-way ANOVA followed by Dunnett post-hoc test for colon length, colon weight and spleen weight. aP < 0.05 vs control. n = 6/DSS group. DSS: Dextran sulfate sodium.
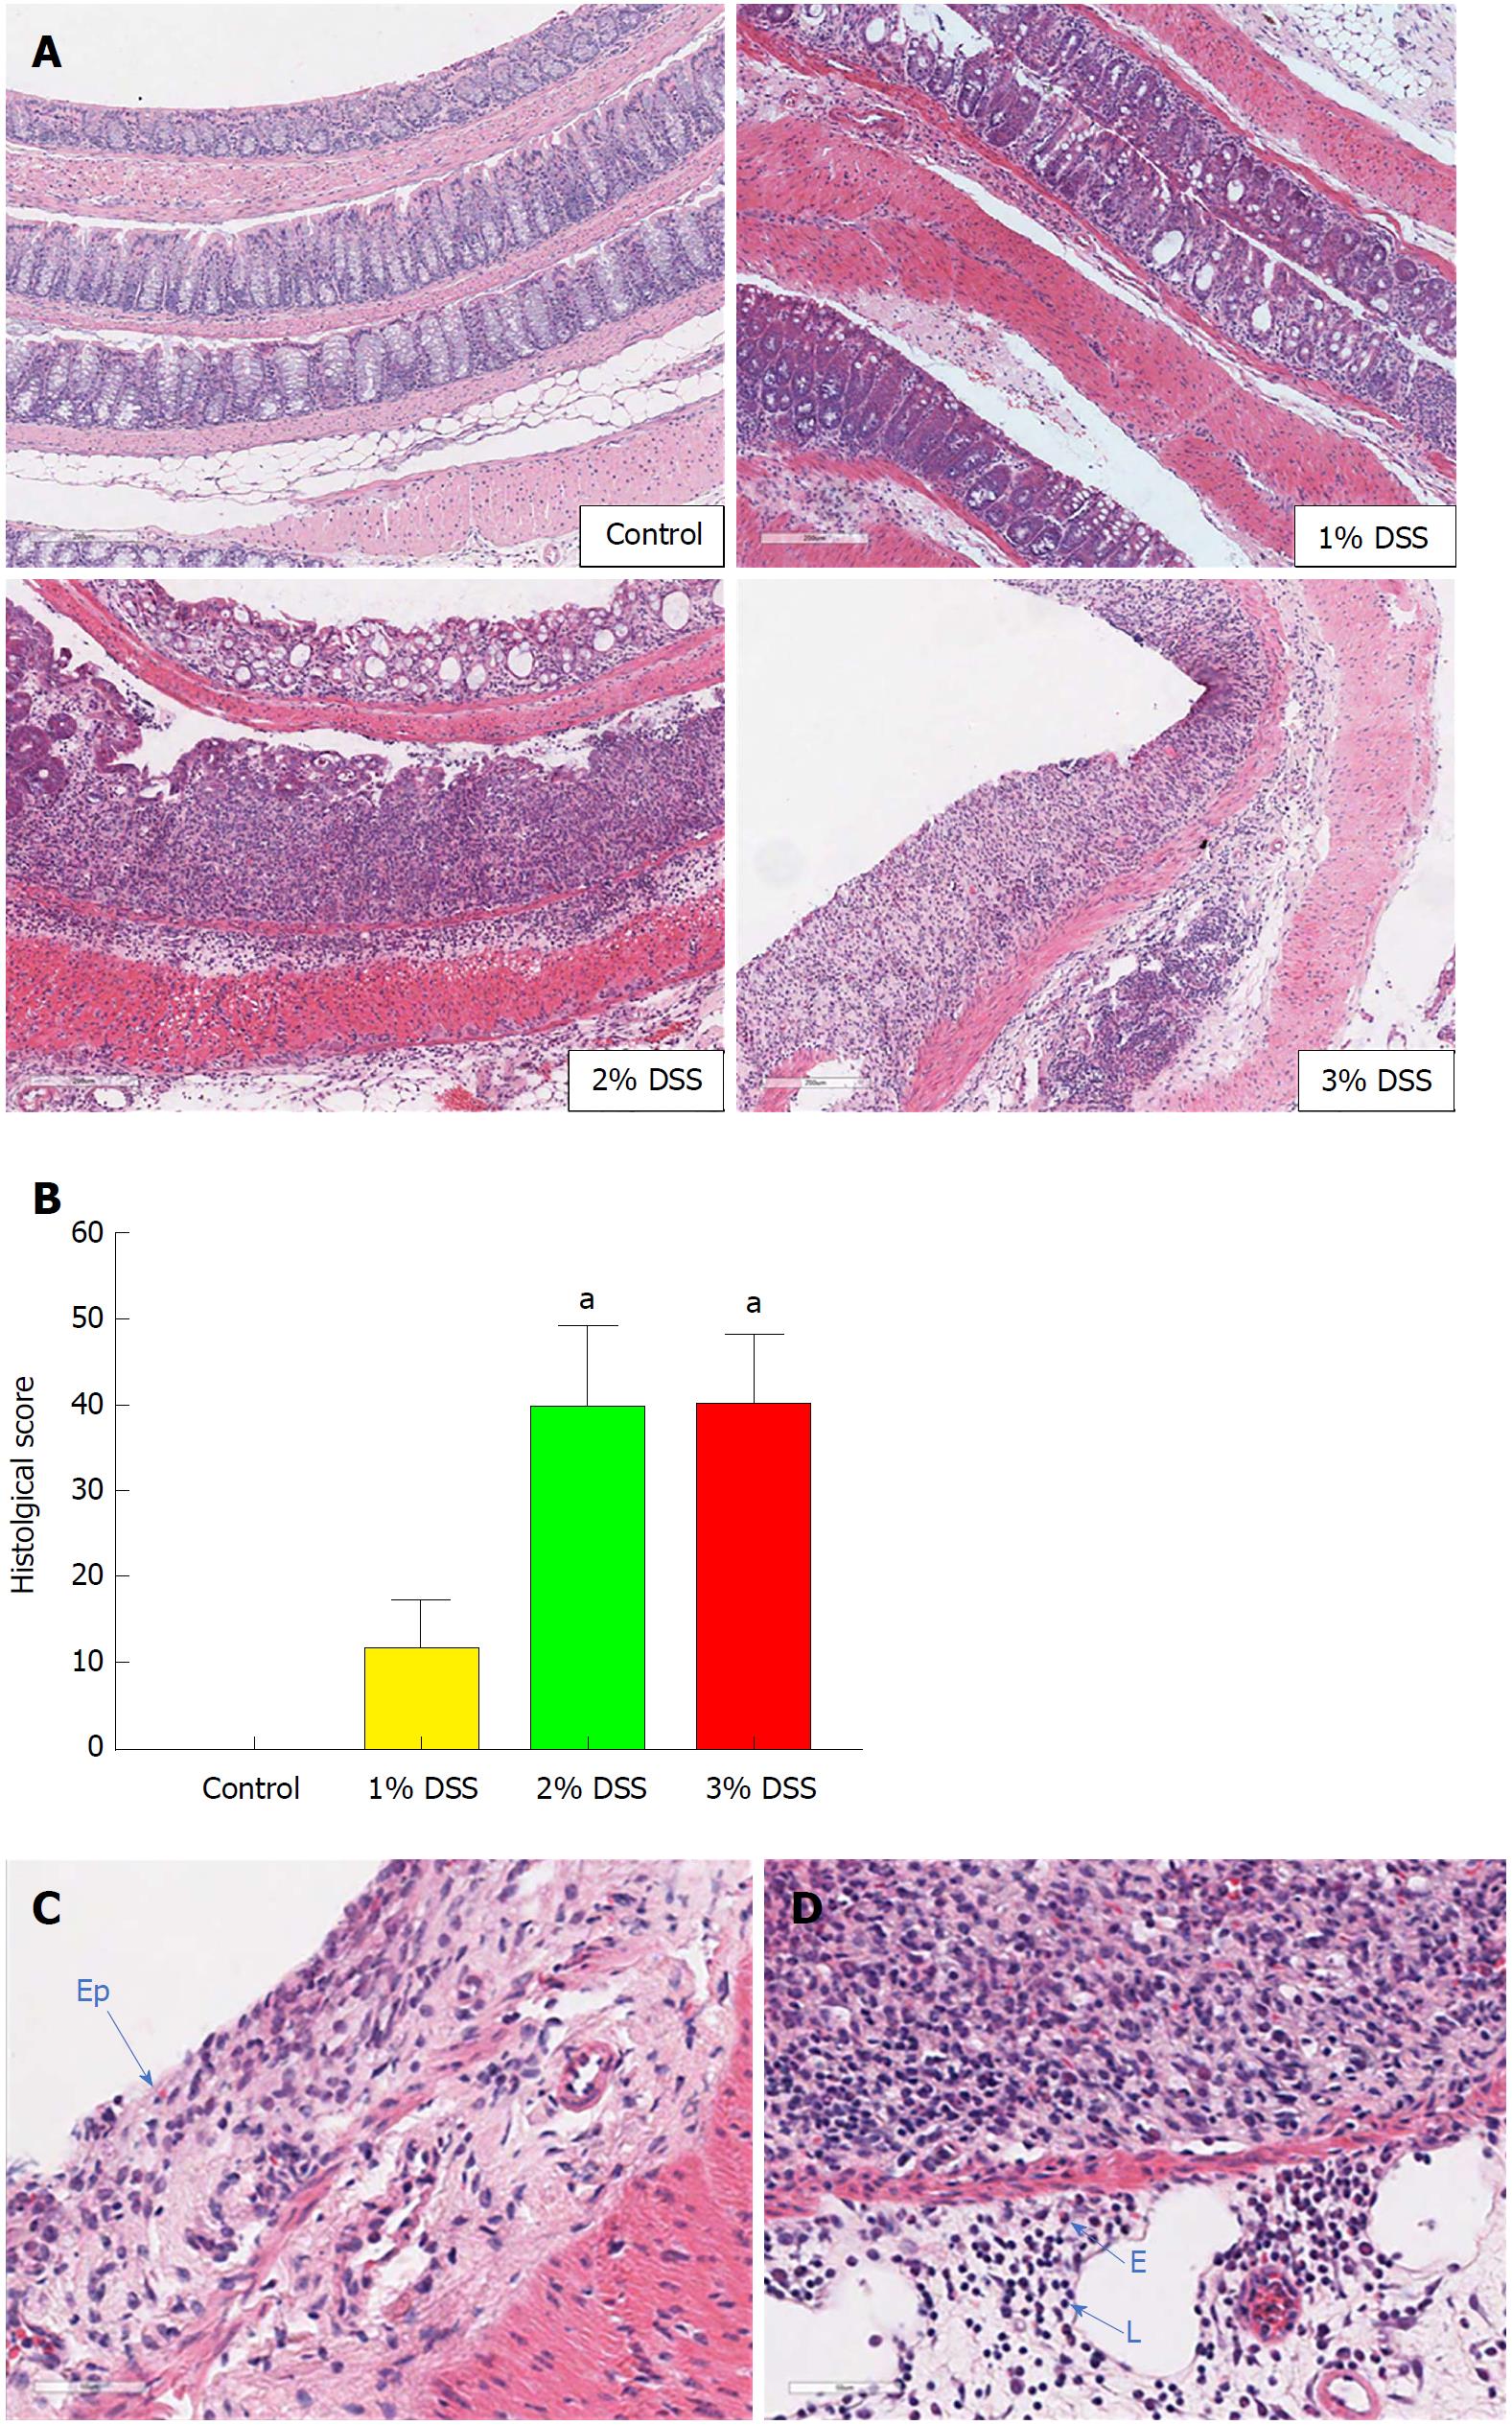
Figure 2 Histological comparisons between 1%, 2% and 3% dextran sulfate sodium.
At the end of 8 d, the difference between DSS concentration was visible in (A) colonic damage (crypt depletion, inflammation, loss of epithelial barrier) compared to control. (B) Histological scores were similar between 2% and 3% DSS, where at the end of 8 d it is possible to visualize (C) the loss of the Ep and (D) infiltration of eosinophils (E) and lymphocytes (L). One-way ANOVA followed by Dunnet post-hoc test. aP < 0.05 compared to control. n = 4/DSS group. DSS: Dextran sulfate sodium; Ep: Epithelial layer.
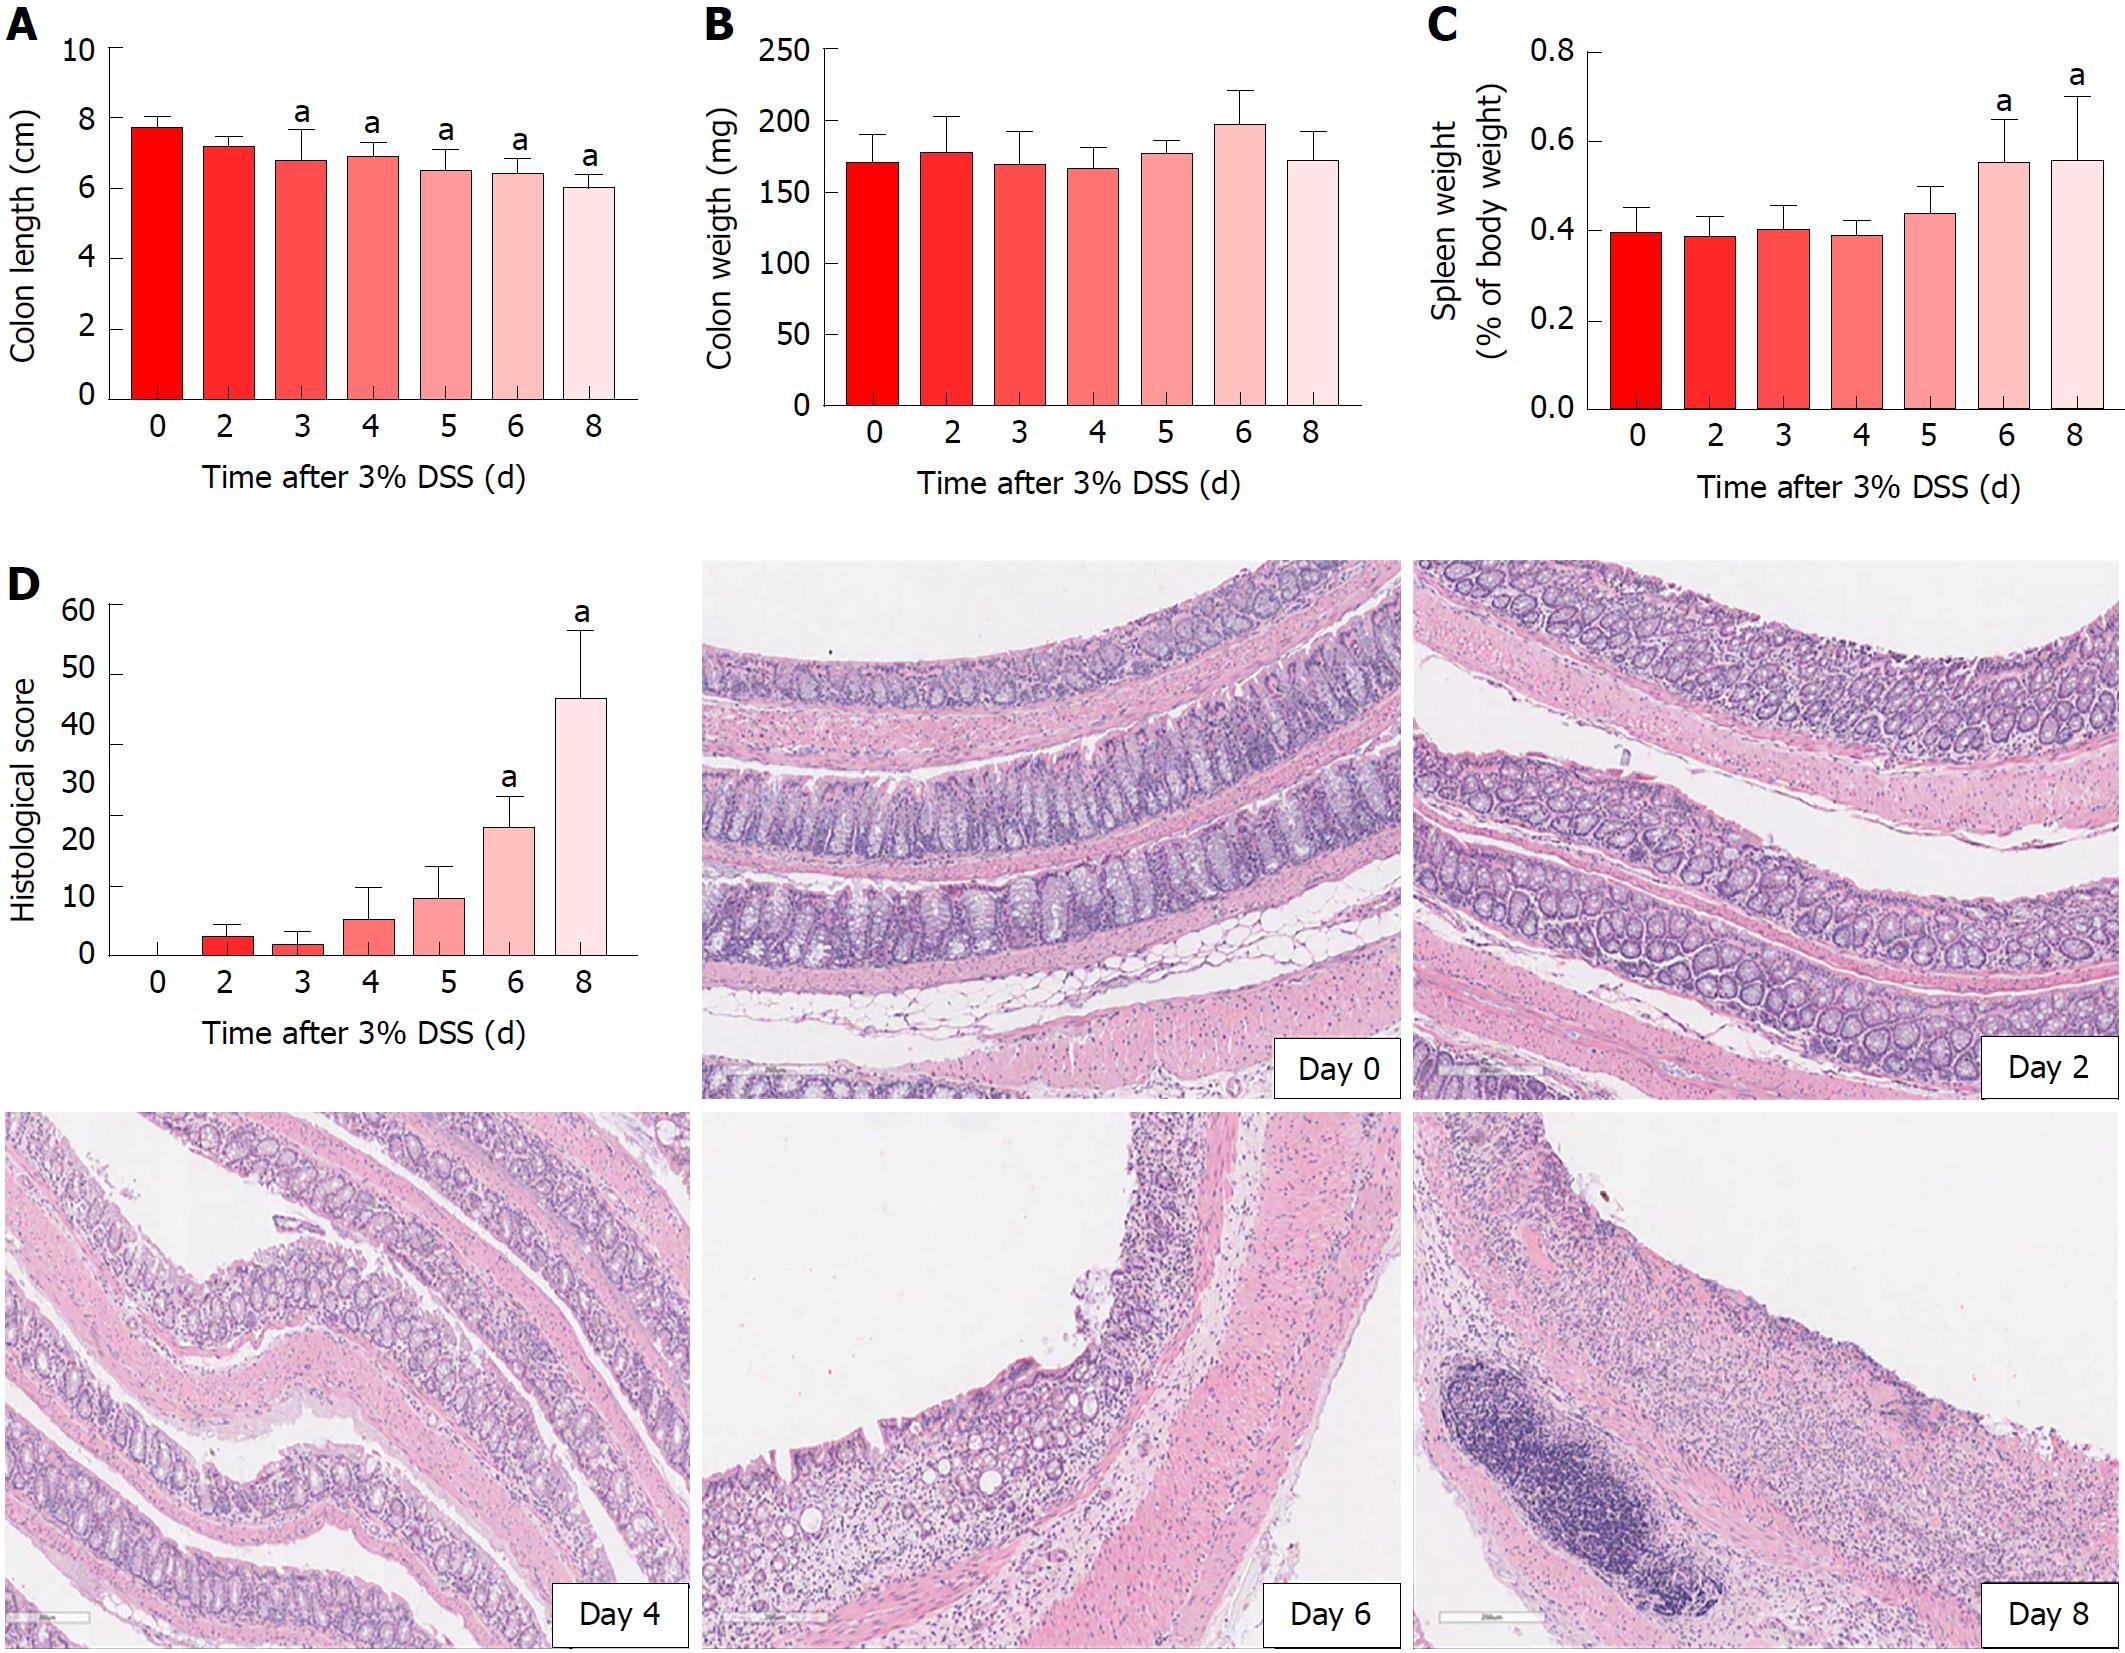
Figure 3 Colon and spleen in 3% dextran sulfate sodium time course.
Experimental colitis was induced by the administration of DSS 3% in drinking water for 7 d. Colon shortening started as early as day 3 (A), with no changes in colon weight (B). Spleen weight was increased on day 6 and day 8 (C), at the same time as histological scores were augmented, demonstrating crypt depletion, loss of goblet cells, loss of the epithelial layer and inflammatory cells’ infiltration (D). One-way ANOVA followed by Dunnett post-hoc test. aP < 0.05 compared to control (day 0). n = 4/each time point for histology and n = 6/each time point for colon and spleen measurements. DSS: Dextran sulfate sodium.
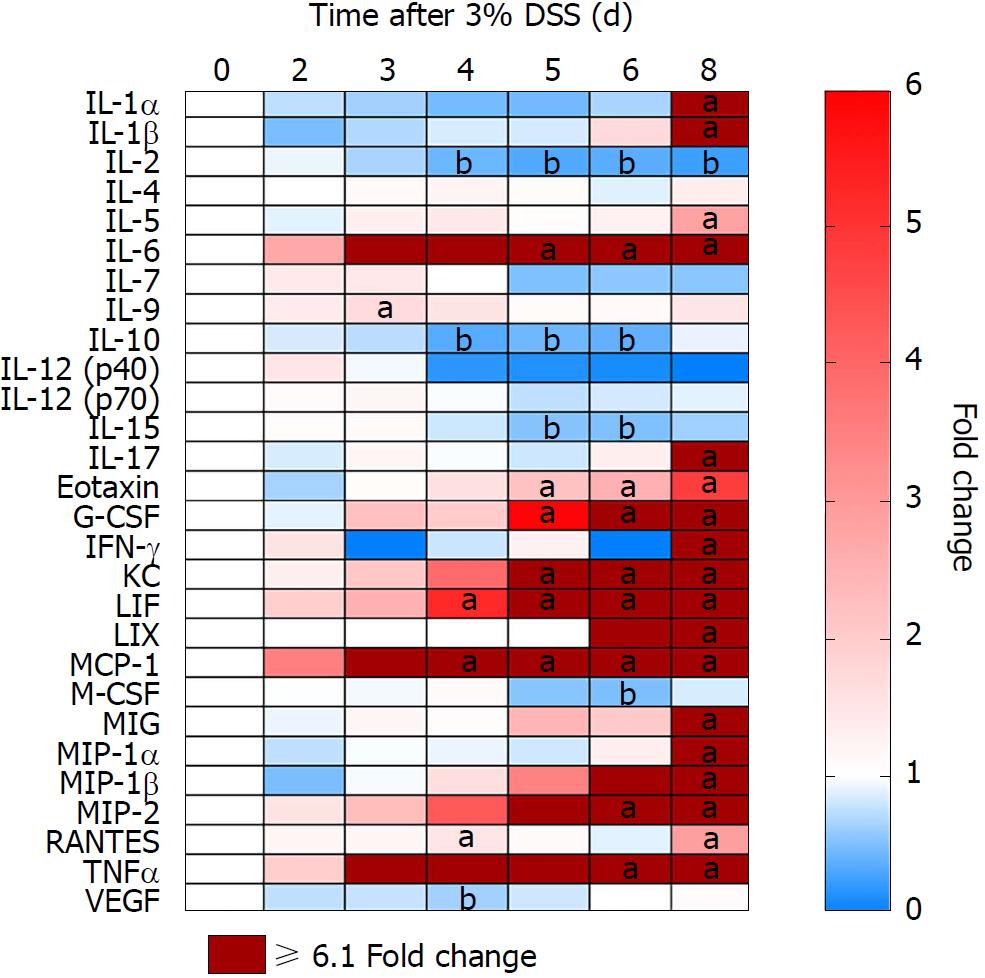
Figure 4 Colonic proteomic analysis from 3% dextran sulfate sodium time course.
After induction of ulcerative colitis with 3% DSS, colon samples were collected at different time points from day 0 to 8. Proteomics was analyzed through multiplex ELISA assay and revealed four patterns: (pattern A) Progressive decreased expression of IL-2, IL-10 and IL-15 around day 4; (pattern B) Progressive increased expression IL-6, Eotaxin, G-CSF, KC, LIF, MCP-1, MIP-2 and TNFα around day 4; (pattern C) Increased expression of CCTF after stopping 3% DSS (i.e., day 8) of IL-1α, IL1β, IL-5, IL-17, IFN-γ, LIX, MIG, MIP-1α MIP-1β, and RANTES; and (pattern D) Little or no change in IL-4, IL-7, IL-9, IL-12(p40), IL-12(p70), M-CSF and VEGF. One-way ANOVA followed by Dunnett post-hoc test. aP < 0.05 fold increases compared to control (day 0). bP < 0.05 fold decreases compared to control (day 0). n = 5-6/each time point. DSS: Dextran sulfate sodium; G-CSF: Granulocyte-colony stimulating factor; KC: Keratinocyte chemoattractant; LIF: Leukemia inhibitory factor; MCP-1: Monocyte chemoattractant protein 1; TNFα: Tumor necrosis factor alpha; IFN-γ: Interferon γ; LIX: Lipopolysaccharide-induced CXC chemokine; MIP-1α: Macrophage inflammatory protein 1α; RANTES : Regulated on activation, normal T cell expressed and secreted.
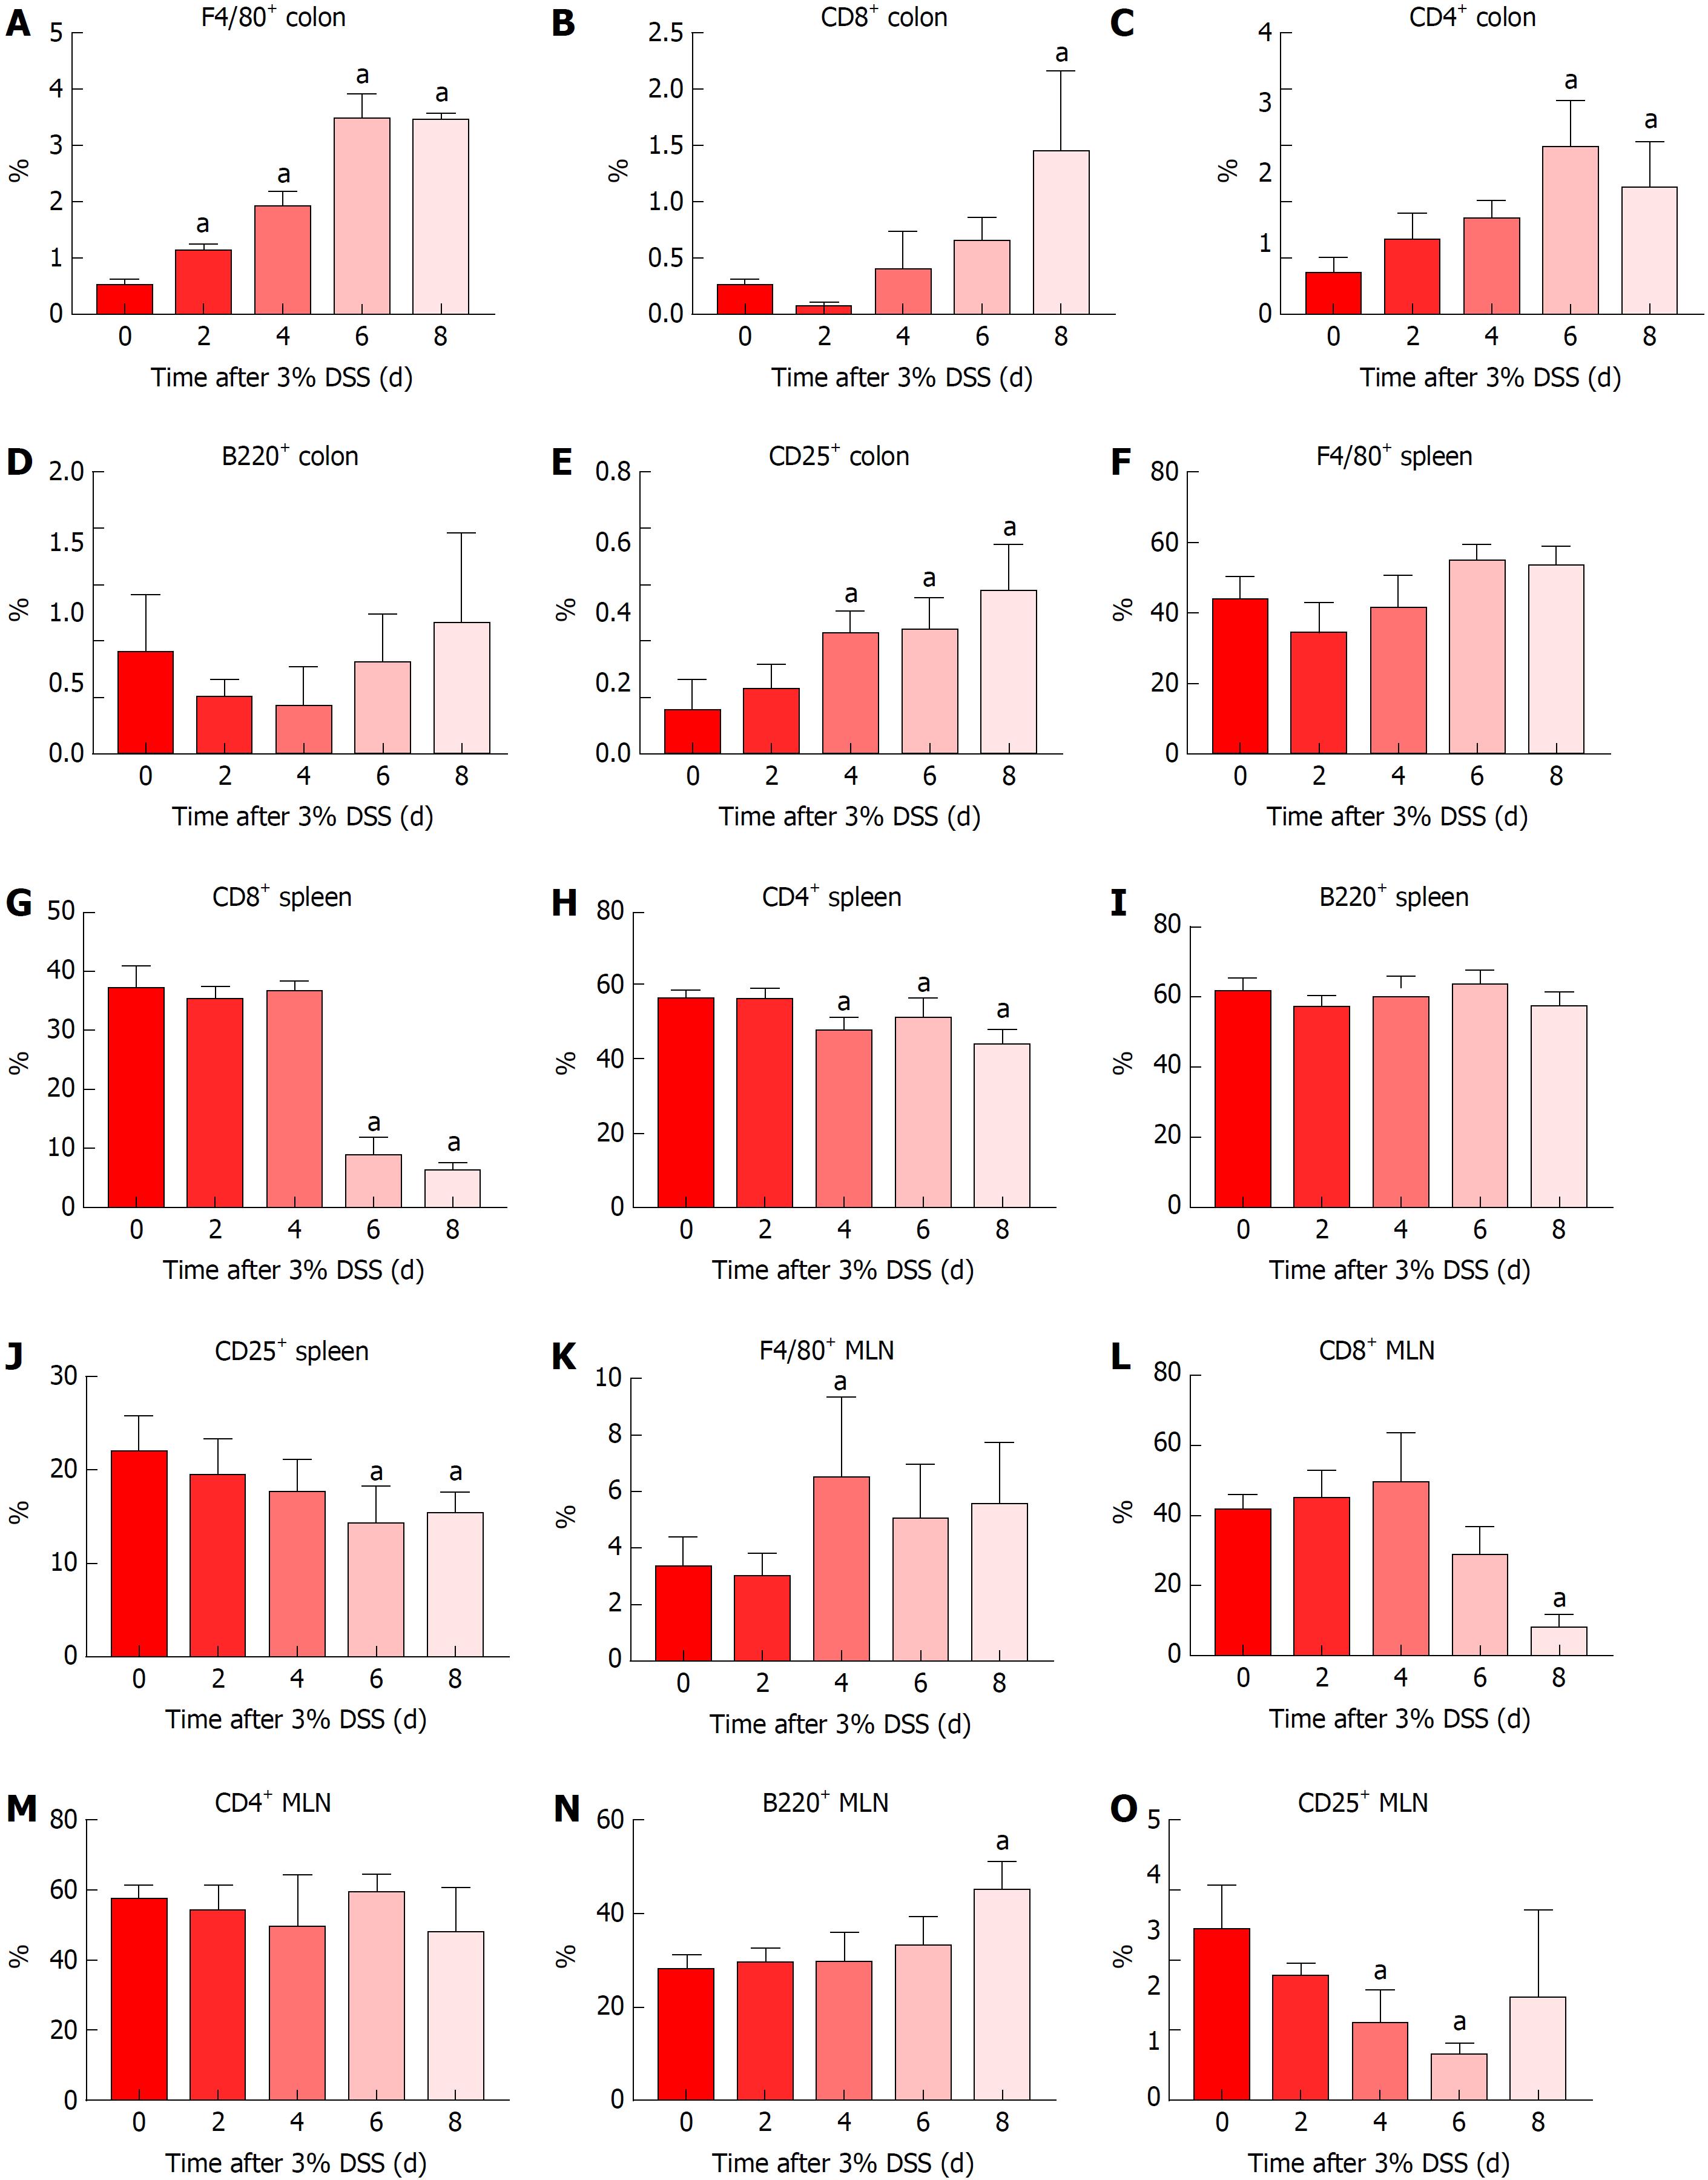
Figure 5 Immune cell profile in the colon, spleen and mesenteric lymph nodes of 3% dextran sulfate sodium animals.
Tissue samples were collected at different time points and IHC or flow cytometry were performed for temporal analysis of immune cells’ profile. Results showed progressive increased presence of colonic (A) F4/80+ macrophages, (B) CD8+ Tcyt cells, (C) CD4+ Th cells and (E) CD25+ Treg cells and no change in (D) B220+ B cells. There was no difference in splenic (F) F4/80+ macrophages and (I) B220+ B cells, however, there was a decrease in (G) CD8+ Tcyt cells, (H) CD4+ Th cells and (J) CD25+ Treg cells starting at day 4. MLN analysis resulted in decreased levels of (L) CD8+ Tcyt cells and (O) CD25+ Treg cells, along with a slight increase of (K) F4/80+ macrophages at day 4, (N) B220+ B cells at day 8 and no changes in (M) CD4+ Th cells. One-way ANOVA followed by Dunnett post-hoc test. aP < 0.05 compared to control (day 0). n = 4/each time point analyzed through IHC (All colon samples and MLN F4/80+ and CD25+). n = 6/each time point analyzed through flow cytometry (All spleen samples and MLN CD8+, CD4+ and B220+). MLN: Mesenteric lymph nodes; DSS: Dextran sulfate sodium.
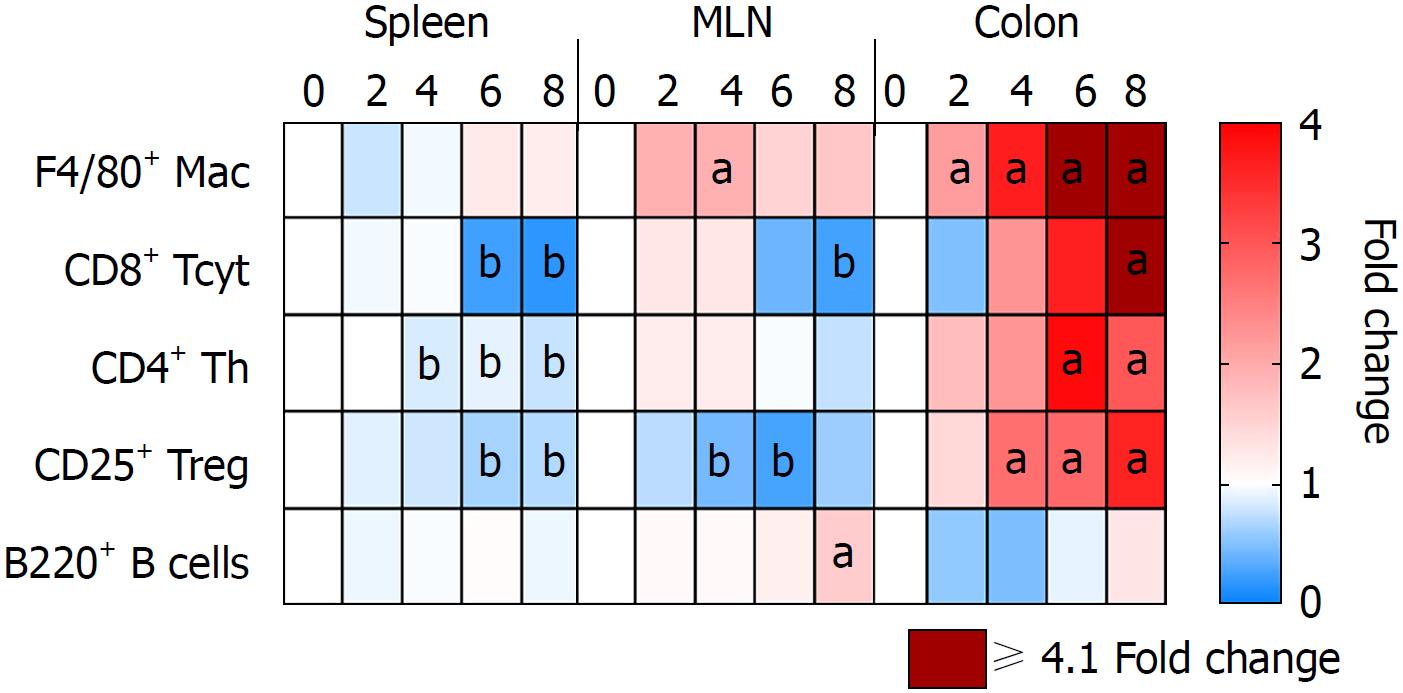
Figure 6 Immune cell population in the spleen, mesenteric lymph nodes and colon of 3% dextran sulfate sodium animals.
Tissue samples were collected from 3% DSS animals at different time points and analyzed through either immunohistochemistry or flow cytometry. The heatmap shows a possible movement of different immune cell types from the spleen and MLN into the gut progressively during the 8 d of disease. aP < 0.05 increased fold changes compared to control (day 0). bP < 0.05 decreased fold changes compared to control (day 0). MLN: Mesenteric lymph nodes; DSS: Dextran sulfate sodium.
- Citation: Nunes NS, Kim S, Sundby M, Chandran P, Burks SR, Paz AH, Frank JA. Temporal clinical, proteomic, histological and cellular immune responses of dextran sulfate sodium-induced acute colitis. World J Gastroenterol 2018; 24(38): 4341-4355
- URL: https://www.wjgnet.com/1007-9327/full/v24/i38/4341.htm
- DOI: https://dx.doi.org/10.3748/wjg.v24.i38.4341


