Copyright
©The Author(s) 2018.
World J Gastroenterol. Oct 7, 2018; 24(37): 4254-4262
Published online Oct 7, 2018. doi: 10.3748/wjg.v24.i37.4254
Published online Oct 7, 2018. doi: 10.3748/wjg.v24.i37.4254
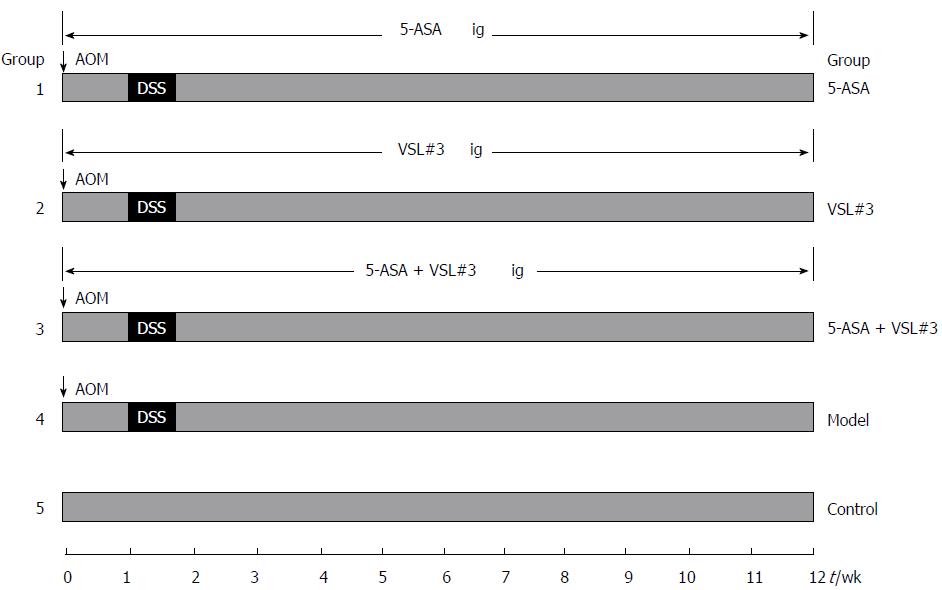
Figure 1 Experimental protocol for ulcerative colitis-associated carcinogenesis model and treatment.
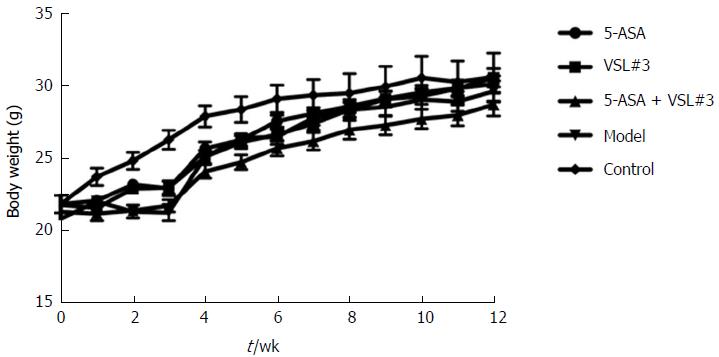
Figure 2 Body weight in each group.
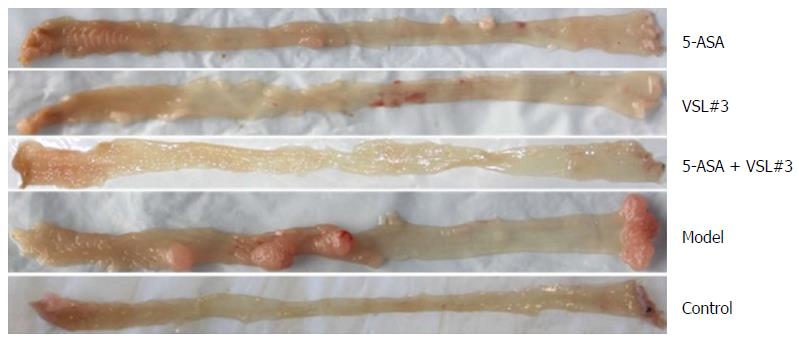
Figure 3 Representative image of colonic tumor in each group that was examined under naked eye.
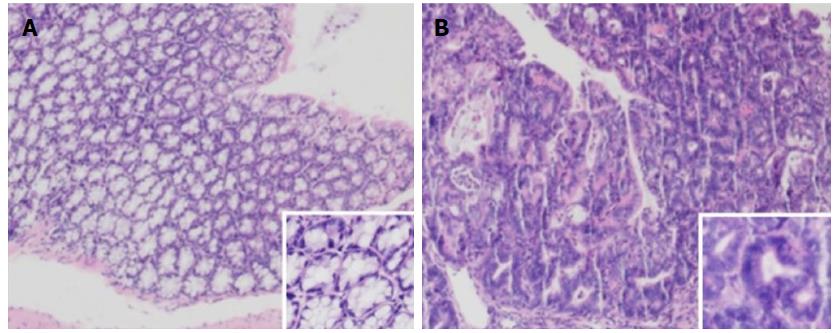
Figure 4 Representative image of hematoxylin-eosin staining of colon tissue examined under a microscope (40 × and 100 ×).
A: Control group, the colonic mucosa glands were normal in the control group, the structure was regular, and the opening was good; B: Model group, the colonic gland structure presented disorder, large nuclei, deep staining, and nucleoplasmic ratio imbalance.
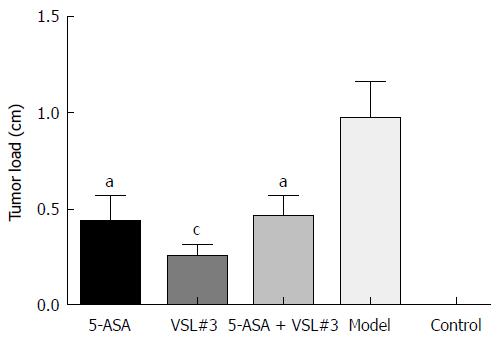
Figure 5 Tumor load in each group.
aP < 0.05, bP < 0.01, cP < 0.001.
Figure 6 Colonic tumor necrosis factor-α and interleukin-6 levels in different groups.
aP < 0.05, bP < 0.01, cP < 0.001. TNF-α: Tumor necrosis factor-α; IL-6: Interleukin-6.
- Citation: Wang CSE, Li WB, Wang HY, Ma YM, Zhao XH, Yang H, Qian JM, Li JN. VSL#3 can prevent ulcerative colitis-associated carcinogenesis in mice. World J Gastroenterol 2018; 24(37): 4254-4262
- URL: https://www.wjgnet.com/1007-9327/full/v24/i37/4254.htm
- DOI: https://dx.doi.org/10.3748/wjg.v24.i37.4254


