Copyright
©The Author(s) 2018.
World J Gastroenterol. Sep 28, 2018; 24(36): 4197-4207
Published online Sep 28, 2018. doi: 10.3748/wjg.v24.i36.4197
Published online Sep 28, 2018. doi: 10.3748/wjg.v24.i36.4197
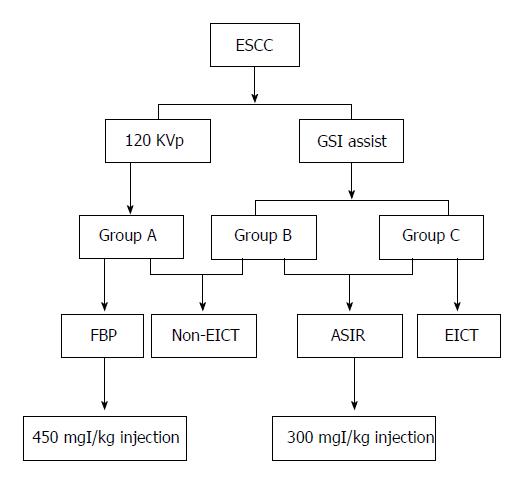
Figure 1 Study flow chart.
ESCC: Esophageal squamous cell carcinoma; FBP: Filtered back projection; EICT: Esophageal insufflation computed tomography; ASIR: Adaptive statistical iterative reconstruction.
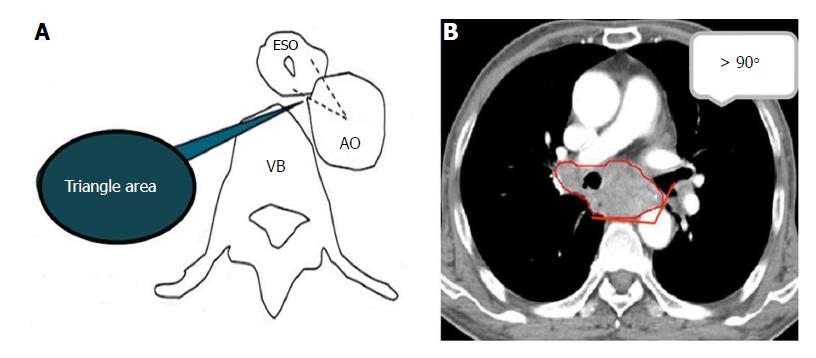
Figure 2 The morphological features of the triangular area in front of the vertebral body.
A: Sketch of the triangular area. The triangular space is surrounded by the outer esophageal membrane, thoracic aorta and vertebral body. B: The contact arc between the tumor and thoracic aorta is less than 45°; a contact arc of 45-90° corresponds to suspected invasion, and a contact arc larger than 90° indicates thoracic aorta invasion. VB: Vertebral body.
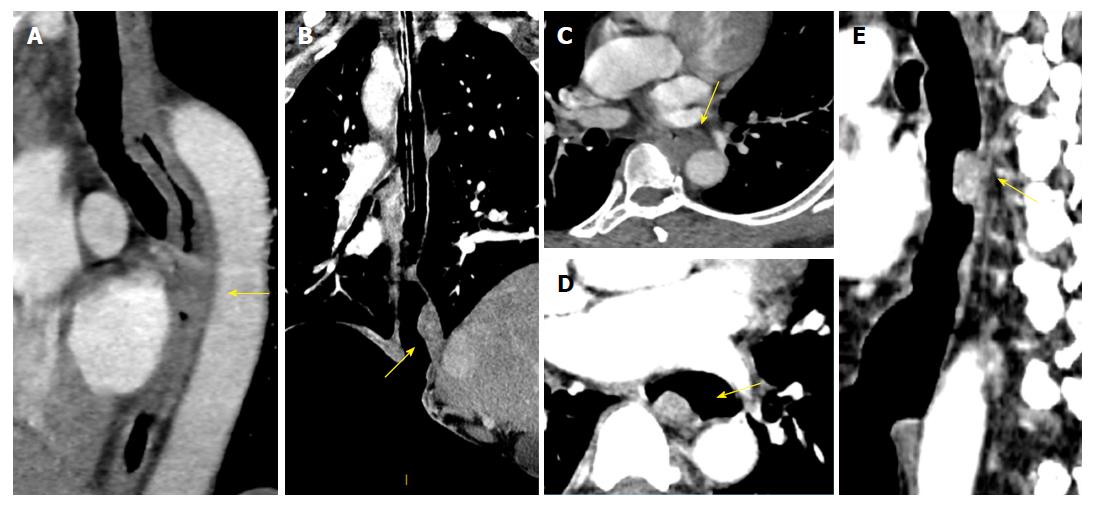
Figure 3 Typical cases showing the esophageal wall of group A, B and C.
A: A sagittal reformatted image obtained via 120 kVp combined with FBP reconstruction shows unlayered enhanced esophageal cancer in a 53-year old patient (yellow arrow). The esophageal wall appears to be generally thickened over a long distance but without an enhanced layer. B: Moderately enhanced esophageal cancer in the lower esophagus of a 61-year old patient. The coronal reformatted image obtained via EICT combined with GSI assist at 50 KeV shows that the lesion appears to protrude into the lumen (yellow arrow). The lumen is filled with air without esophageal wall shrinkage. C: A 63-year old patient with histopathological T2N0M0. The axial image in the venous phase shows esophageal wall thickening, but it is difficult to identify layers (yellow arrow). Due to nose or mouth leakage, non-EICT is displayed in the venous phase for this patient. D-F: The same patient as in (C); axial and sagittal images obtained via EICT combined with GSI assist at 50 KeV show the wall thickness as if a partial mass was present with a moderate enhancement in the arterial phase (yellow arrow). EICT: Esophageal insufflation computed tomography.
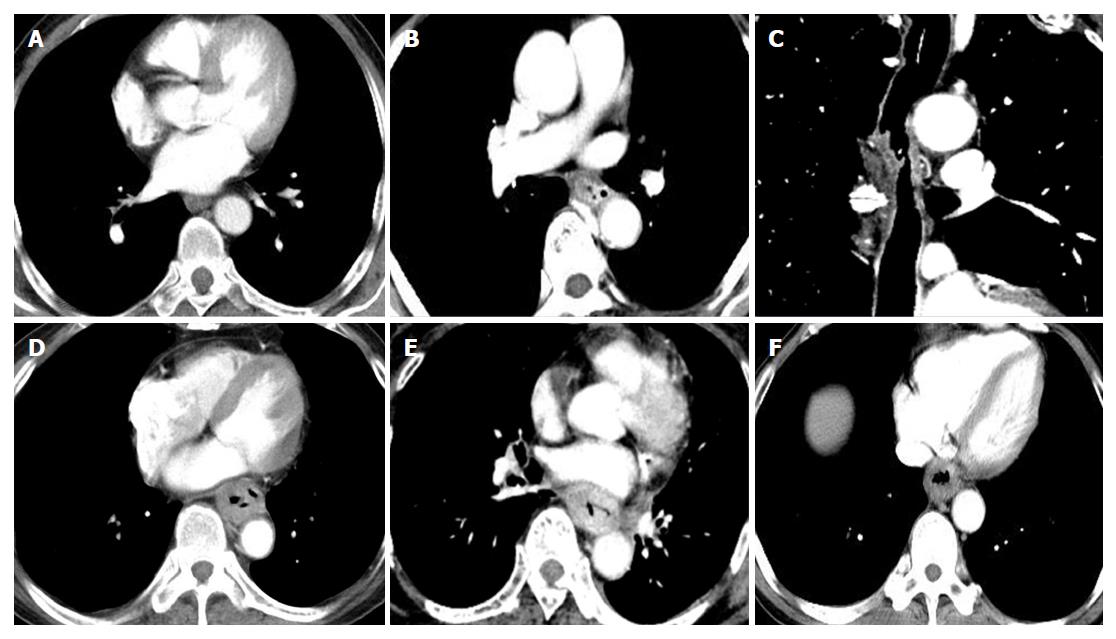
Figure 4 Typical cases between T1/2 and T3 stages of esophageal squamous cell carcinoma in group A, B and C.
A: An axial image obtained via 120 kVp combined with FBP reconstruction of a 56-year old patient shows unlayered enhanced wall thickening at the lower esophagus with histopathological T2N0M0. B: A 62-year old, correctly-staged patient with histopathological T2N0M0ESCC of the middle esophagus. The axial image at 50 KeV obtained by GSI assist depicts significantly layered enhanced wall thickening, which was regarded as invasion within the submucosal or muscle layer. C: A 58-year old patient with histopathological T2N0M0; sagittal reformatted image obtained via EICT combined with GSI assist at 50 KeV shows slightly mucosal enhanced wall thickening with an ulcer on the surface. D: An axial image obtained via 120 kVp combined with FBP reconstruction of a 59-year old patient shows unlayered enhanced wall thickening at the lower esophagus with histopathological T3N1M0. E: A 55-year old patient with T3N0M0; axial image obtained using GSI assist at 50 KeV shows more obvious enhanced wall thickening than the image obtained by conventional 120 kVp. F: A 61-year old patient with T3N0M0; EICT combined with GSI assist exhibits unlayered enhanced esophageal wall thickening surrounding the air-filled lumen. EICT: Esophageal insufflation computed tomography; ESCC: Esophageal squamous cell carcinoma.
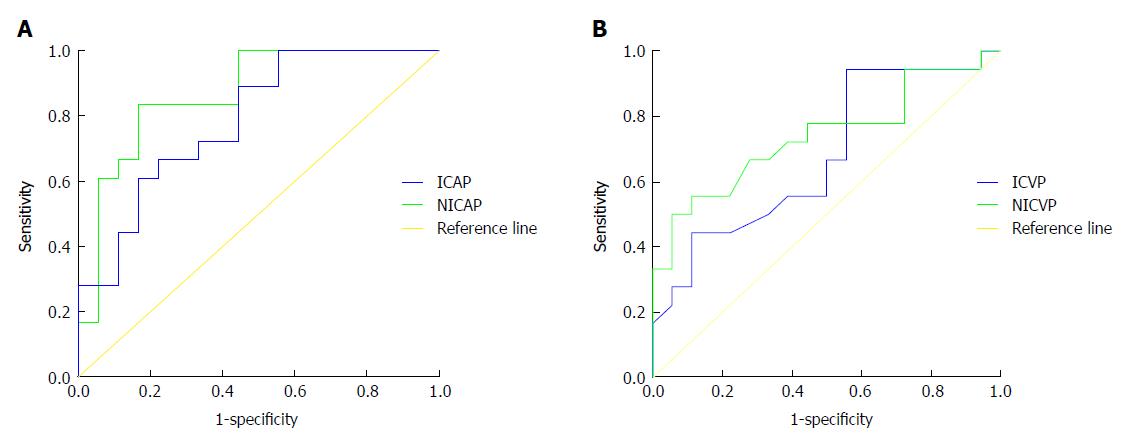
Figure 5 Receiver operating characteristic curves.
Graphs showing the sensitivity and specificity of both iodine concentration and normalized iodine concentration of adipose tissue in the triangular area in front of the vertebral body during the arterial phase and the venous phase for differential diagnosis of T3 and T4 stages. AP: Arterial phase; VP: Venous phase; IC: Iodine concentration; NIC: Normalized iodine concentration.
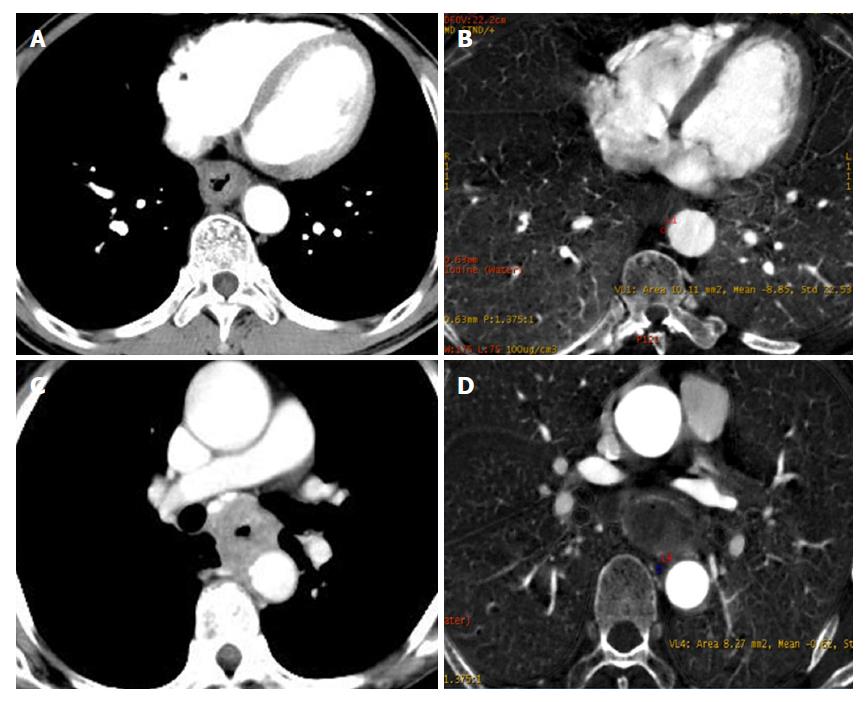
Figure 6 Typical cases showing differences between the T3 and T4 stages of esophageal squamous cell carcinoma.
A: Image from a 62-year old patient with T3N0M0 obtained using EICT combined GSI assist shows a clear triangular area in front of the vertebral body. B: IC in the triangle area during the AP was quantified to be -8.85 μg/cm3, and NIC during the AP was -0.05 μg/cm3. C: An axial image of a 57-year old patient obtained by EICT combined with GSI assist during the AP shows that the adipose tissue of the triangular area disappeared with suspected tumor invasion. D: IC in the triangle area during the AP was quantified to be -0.62 μg/cm3, and NIC during the AP was -0.01 μg/cm3. EICT: Esophageal insufflation computed tomography; IC: Iodine concentration; NIC: Normalized iodine concentration; AP: Arterial phase.
- Citation: Zhou Y, Liu D, Hou P, Zha KJ, Wang F, Zhou K, He W, Gao JB. Low-dose spectral insufflation computed tomography protocol preoperatively optimized for T stage esophageal cancer - preliminary research experience. World J Gastroenterol 2018; 24(36): 4197-4207
- URL: https://www.wjgnet.com/1007-9327/full/v24/i36/4197.htm
- DOI: https://dx.doi.org/10.3748/wjg.v24.i36.4197


