Copyright
©The Author(s) 2018.
World J Gastroenterol. Sep 28, 2018; 24(36): 4164-4177
Published online Sep 28, 2018. doi: 10.3748/wjg.v24.i36.4164
Published online Sep 28, 2018. doi: 10.3748/wjg.v24.i36.4164
Figure 1 Immunohistochemical illustrations of colorectal carcinoma and control colon with mucin 1 and mucin 2 positive expression.
A: Representative IHC expression of MUC1 in luminal surface epithelium (arrow) of tumor-changed colon crypt; B: Membranous and extracellular pattern (arrow) of MUC1 expression in neoplastic cells lining the glandular structures of CRC; C: Representative image of MUC1 membranous localization in normal colon crypts; D: Cytoplasmic expression of MUC2 in scattered epithelial cells of the tumor-changed colon crypt (arrow); E: IHC intense reaction of MUC2 expression in the cytoplasm of numerous cancer cells and/or localized in the lumen of the colon crypts (arrow); F: Cytoplasmic expression of MUC2 in majority of goblet cells in normal colon epithelium. Sections were counterstained with hematoxylin. Objective × 40. MUC1: Mucin 1; MUC2: Mucin 2; IHC: Immunohistochemical; CRC: Colorectal cancer.
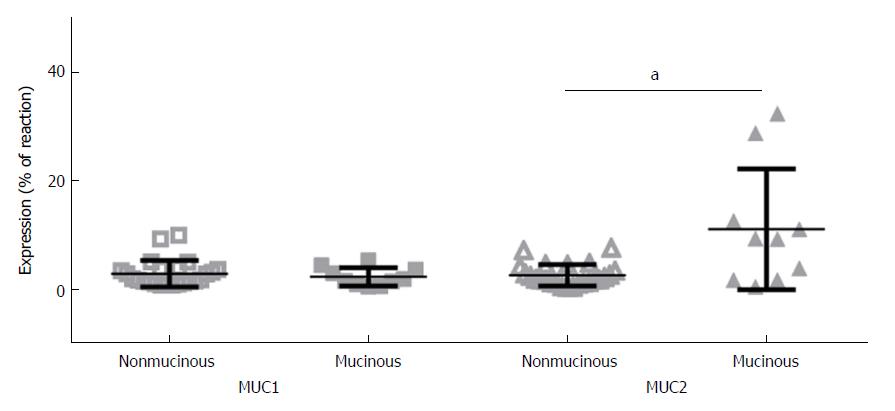
Figure 2 Comparative immunoexpression of mucin 1 and mucin 2 in nonmucinous and mucinous subtypes of colorectal carcinoma.
Mean ± SD. aP (level of significance) value < 0.05. MUC1: Mucin 1; MUC2: Mucin 2.
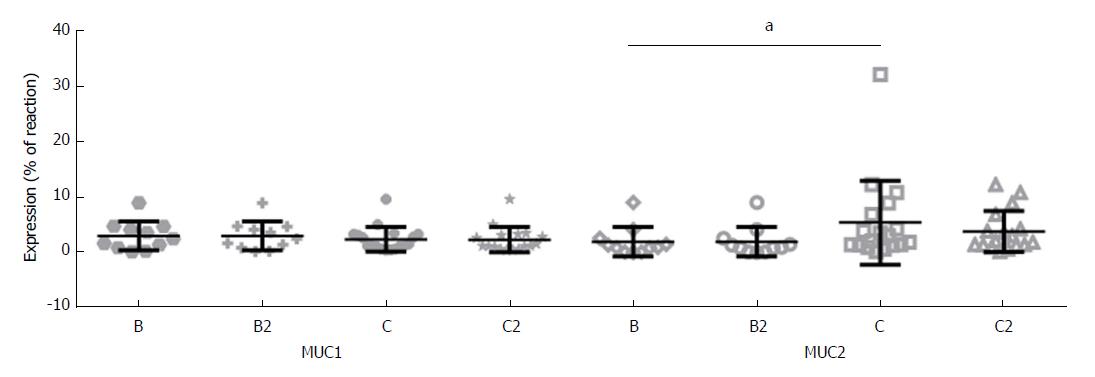
Figure 3 Tissue expression of mucin 1 and mucin 2 in colorectal carcinoma as related to Dukes and Astler and Coller staging system.
Mean ± SD. B, C: Dukes staging system; B2, C2: Astler and Coller staging system. aP (level of significance) value < 0.05. MUC1: Mucin 1; MUC2: Mucin 2.
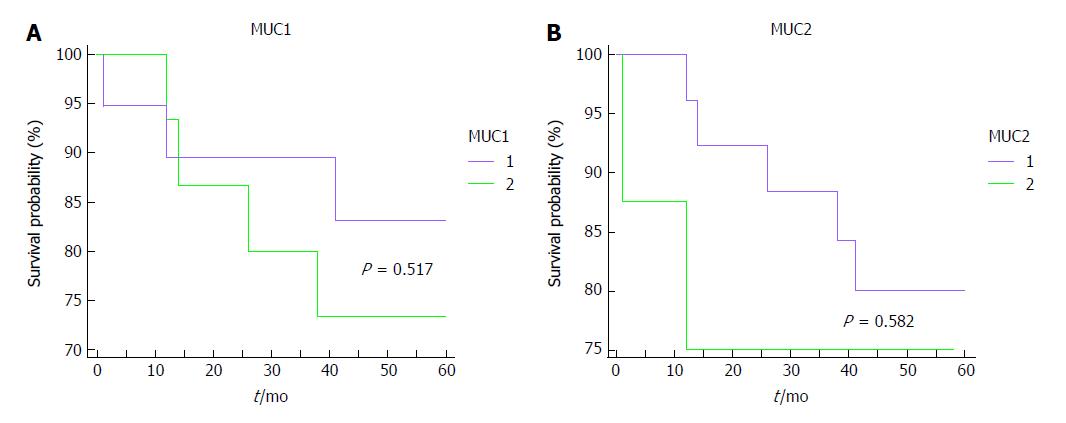
Figure 4 Kaplan-Meier survival curves for colorectal carcinoma patients, as related to tissue expression of mucin 1 and mucin 2 showing that expression of both mucins in tissue samples are not associated with survival time.
A: Kaplan Meier survival curve related to tissue expression of MUC1; B: Kaplan Meier survival curve related to tissue expression of MUC2. 1: Under mean tissue expression; 2: Above mean tissue expression. MUC1: Mucin 1; MUC2: Mucin 2.
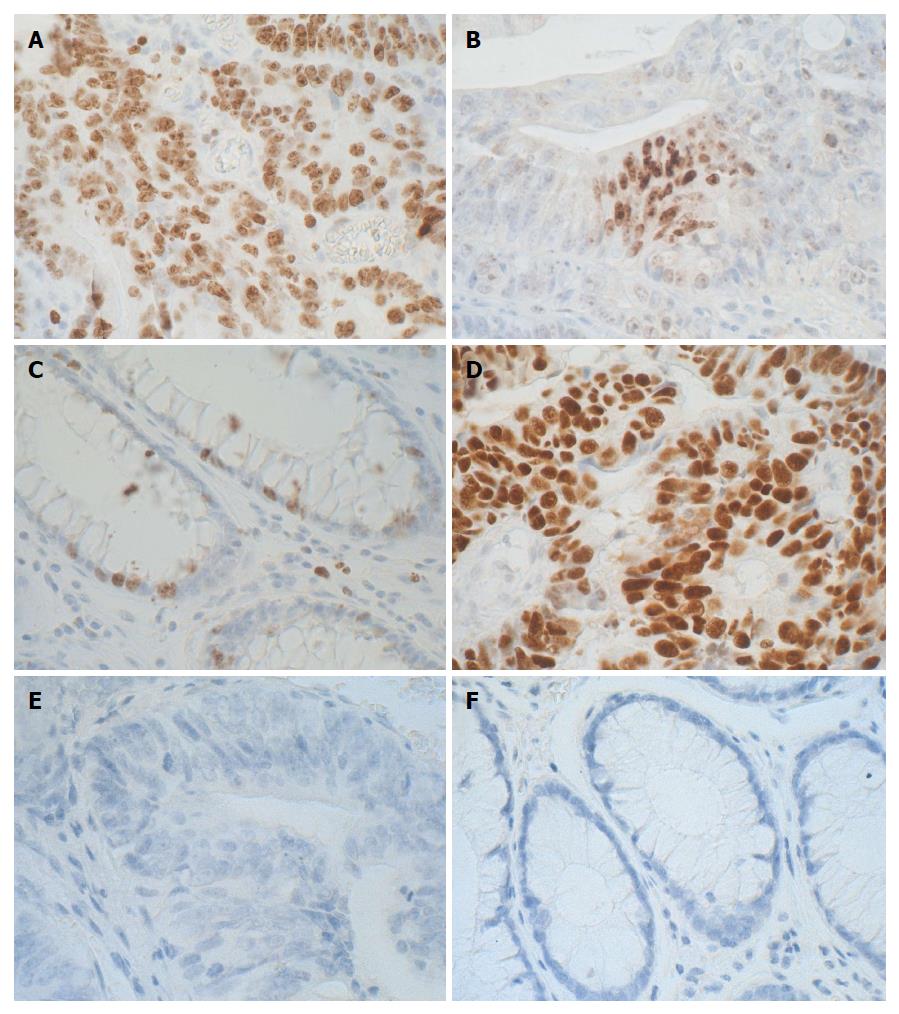
Figure 5 Immunohistochemical illustrations of colorectal carcinoma and control colon with Ki-67 antigen and p53 expression.
A: Representative IHC expression of Ki-67 proliferating antigen in the majority of tumor cell nuclei; B: An intense nuclear pattern of Ki-67 expression in focally located tumor cells; C: Representative image of Ki-67 proliferating antigen immunoexpression in the individual basally located nuclei of the goblet cells lining the unaltered intestinal crypts; D: A pronounced p53 nuclear pattern of IHC reaction in glandular structures of CRC; E: Negative IHC reaction for p53 in tumor of other CRC patient; F: Negative IHC reaction for p53 in normal colon. Sections were counterstained with hematoxylin. Objective × 40. IHC: Immunohistochemical; CRC: Colorectal cancer.
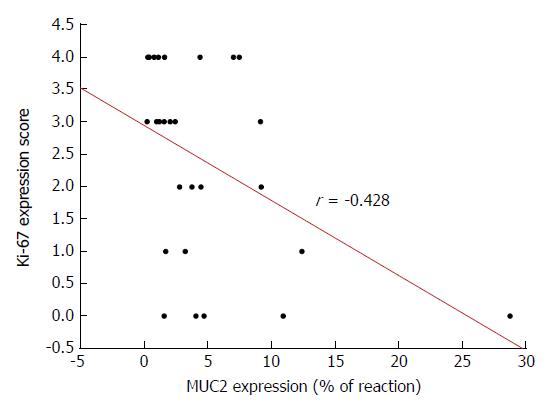
Figure 6 Spearman’s correlation between the expression of mucin 2 protein and of Ki-67 proliferating antigen in colorectal carcinoma.
MUC2: Mucin 2.
- Citation: Kasprzak A, Siodła E, Andrzejewska M, Szmeja J, Seraszek-Jaros A, Cofta S, Szaflarski W. Differential expression of mucin 1 and mucin 2 in colorectal cancer. World J Gastroenterol 2018; 24(36): 4164-4177
- URL: https://www.wjgnet.com/1007-9327/full/v24/i36/4164.htm
- DOI: https://dx.doi.org/10.3748/wjg.v24.i36.4164


