Copyright
©The Author(s) 2018.
World J Gastroenterol. Sep 21, 2018; 24(35): 4028-4035
Published online Sep 21, 2018. doi: 10.3748/wjg.v24.i35.4028
Published online Sep 21, 2018. doi: 10.3748/wjg.v24.i35.4028
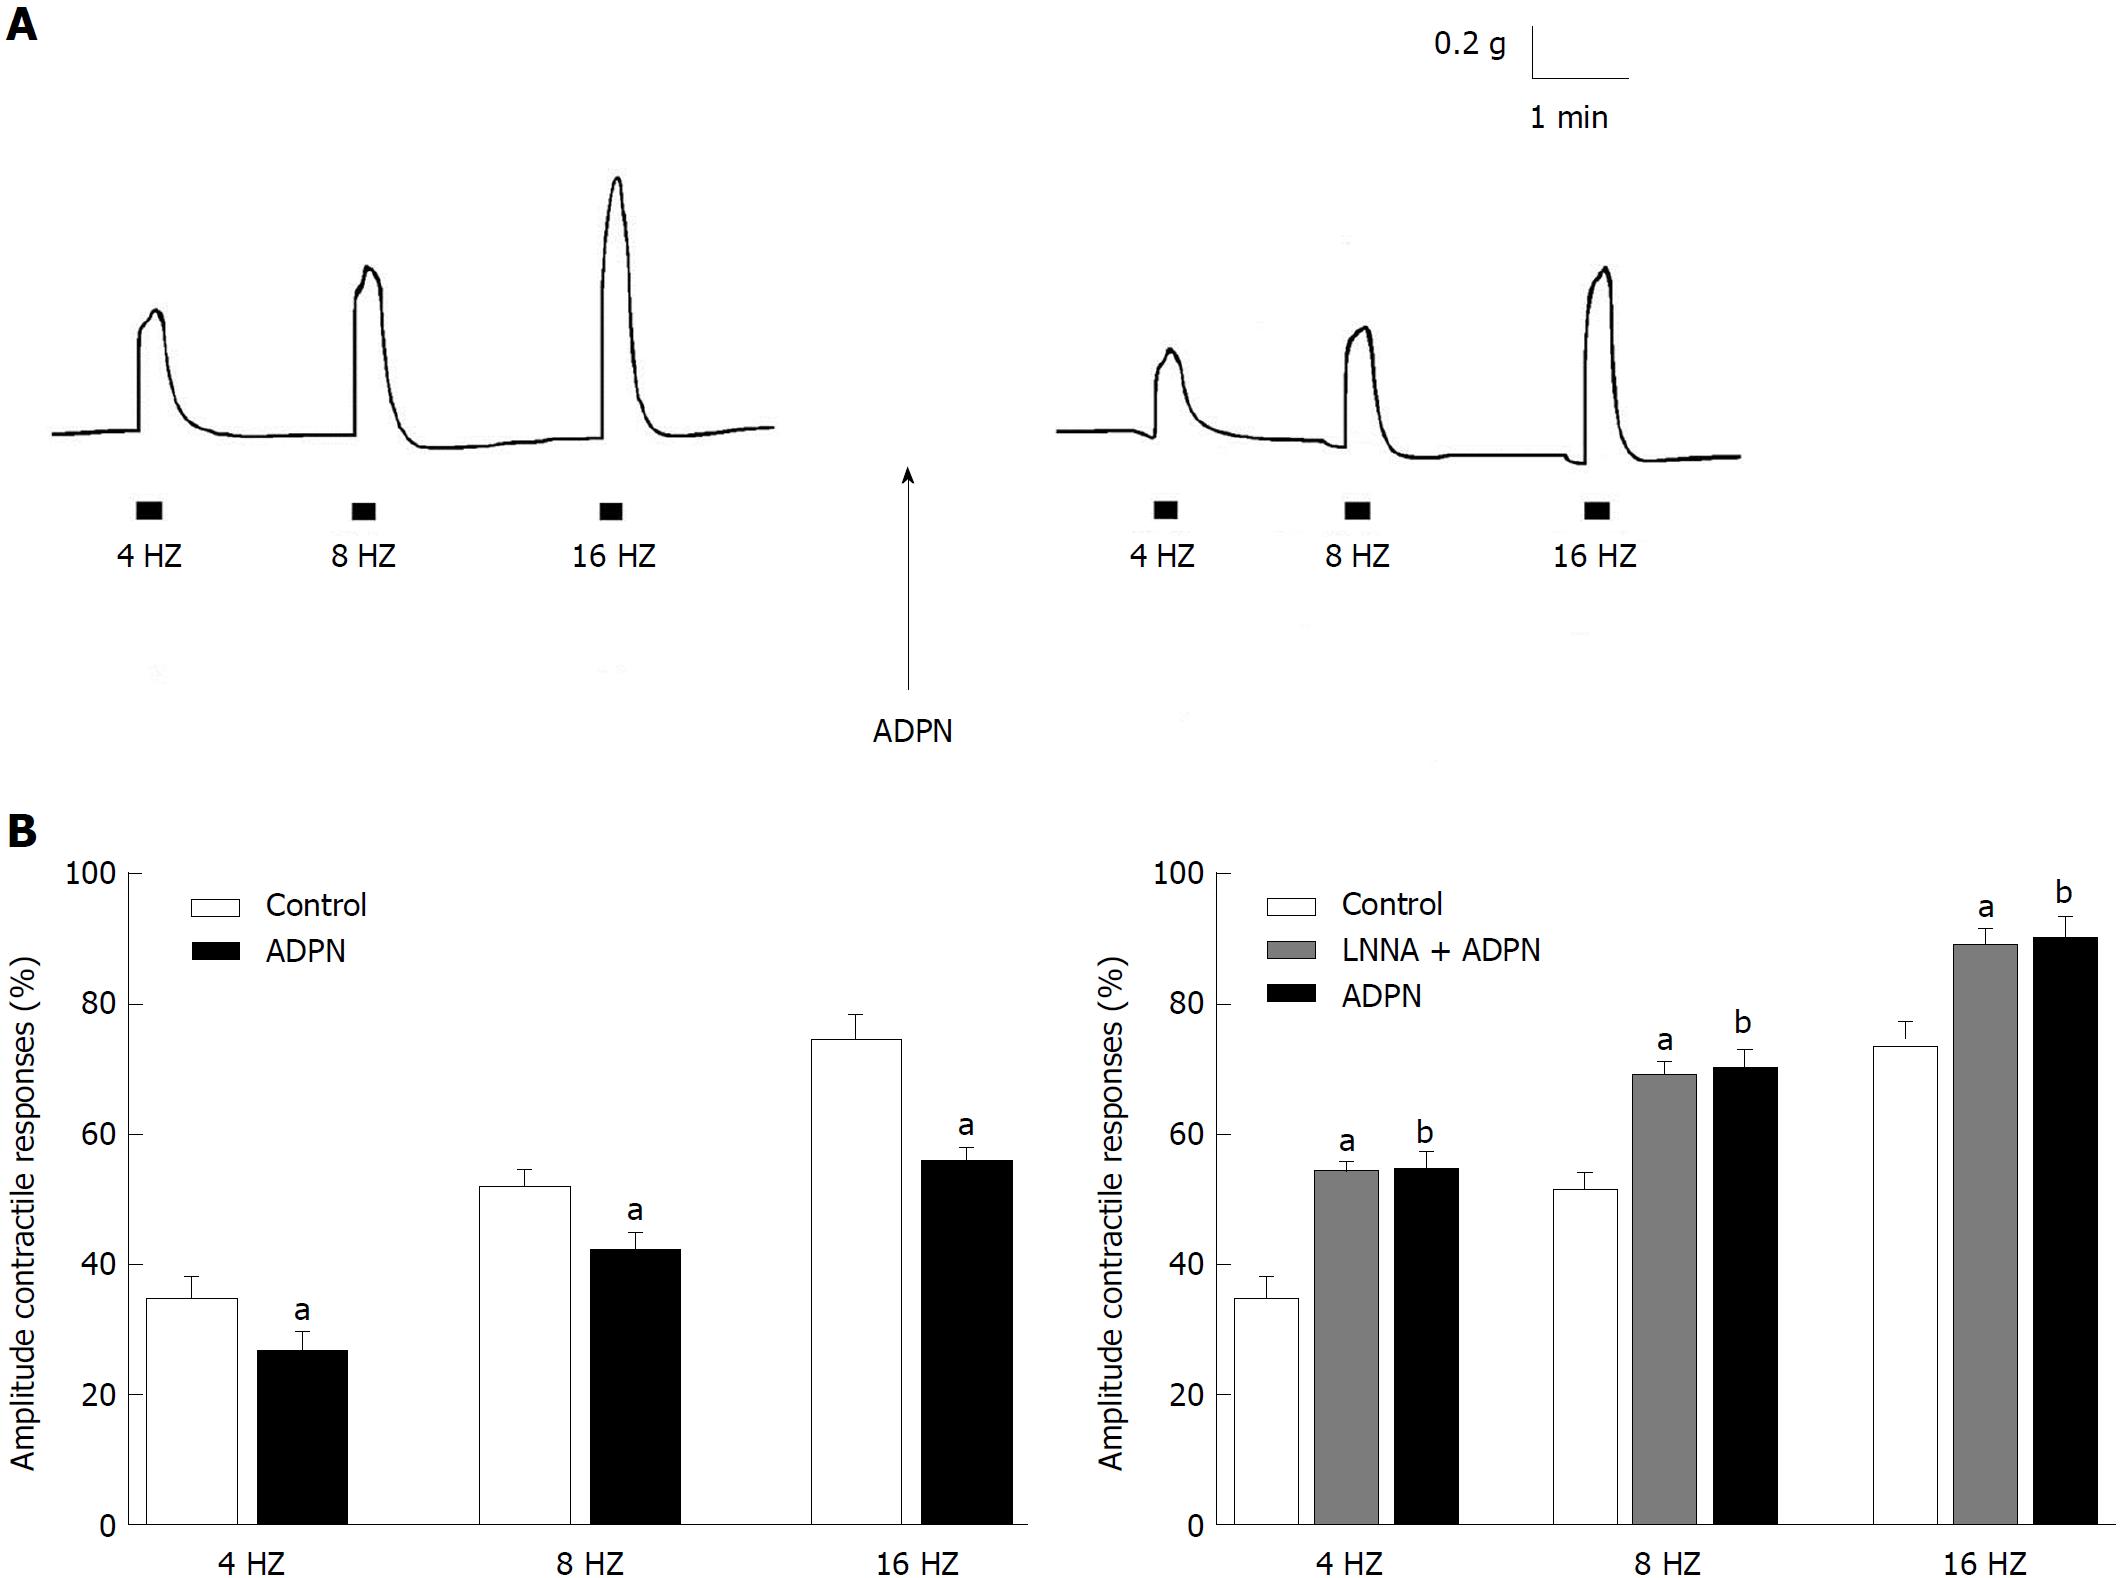
Figure 1 Effects of adiponectin on the neurally-induced contractile responses in strips from the mouse gastric fundus.
A: Typical tracing showing the contractile responses to EFS (left hand panel). ADPN (20 nmol/L) decreases the amplitude of the neurally-induced contractile responses (right hand panel); B: Bar charts showing the influence of ADPN (20 nmol/L) on the mean amplitude of the EFS-induced contractile responses in the absence (left hand panel) and in the presence (right hand panel) of L-NNA (200 μmol/L). Note that, in the presence of L-NNA, ADPN no longer decreases the amplitude of the neurally-induced excitatory responses in the whole range of stimulation frequency employed. Amplitude of contractile responses is expressed as percentage of the muscular contraction evoked by 2 μmol/L methacholine, assumed as 100%. All values are means ± SE of 6 strips from 3 mice. aP < 0.05 vs the control; bP < 0.05 and P > 0.05 vs the control and vs L-NNA, respectively (Student's t-test plus ANOVA and Newman-Keuls post-test). ADPN: Adiponectin; L-NNA: L-NG-nitro arginine.
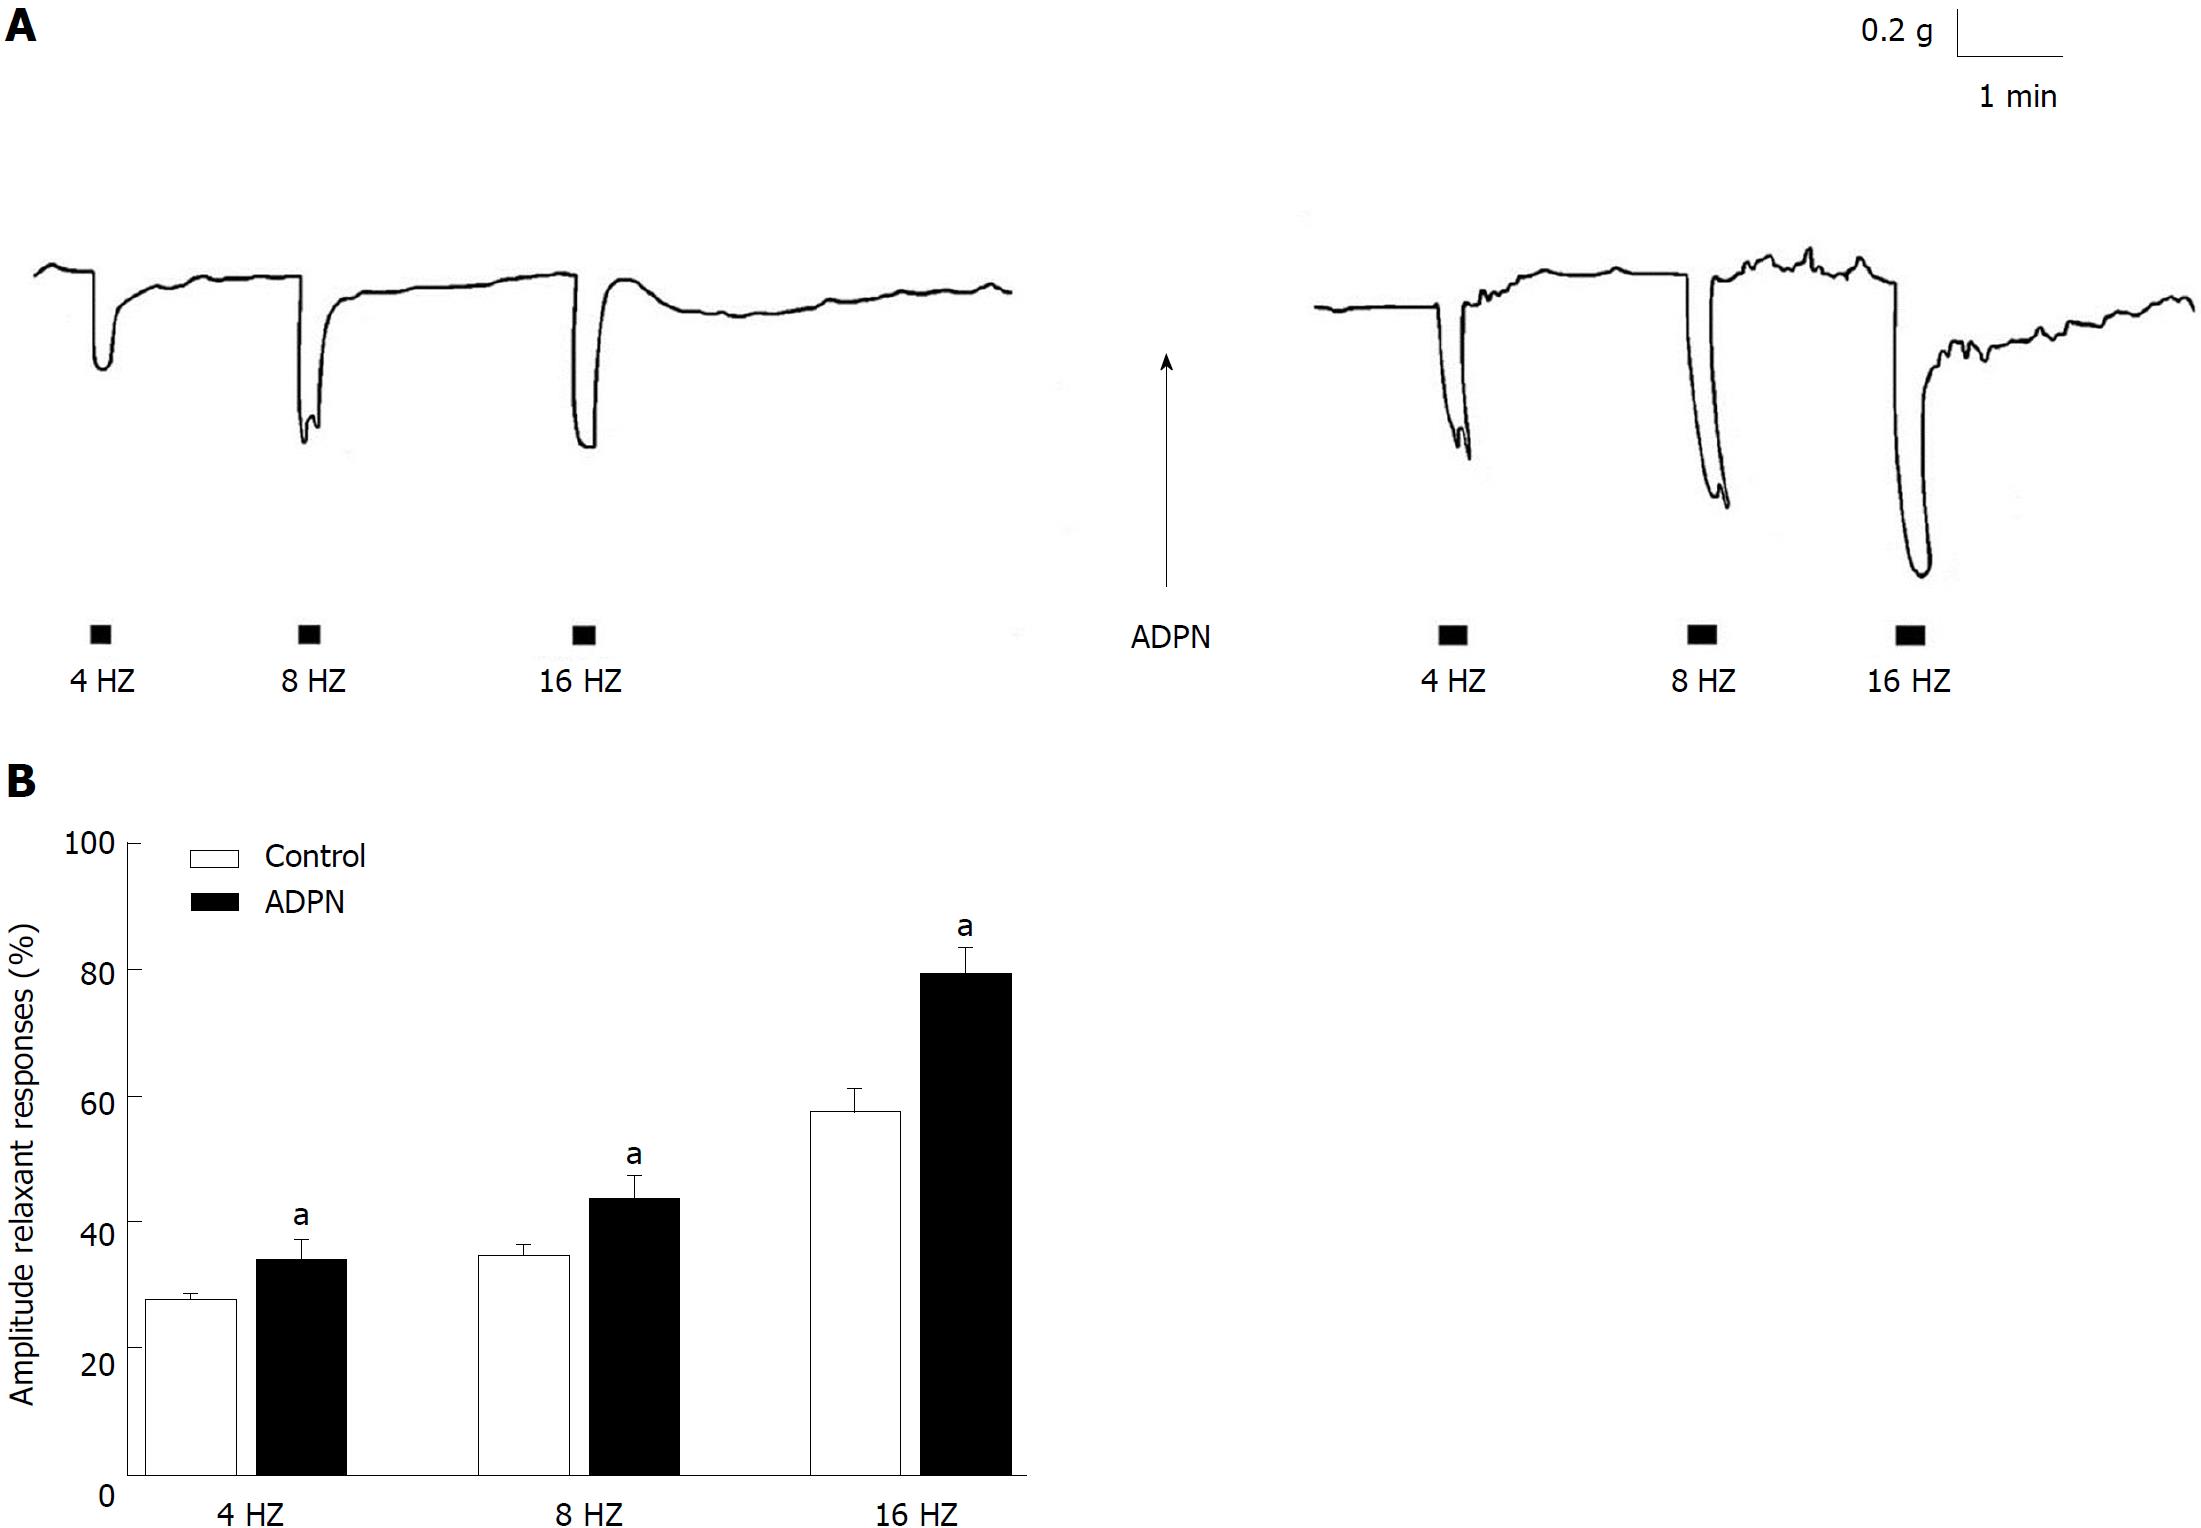
Figure 2 Effects of adiponectin on the neurally-induced relaxant responses in strips from the mouse gastric fundus.
A: Typical tracing showing the relaxant responses to EFS (left hand panel). ADPN (20 nmol/L) increases the amplitude of the neurally-induced relaxant responses (right hand panel); B: Bar chart showing the influence of ADPN on the mean amplitude of the EFS-induced relaxant responses. Note that ADPN increases the amplitude of the neurally-induced relaxation in the whole range of stimulation frequency employed. Relaxant responses are expressed as percentage decrease relative to the muscular tension induced by 1 μmol/L CCh just before obtaining relaxations. All values are means ± SE of 6 strips from 3 mice. aP < 0.05 vs the control (Student's t-test). ADPN: Adiponectin.
Figure 3 Expression of adiponectin receptors, Adipo-R1 and Adipo-R2, in murine gastric fundus.
Typical PCR analysis recorded in the same GF revealed the expression of both AdipoR1 (left hand) and AdipoR2 (right hand) receptors. Positive controls derived from inguinal fat pad cDNA (Fat) and NC without cDNA template (water). Marker: 100 bp marker (NEB). GF: Gastric fundus; NC: Negative control.
- Citation: Idrizaj E, Garella R, Castellini G, Mohr H, Pellegata NS, Francini F, Ricca V, Squecco R, Baccari MC. Adiponectin affects the mechanical responses in strips from the mouse gastric fundus. World J Gastroenterol 2018; 24(35): 4028-4035
- URL: https://www.wjgnet.com/1007-9327/full/v24/i35/4028.htm
- DOI: https://dx.doi.org/10.3748/wjg.v24.i35.4028


