Copyright
©The Author(s) 2018.
World J Gastroenterol. Sep 7, 2018; 24(33): 3749-3759
Published online Sep 7, 2018. doi: 10.3748/wjg.v24.i33.3749
Published online Sep 7, 2018. doi: 10.3748/wjg.v24.i33.3749
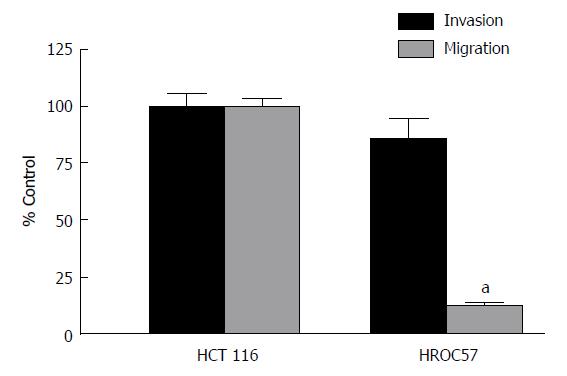
Figure 1 Migratory potential and invasiveness of HROC 57 cells.
Invasion and migration of the cell line HROC57 in comparison to the reference cell line HCT116 was analyzed. Cells were subjected to migration assay (Migration, grey bars) and matrigel invasion assay (Invasion, black bars). Values are means ± SEM of n = 3. aP < 0.05 vs HCT116.
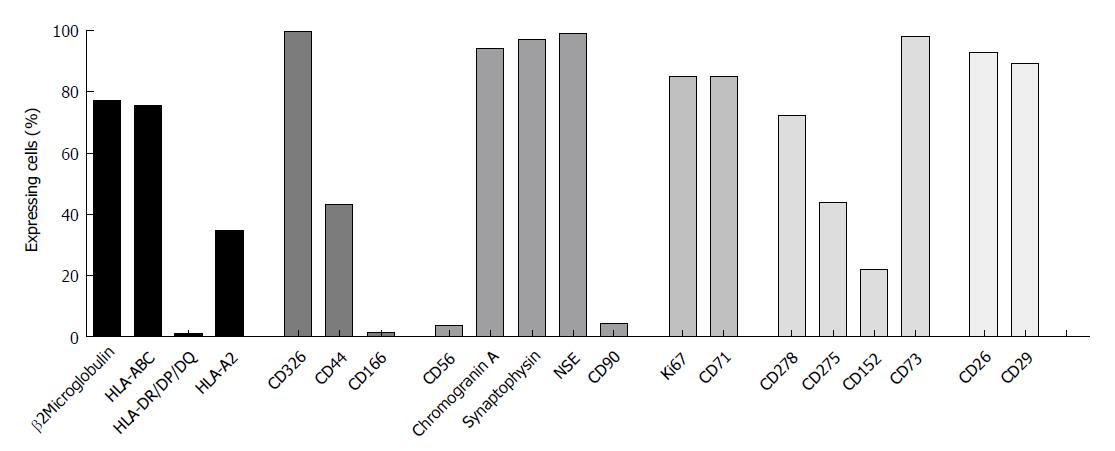
Figure 2 Expression of human lymphocyte antigen molecules (ß2Microglobulin, HLA-ABC, HLA-DR/DP/DQ, HLA-A2, epithelial cell markers (CD26, CD29, CD44, CD166, CD326), neuroendocrine markers (CD56, Chromogranin A, Synapthophysin, NSE, CD90), proliferation markers (Ki67, CD71) and immune evasion molecules (CD73, CD152, CD275, CD278) were assessed by flow cytometry using a BD FACSARIA II.
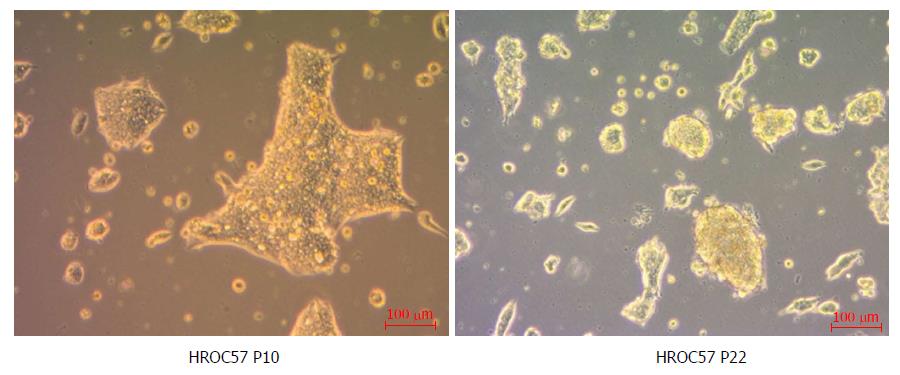
Figure 3 Light microscopy of HROC57 after direct establishment (P10) and medium-term in vitro culture (P22).
Cell lines were established directly from patients’ tumor material as described in material and methods. Original magnification: × 100.
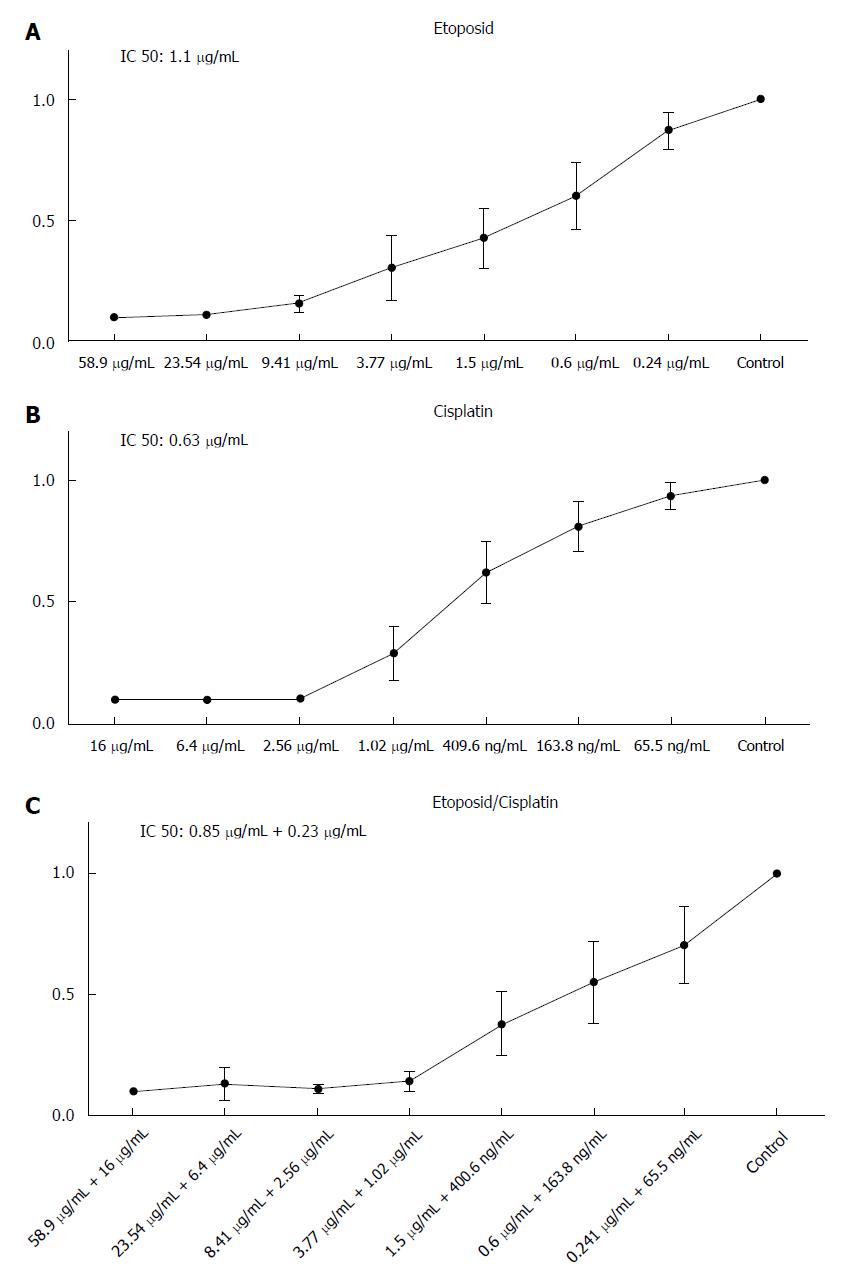
Figure 4 Sensitivity of HROC57 to conventional chemotherapeutics.
HROC57was treated for 72 h with etoposide (A), cisplatin (B) and combination of etoposide and cisplatin (C). Cell viability was measured using the crystal violet assay as described in materials and methods. Values represent the mean absorbance at 570 nm ± SD of n = 4 analyses.
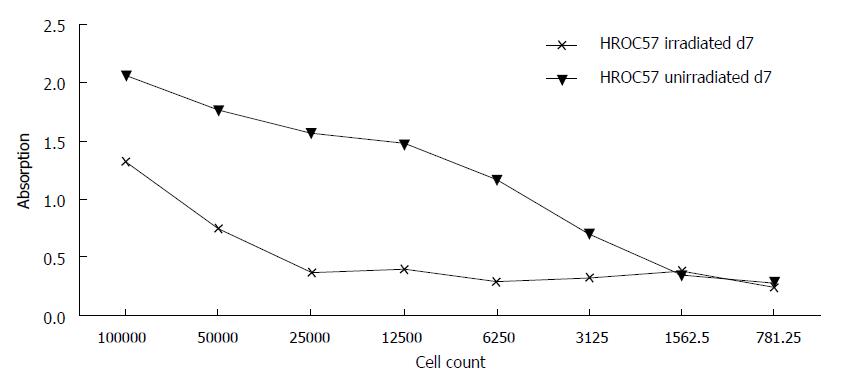
Figure 5 Radiosensitivity of HROC57.
HROC57 was irradiated with 50 Gy using a 137CS-source. Control cells were not irradiated. Cell viability was measured using the crystal violet assay as described in materials and methods. n = 2 analyses.
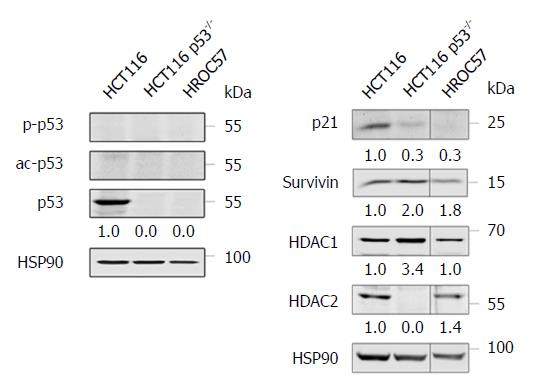
Figure 6 Expression of p53 and some of its targets in HROC57 cells.
Western Blot analysis of untreated HROC57 cells compared to HCT116 (p53 wildtype) and HCT116 p53-/- was performed. Acetylation (K382) and phosphorylation (S15) of p53 (A) and expression of its targets p21, survivin and HDAC 1 and 2 (B) were assessed using specific antibodies. HSP90 served as loading control. Numbers indicate densitometric analysis of respective signals normalized to loading control and relative to HCT116 cells.
- Citation: Gock M, Mullins CS, Harnack C, Prall F, Ramer R, Göder A, Krämer OH, Klar E, Linnebacher M. Establishment, functional and genetic characterization of a colon derived large cell neuroendocrine carcinoma cell line. World J Gastroenterol 2018; 24(33): 3749-3759
- URL: https://www.wjgnet.com/1007-9327/full/v24/i33/3749.htm
- DOI: https://dx.doi.org/10.3748/wjg.v24.i33.3749


