Copyright
©The Author(s) 2018.
World J Gastroenterol. Aug 14, 2018; 24(30): 3448-3461
Published online Aug 14, 2018. doi: 10.3748/wjg.v24.i30.3448
Published online Aug 14, 2018. doi: 10.3748/wjg.v24.i30.3448
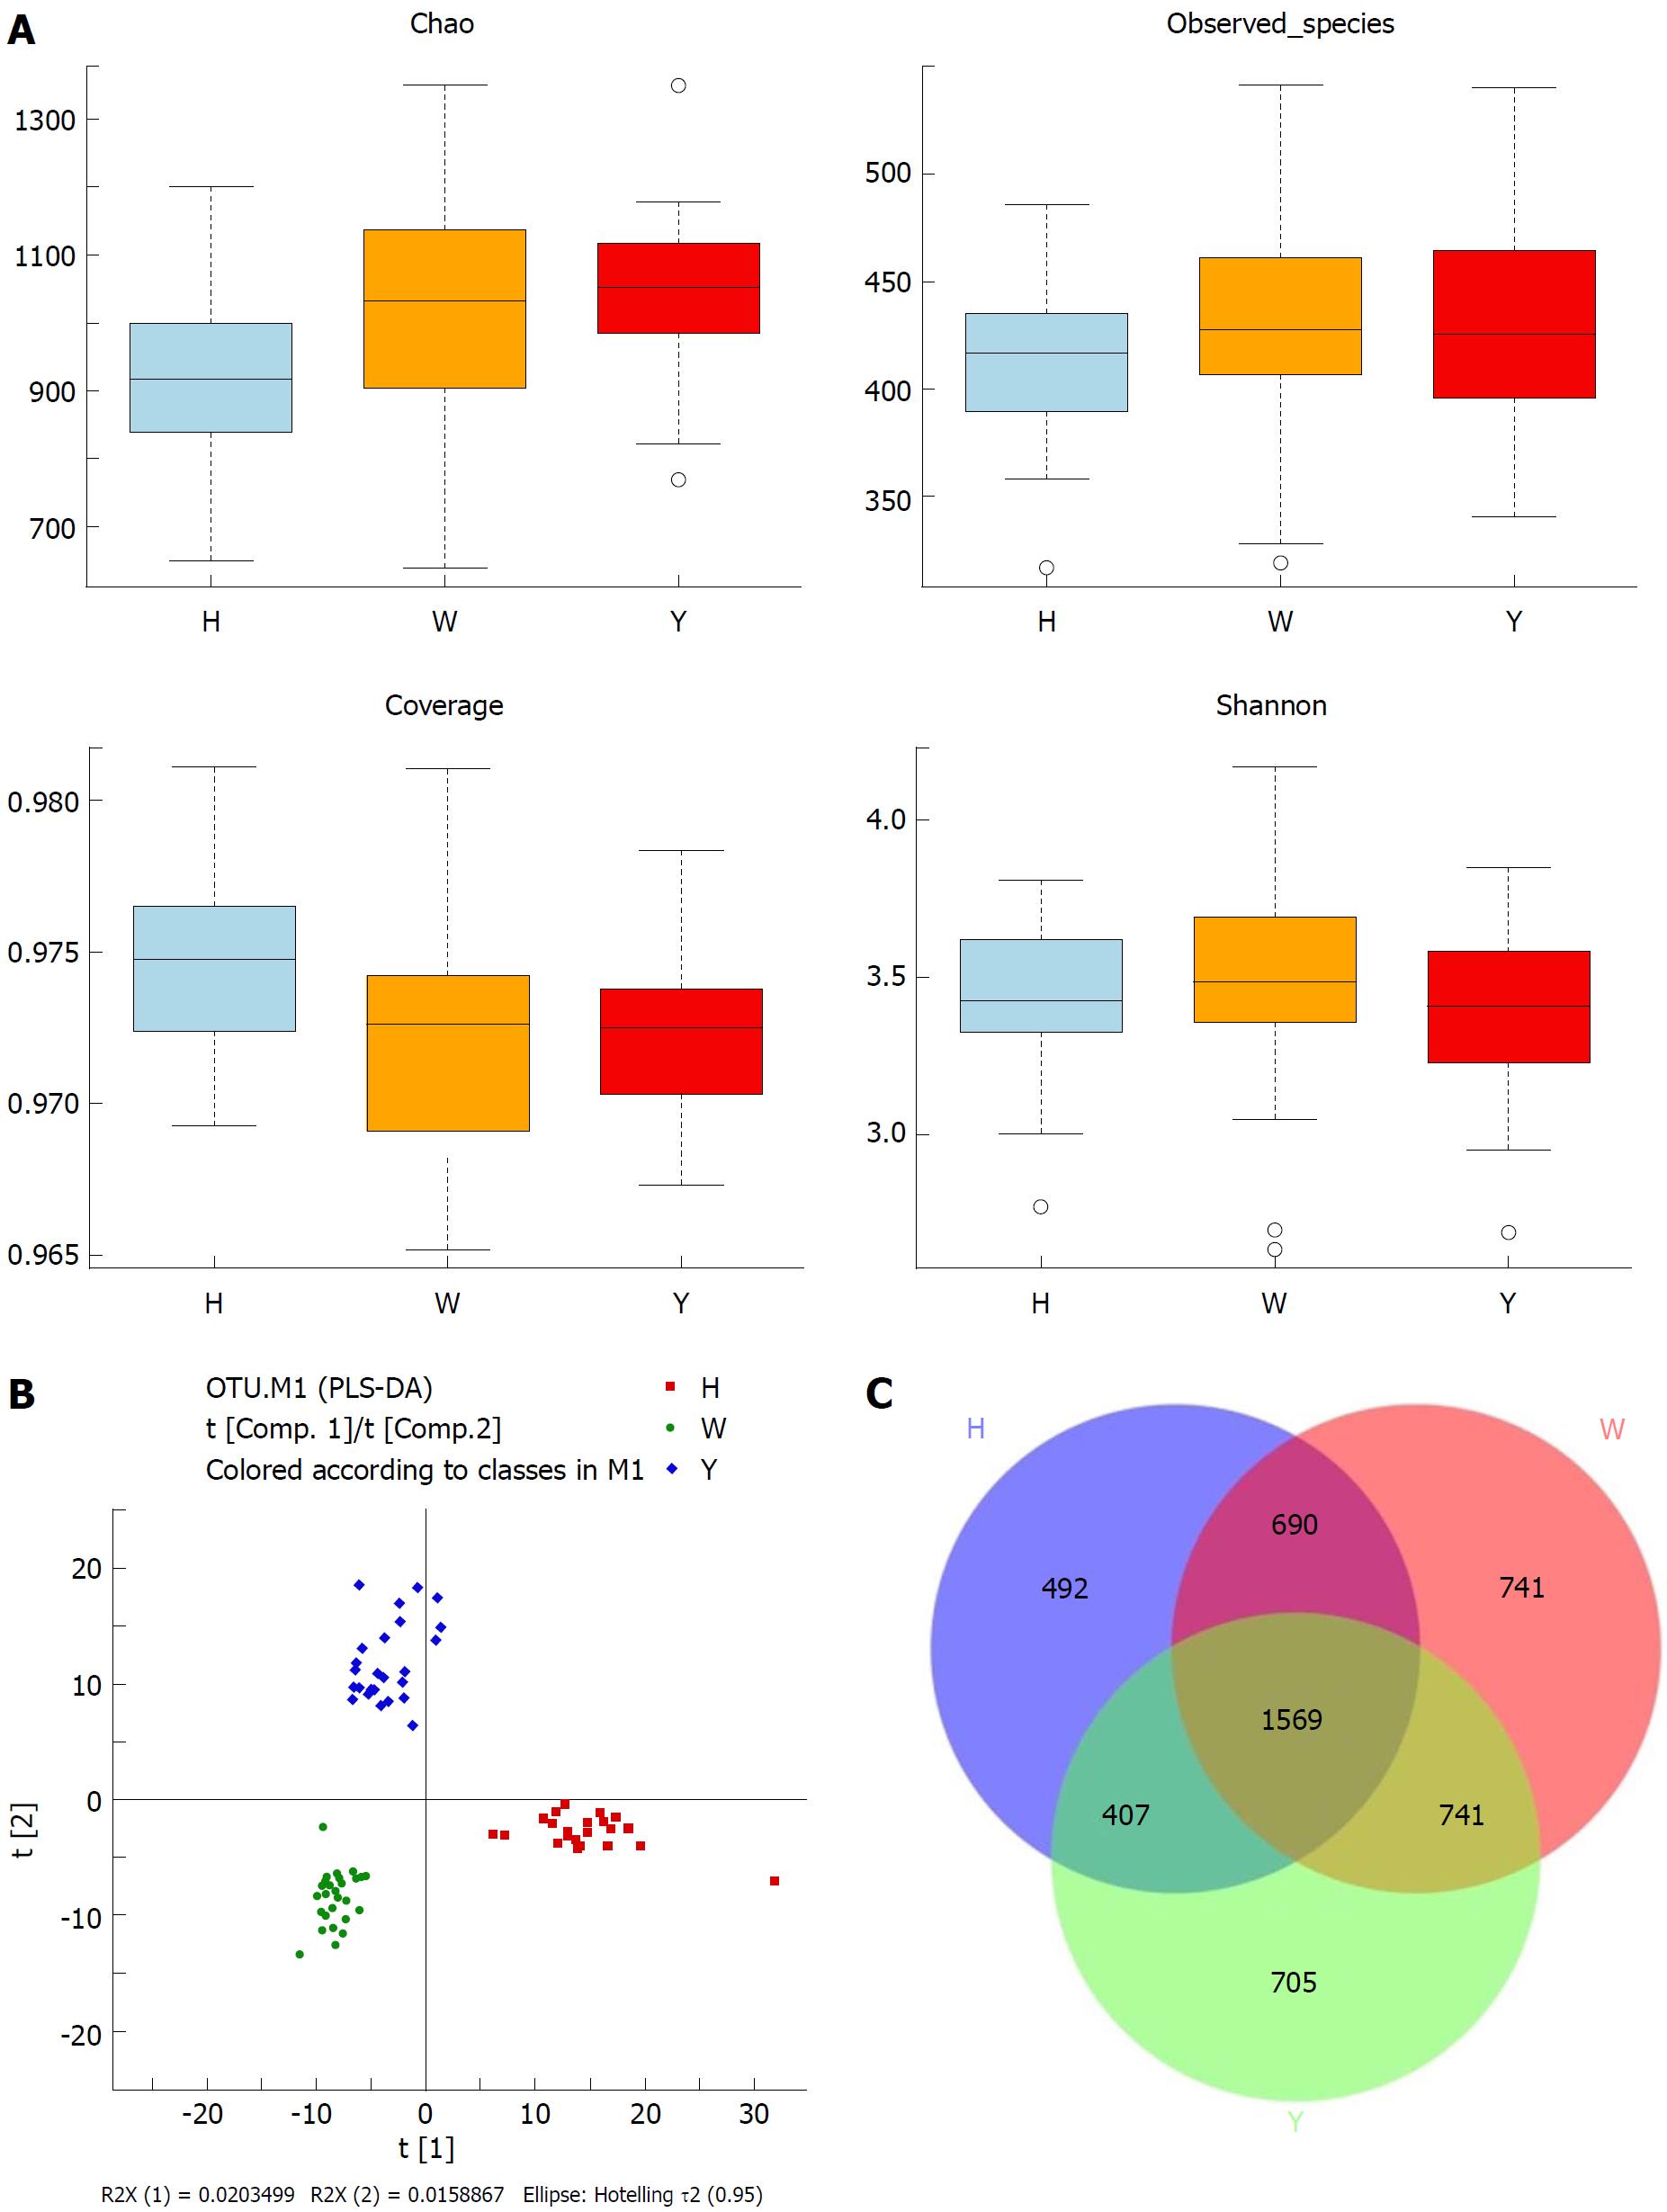
Figure 1 Overview of the tongue coating microbiota among groups.
A: Detailed characteristics of alpha diversity; B: PLS-DA discriminant analysis plot; C: Venn diagram based on OTUs. PLS-DA: Partial least squares-discriminant analysis; OTUs: Operational taxonomic units.
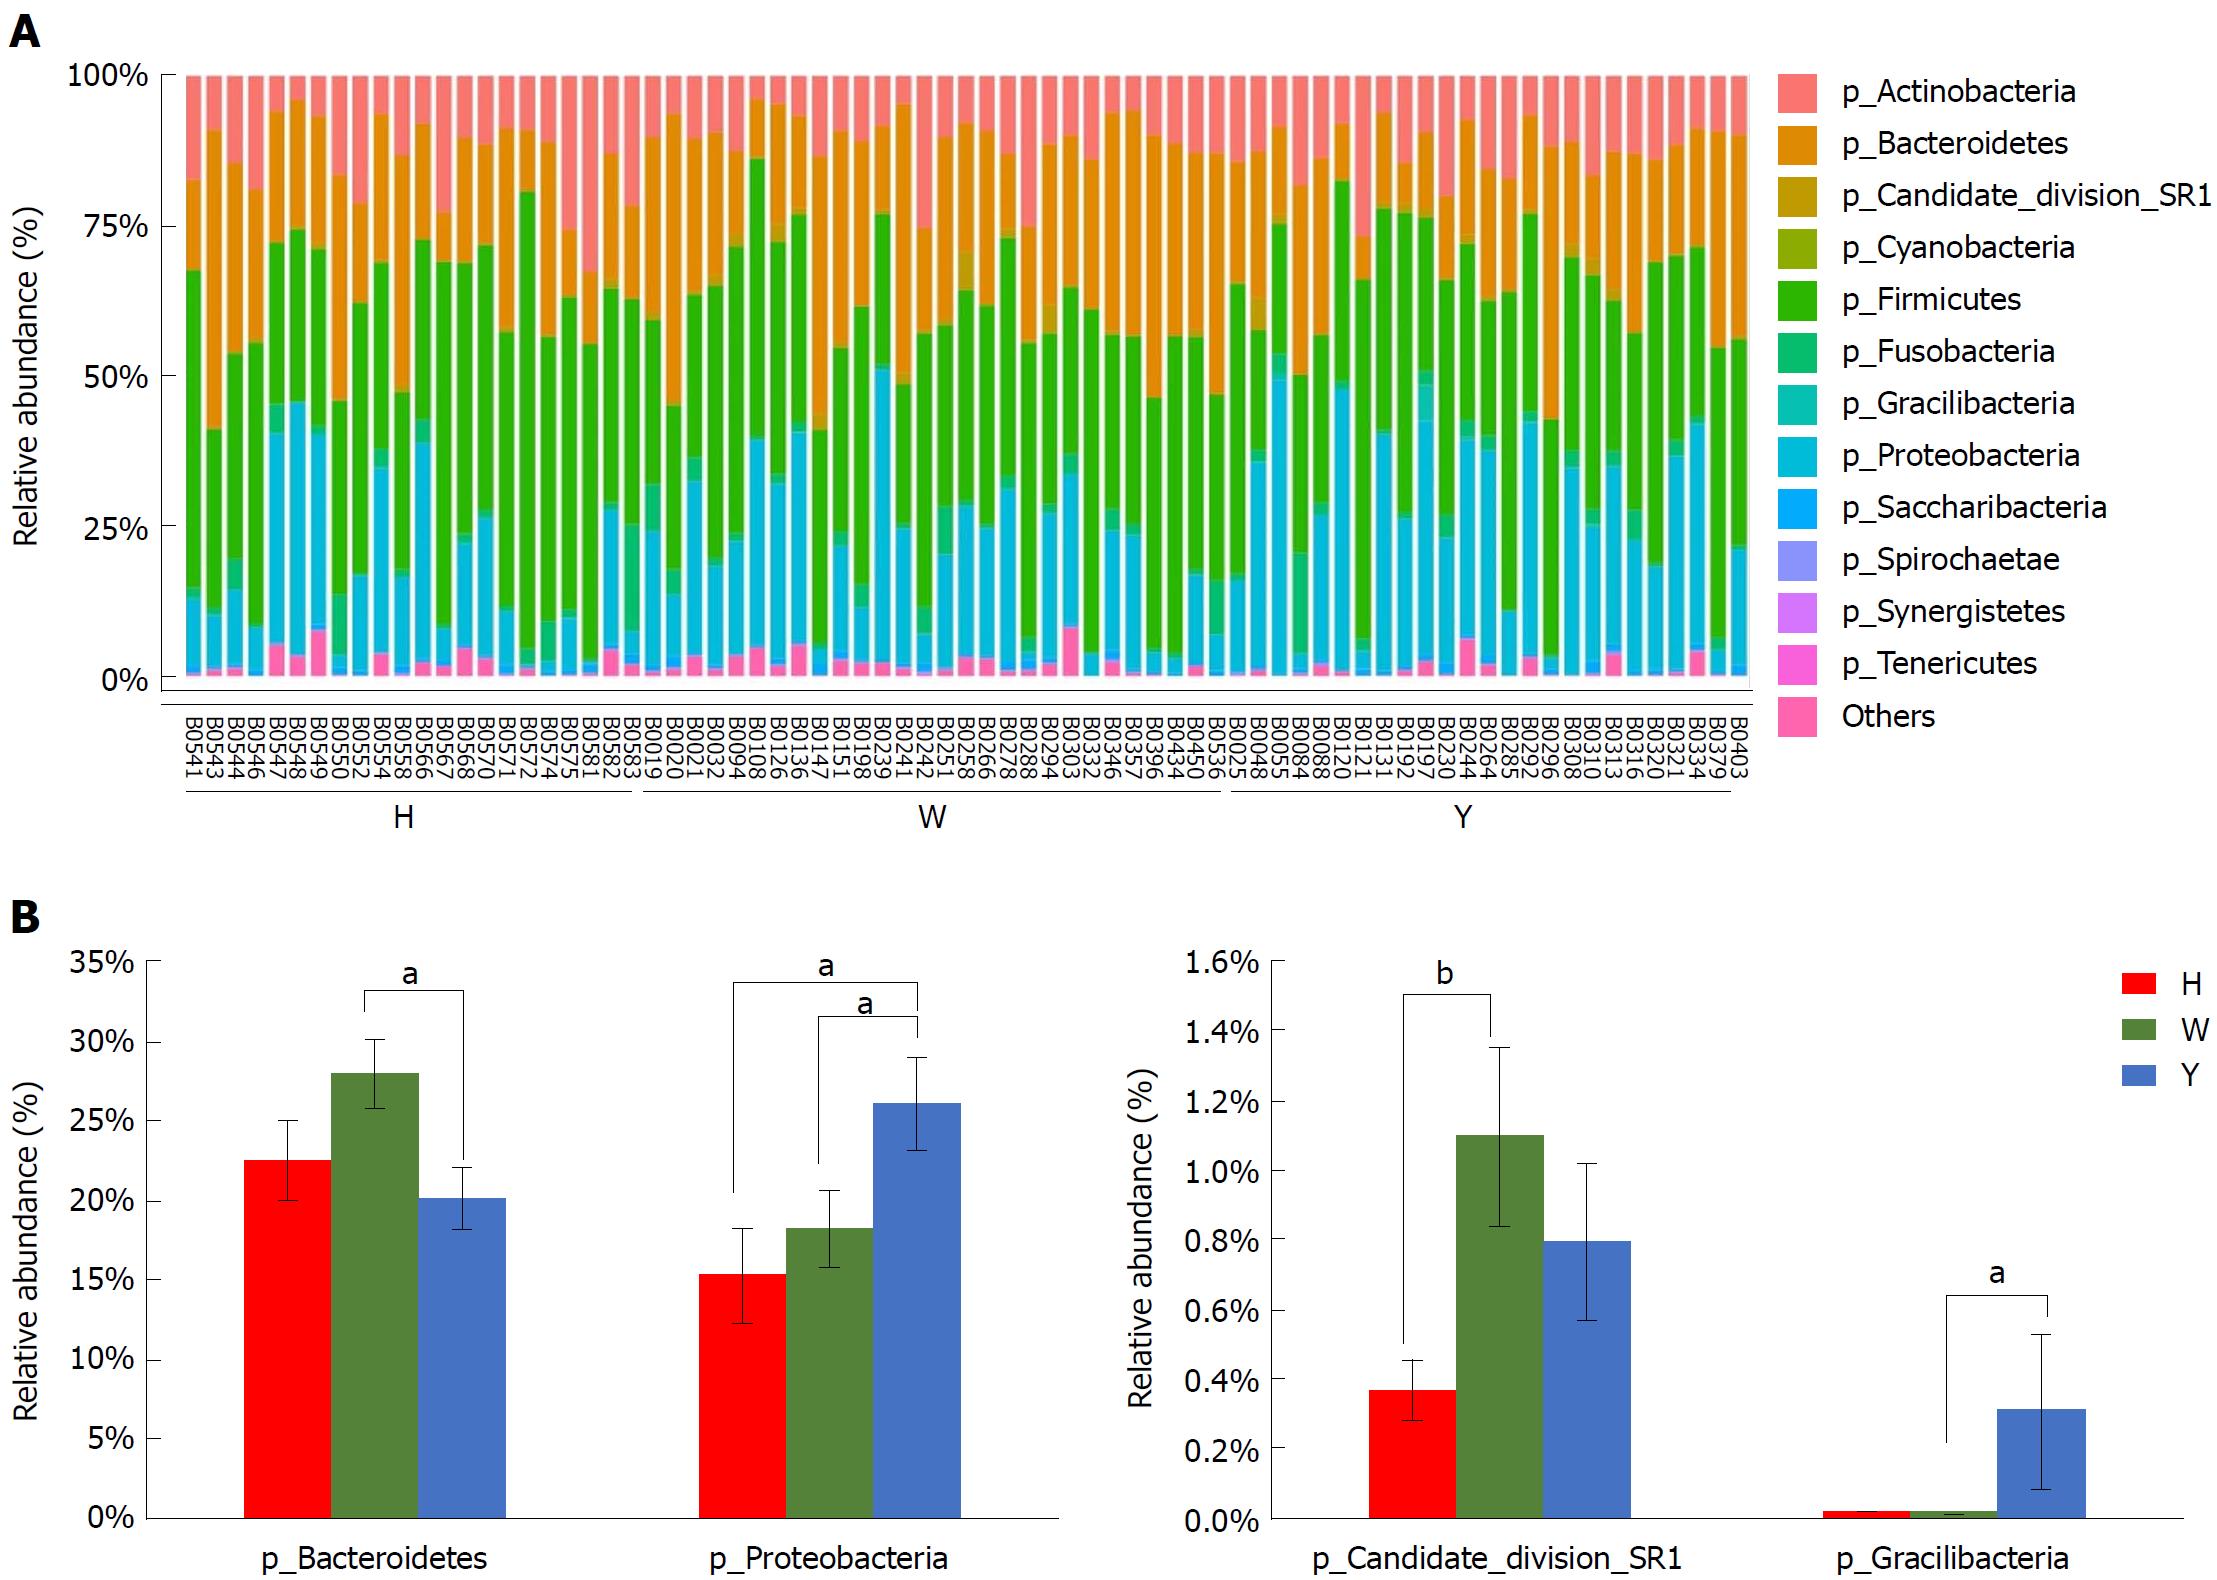
Figure 2 Taxonomic classification of the tongue coating microbiota at the phylum level.
A: Taxonomic classification of the tongue-coating microbiota at the phylum level; B: Metastats analysis of differences in the relative proportions difference at the phylum level. aP < 0.05, bP < 0.01.
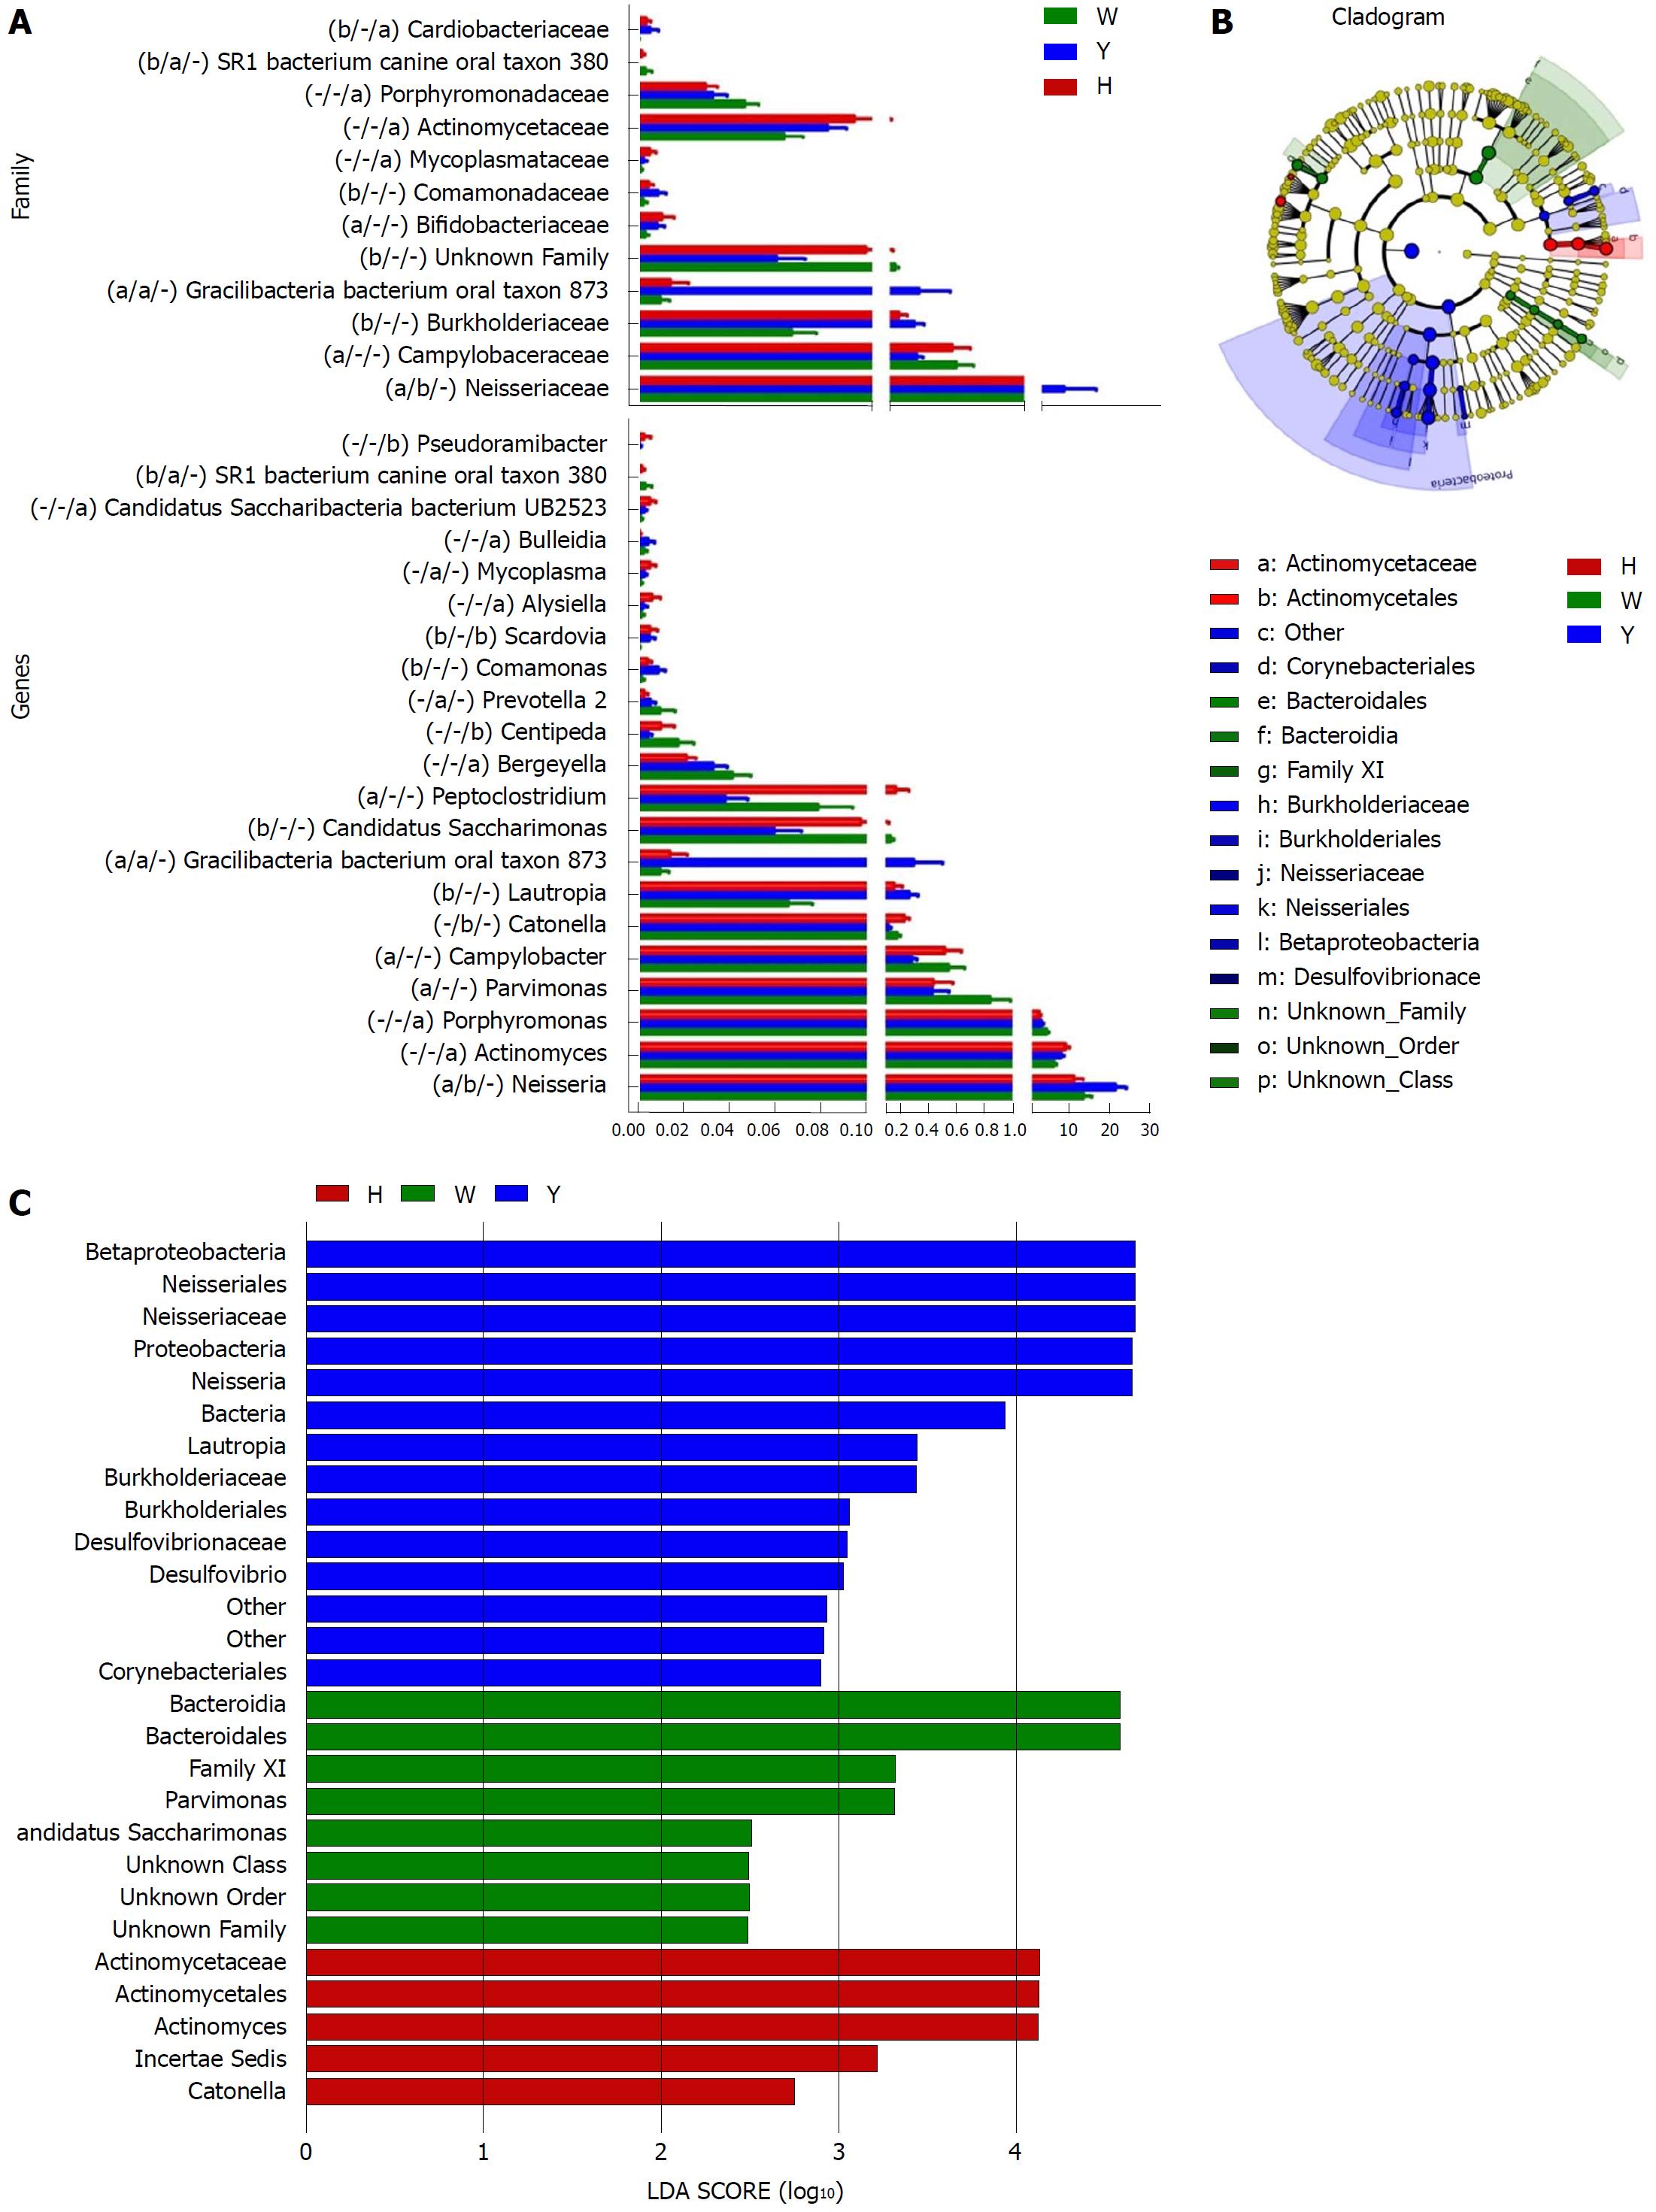
Figure 3 The most differentially abundant taxa in the chronic hepatitis B yellow and white tongue coating patients.
A: Comparison of the relative abundance at the bacterial family and genus levels, the marks of significance from left to right in parentheses are the CHB yellow tongue coating patients vs the healthy controls, the CHB yellow tongue coating patients vs the CHB white tongue coating patients and the CHB white tongue coating patients vs the healthy controls. aP < 0.05, bP < 0.01, “−” indicates no significant difference based on the Metastats analysis; B: Taxonomic cladogram of the LEfSe analysis of the 16S sequences. (Red) healthy-control enriched taxa; (Green) CHB white tongue coating patients-enriched taxa; and (Blue) CHB yellow tongue coating patients-enriched taxa. C: LDA scores of enriched taxa in the healthy controls (Red), CHB white tongue coating patients (Green) and CHB yellow tongue coating patients (Blue). LDA: Linear discriminant analysis.
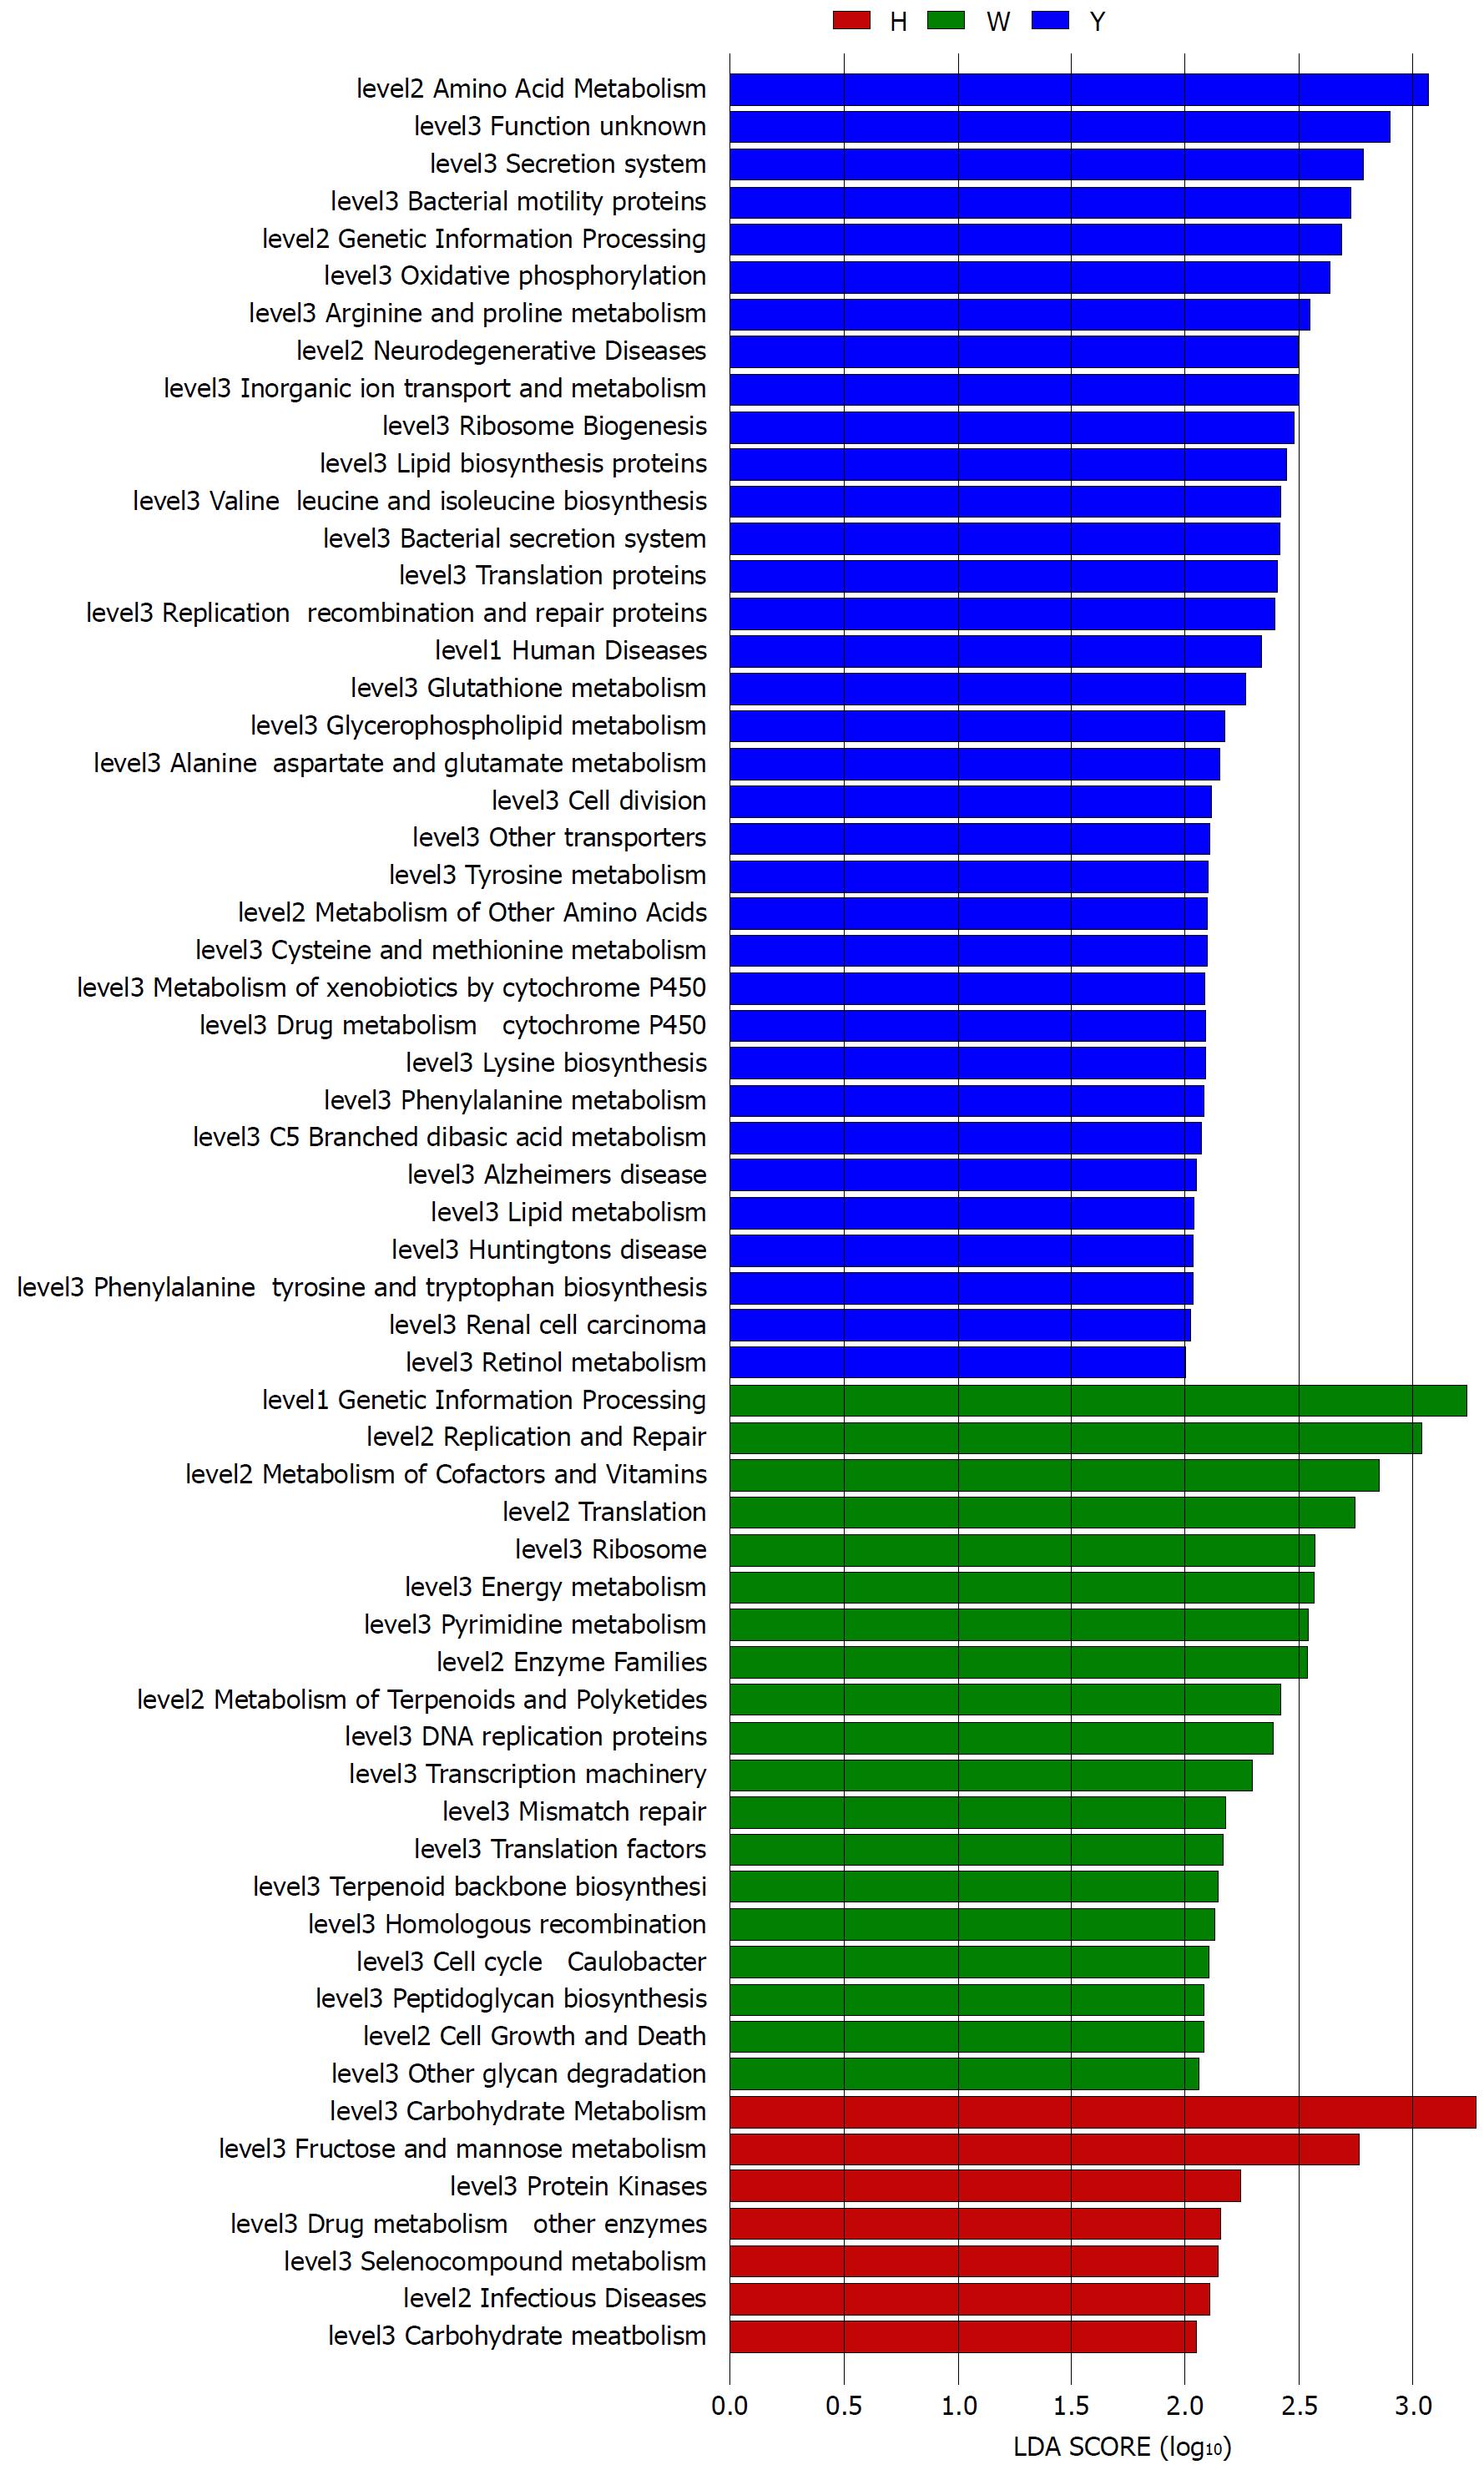
Figure 4 Linear discriminant analysis scores of the enriched microbial functions in the healthy-controls (Red), chronic hepatitis B white tongue coating patients (Green) and chronic hepatitis B yellow tongue coating patients (Blue).
LDA: Linear discriminant analysis.
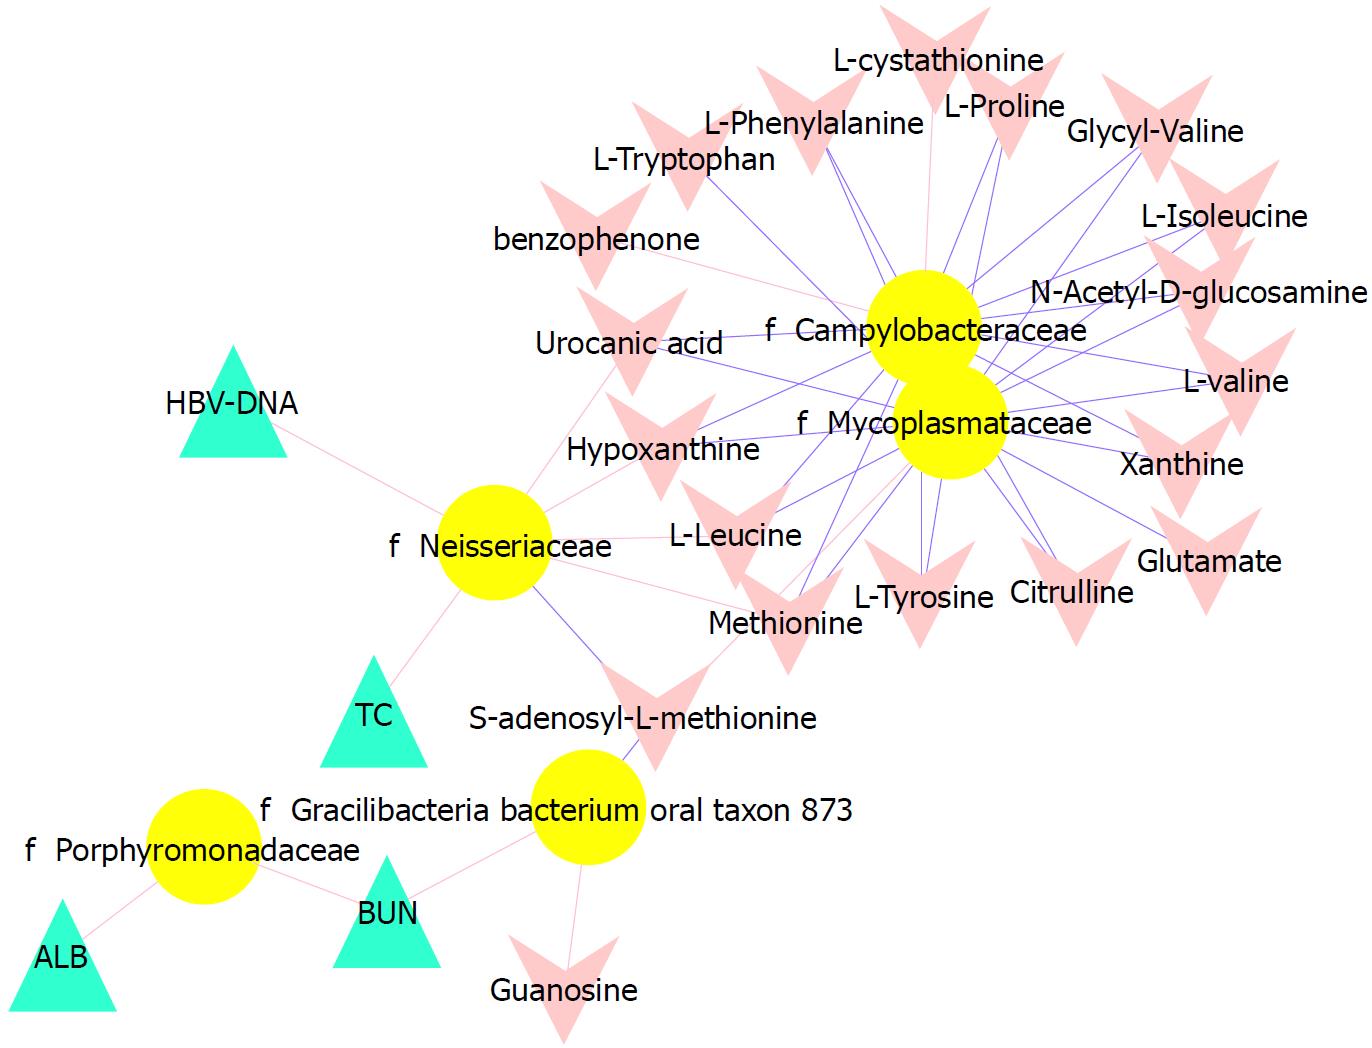
Figure 5 Associations of the tongue coating microbiotas with metabolites and clinical indices.
Correlations were detected, and the indices with Spearman’s correlation coefficients > 0.3 were visualized in Cytoscape. Triangles represent clinical indicators, arrows represent metabolites and dots represent oral microbial families. If the correlations are negative, the connecting line is blue; if the correlation is positive, the connecting line is red. The line thickness represents the size of the correlation coefficient.
- Citation: Zhao Y, Mao YF, Tang YS, Ni MZ, Liu QH, Wang Y, Feng Q, Peng JH, Hu YY. Altered oral microbiota in chronic hepatitis B patients with different tongue coatings. World J Gastroenterol 2018; 24(30): 3448-3461
- URL: https://www.wjgnet.com/1007-9327/full/v24/i30/3448.htm
- DOI: https://dx.doi.org/10.3748/wjg.v24.i30.3448


