Copyright
©The Author(s) 2018.
World J Gastroenterol. Aug 14, 2018; 24(30): 3426-3439
Published online Aug 14, 2018. doi: 10.3748/wjg.v24.i30.3426
Published online Aug 14, 2018. doi: 10.3748/wjg.v24.i30.3426
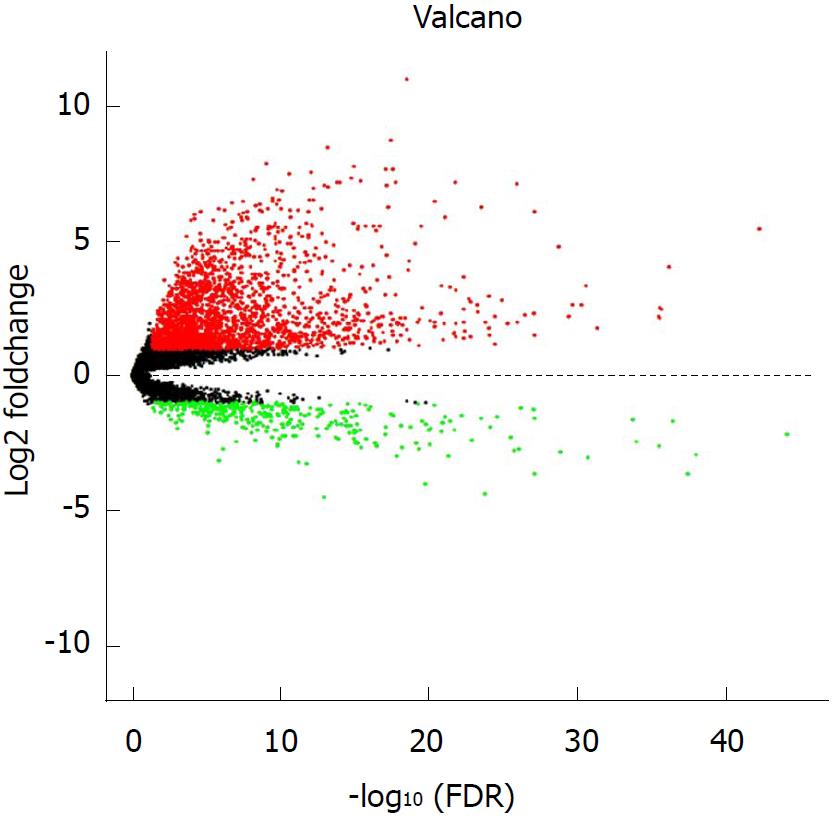
Figure 1 Volcano plot of the differentially expressed long non-coding RNAs between hepatocellular carcinoma tumor specimens and peritumoral liver specimens.
The X-axis represents the adjusted FDR, and the Y-axis represents the value of the log2 fold change. Aberrantly expressed long non-coding RNAs (lncRNAs) were calculated using the EdgeR package. Red dots represent upregulated lncRNAs in the hepatocellular carcinoma (HCC) tumor specimens, while green dots indicate downregulated lncRNAs compared with the peritumoral liver specimens. Black dots show the lncRNAs without significant differences between the HCC tumor and peritumoral liver specimens. Altogether, 2240 upregulated and 353 downregulated lncRNAs were found. This volcano plot was conducted using the ggplot2 package of R language.
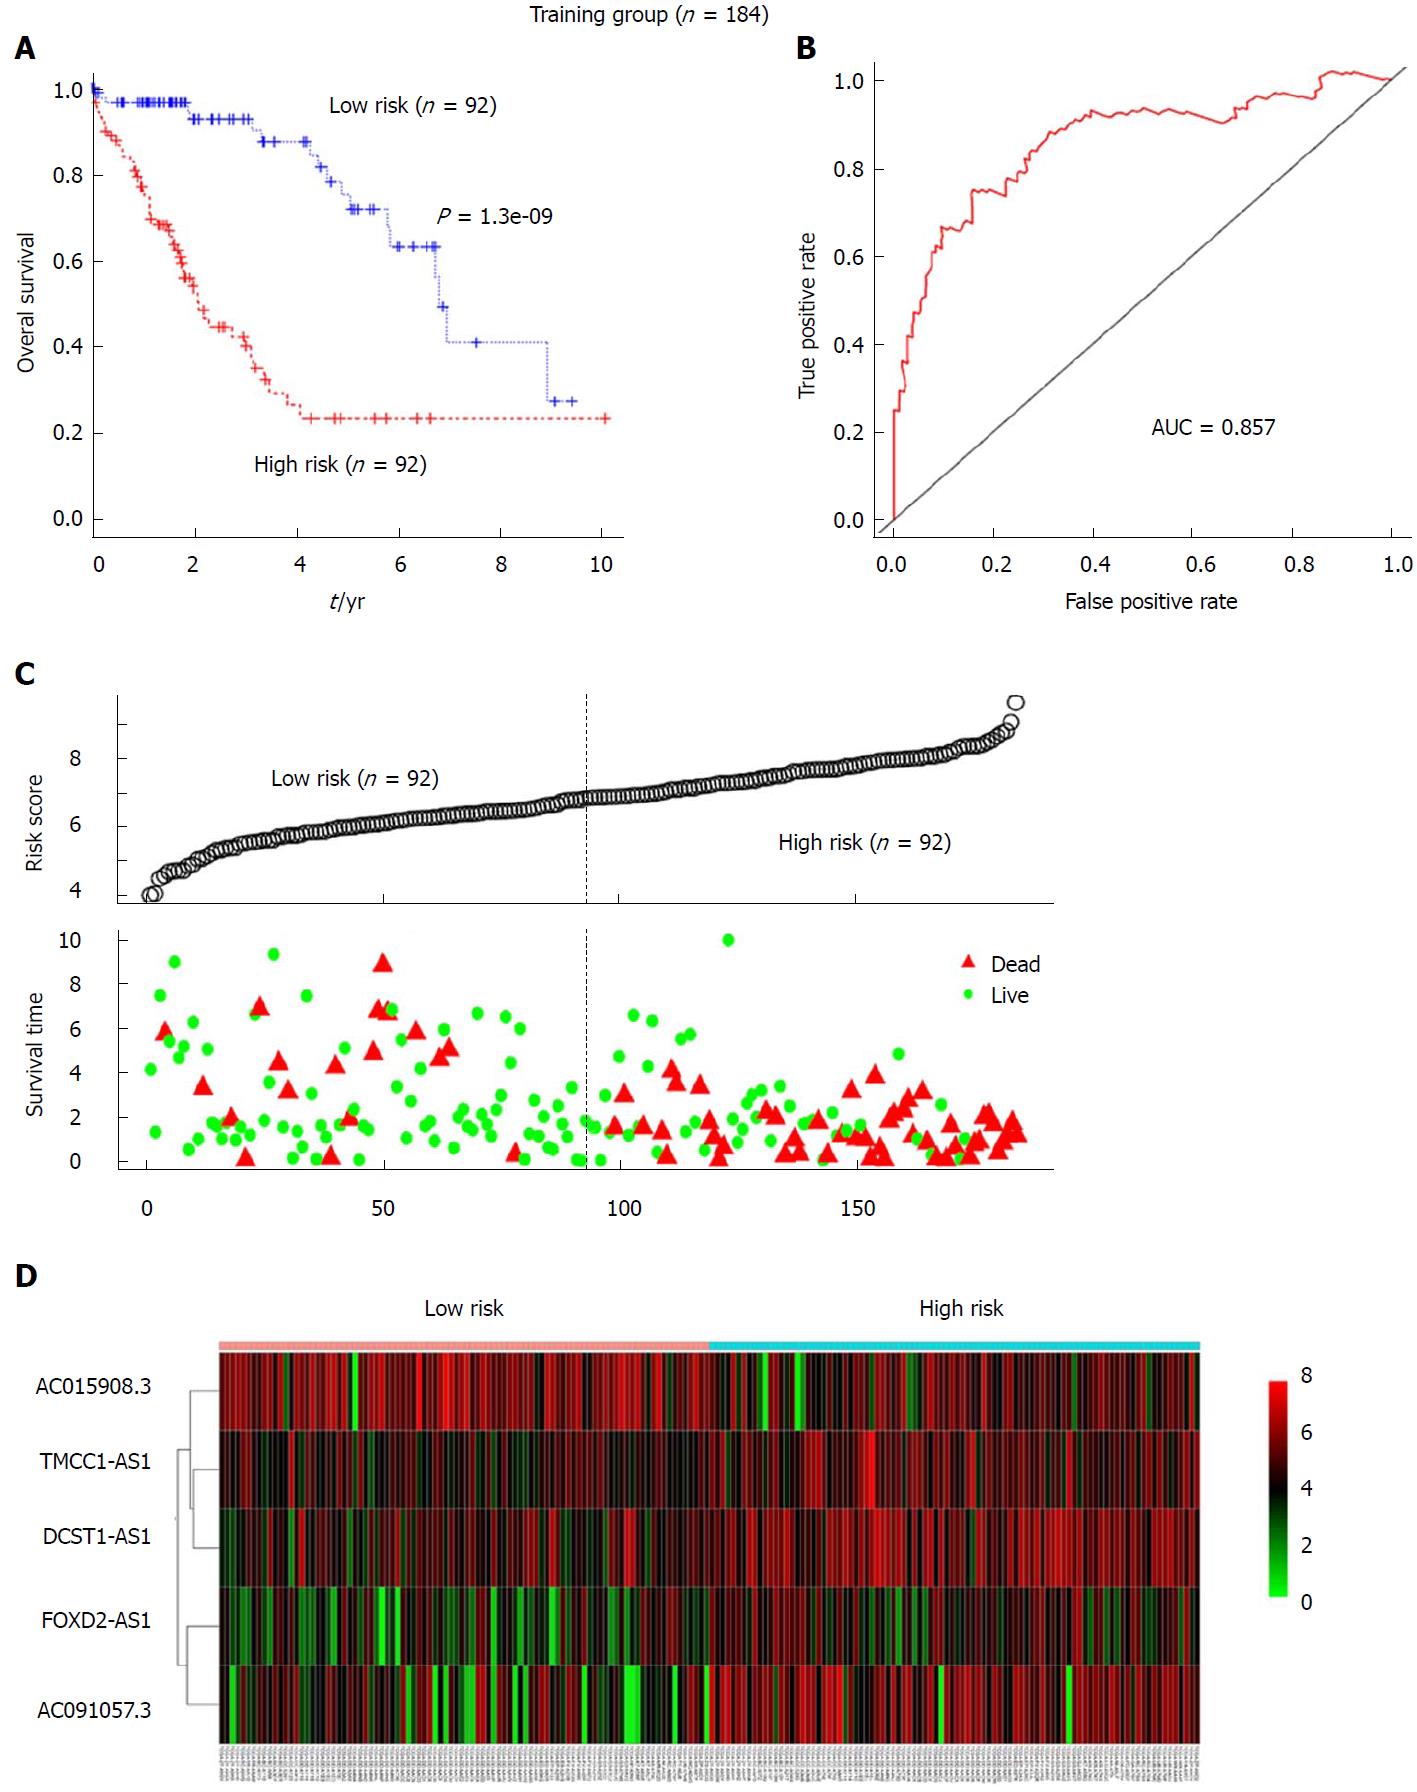
Figure 2 The 5-long non-coding RNA signature-based risk score predicted the overall survival of patients with hepatocellular carcinoma in the training set (n = 184).
A: Kaplan-Meier analysis of patients’ overall survival in the high-risk (n = 92) and low-risk (n = 92) subgroups of the training set; B: The receiver operating characteristic (ROC) analysis of the risk score for prediction the overall survival of the training set. The area under the curve was calculated for ROC curves; C: The 5-lncRNA-based risk score distribution, patient survival status; D: Heatmap of the 5-lncRNA expression profiles in the high-risk and low-risk subgroups for the training set.
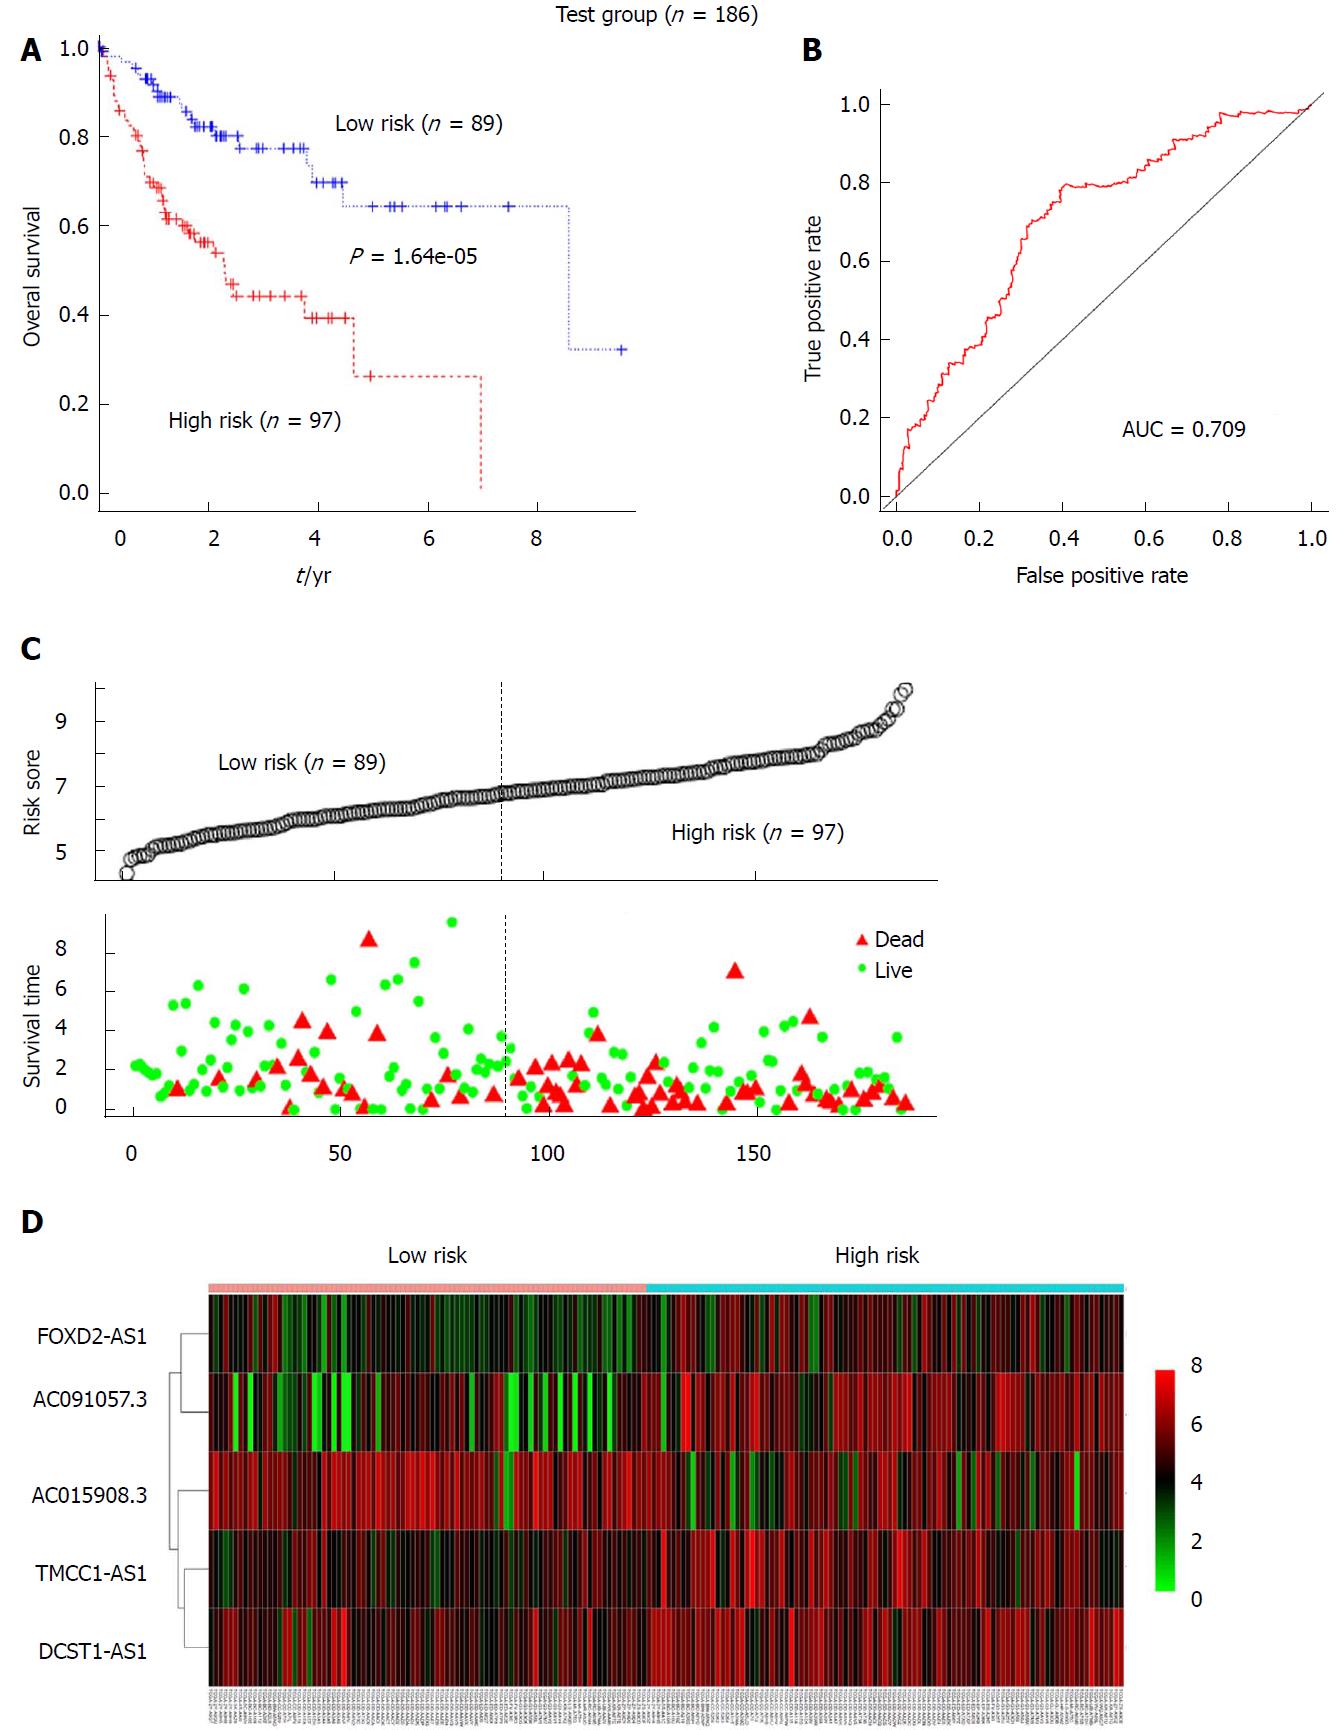
Figure 3 Validation of the prognostic value of the 5-long non-coding RNA signature for the hepatocellular carcinoma patients in the test group.
A: Kaplan-Meier analysis indicated that patients in the high-risk (n = 97) subgroup exhibited significantly poorer survival than the low-risk subgroup (n = 89) in the test group; B: The receiver operating characteristic analysis of the risk score for predicting the overall survival of the test set; C: The 5-long non-coding RNA (lncRNA)-based risk score distribution, patient survival status; D: Heatmap of the 5-lncRNA expression profiles in the high-risk and low-risk subgroups of the test set.
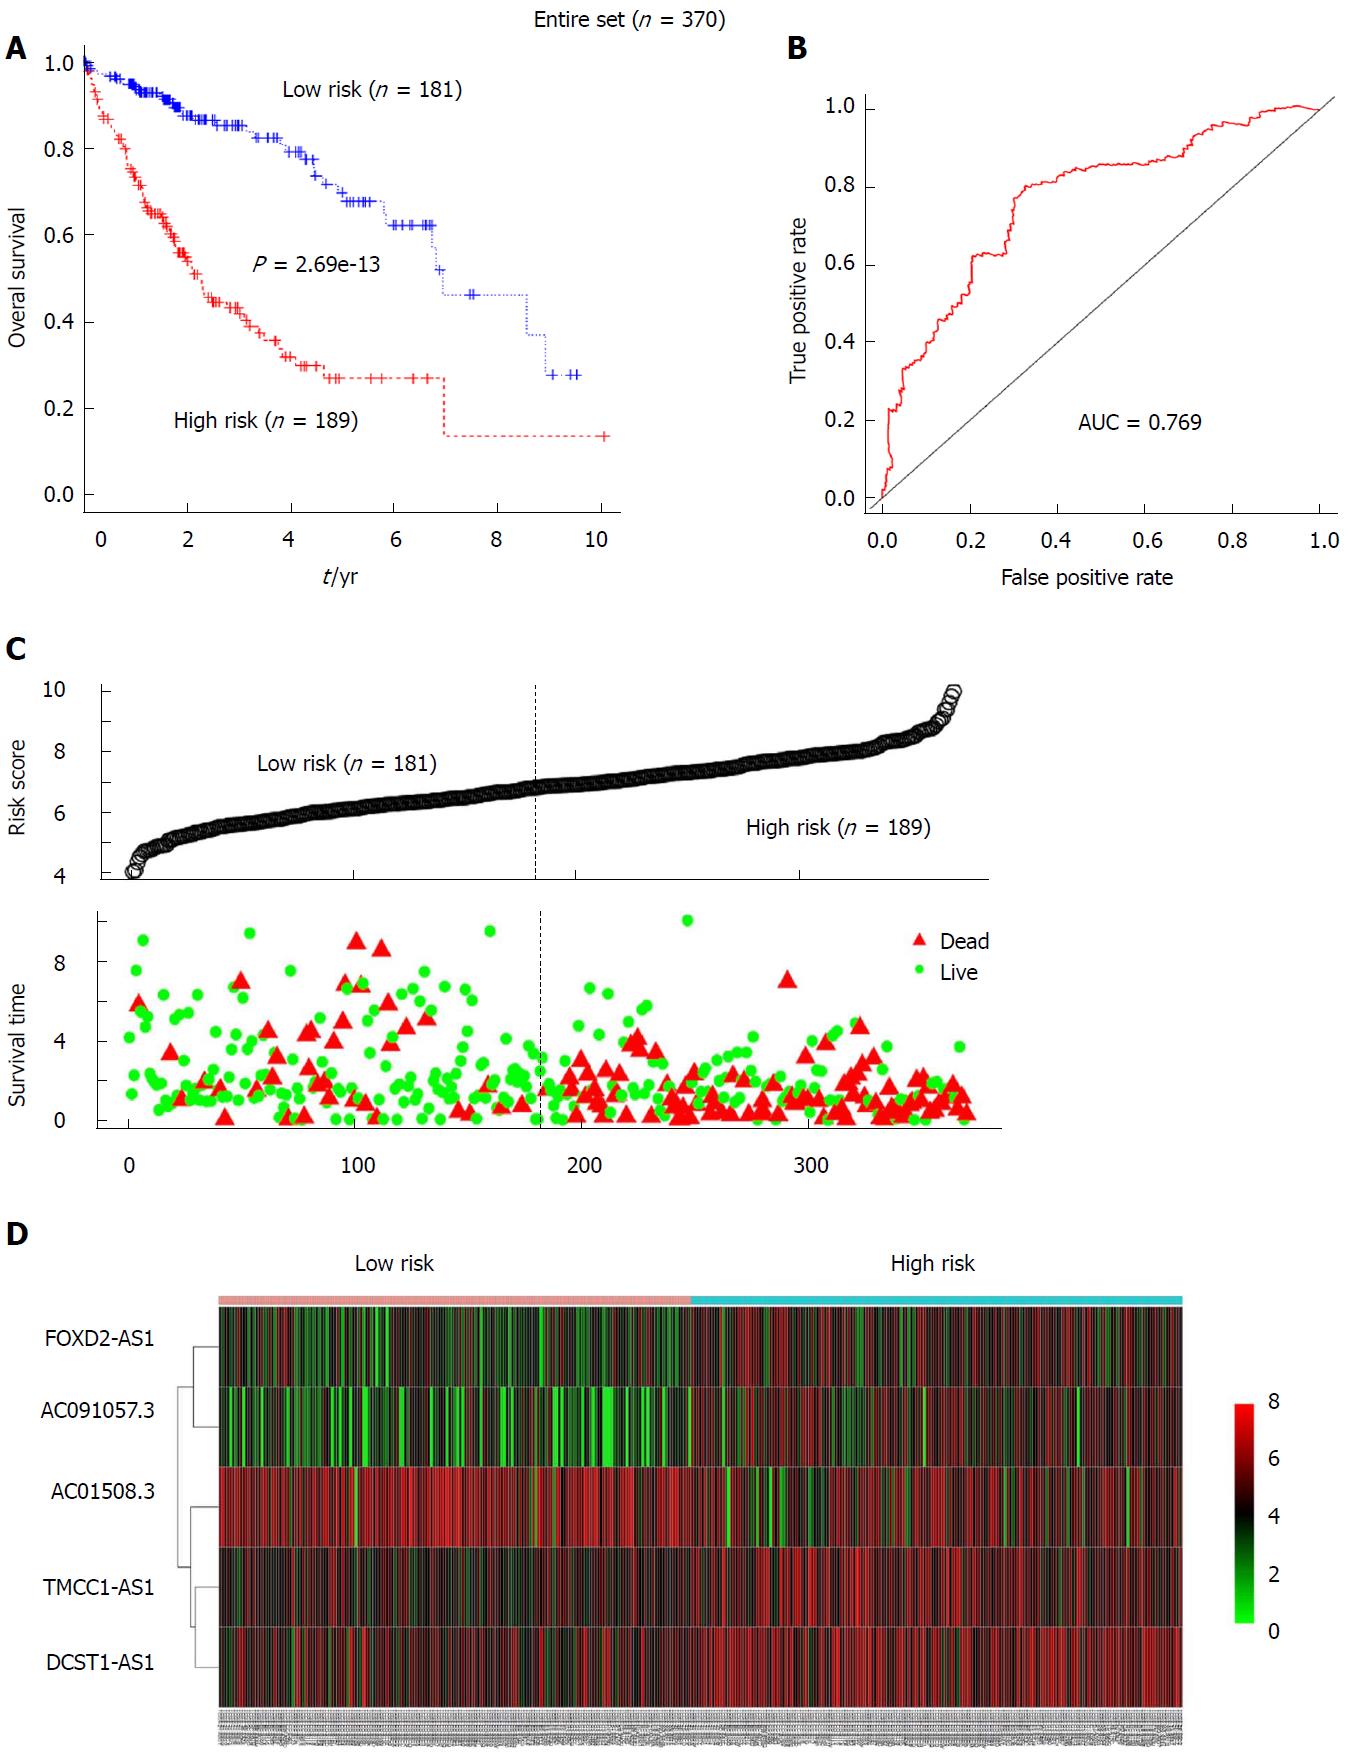
Figure 4 The prognostic value of the 5-long non-coding RNA signature for the hepatocellular carcinoma patients in the entire set (n = 370).
A: Kaplan-Meier analysis of patients’ overall survival in the high-risk (n = 189) and low-risk subgroups (n = 181) for the entire set; B: The receiver operating characteristic analysis of the risk score for predicting the overall survival of the test set; C: The 5-long non-coding RNA (5-lncRNA)-based risk score distribution, patient survival status; D: Heatmap of the 5-lncRNA expression profiles in the high-risk and low-risk subgroups for the entire set.
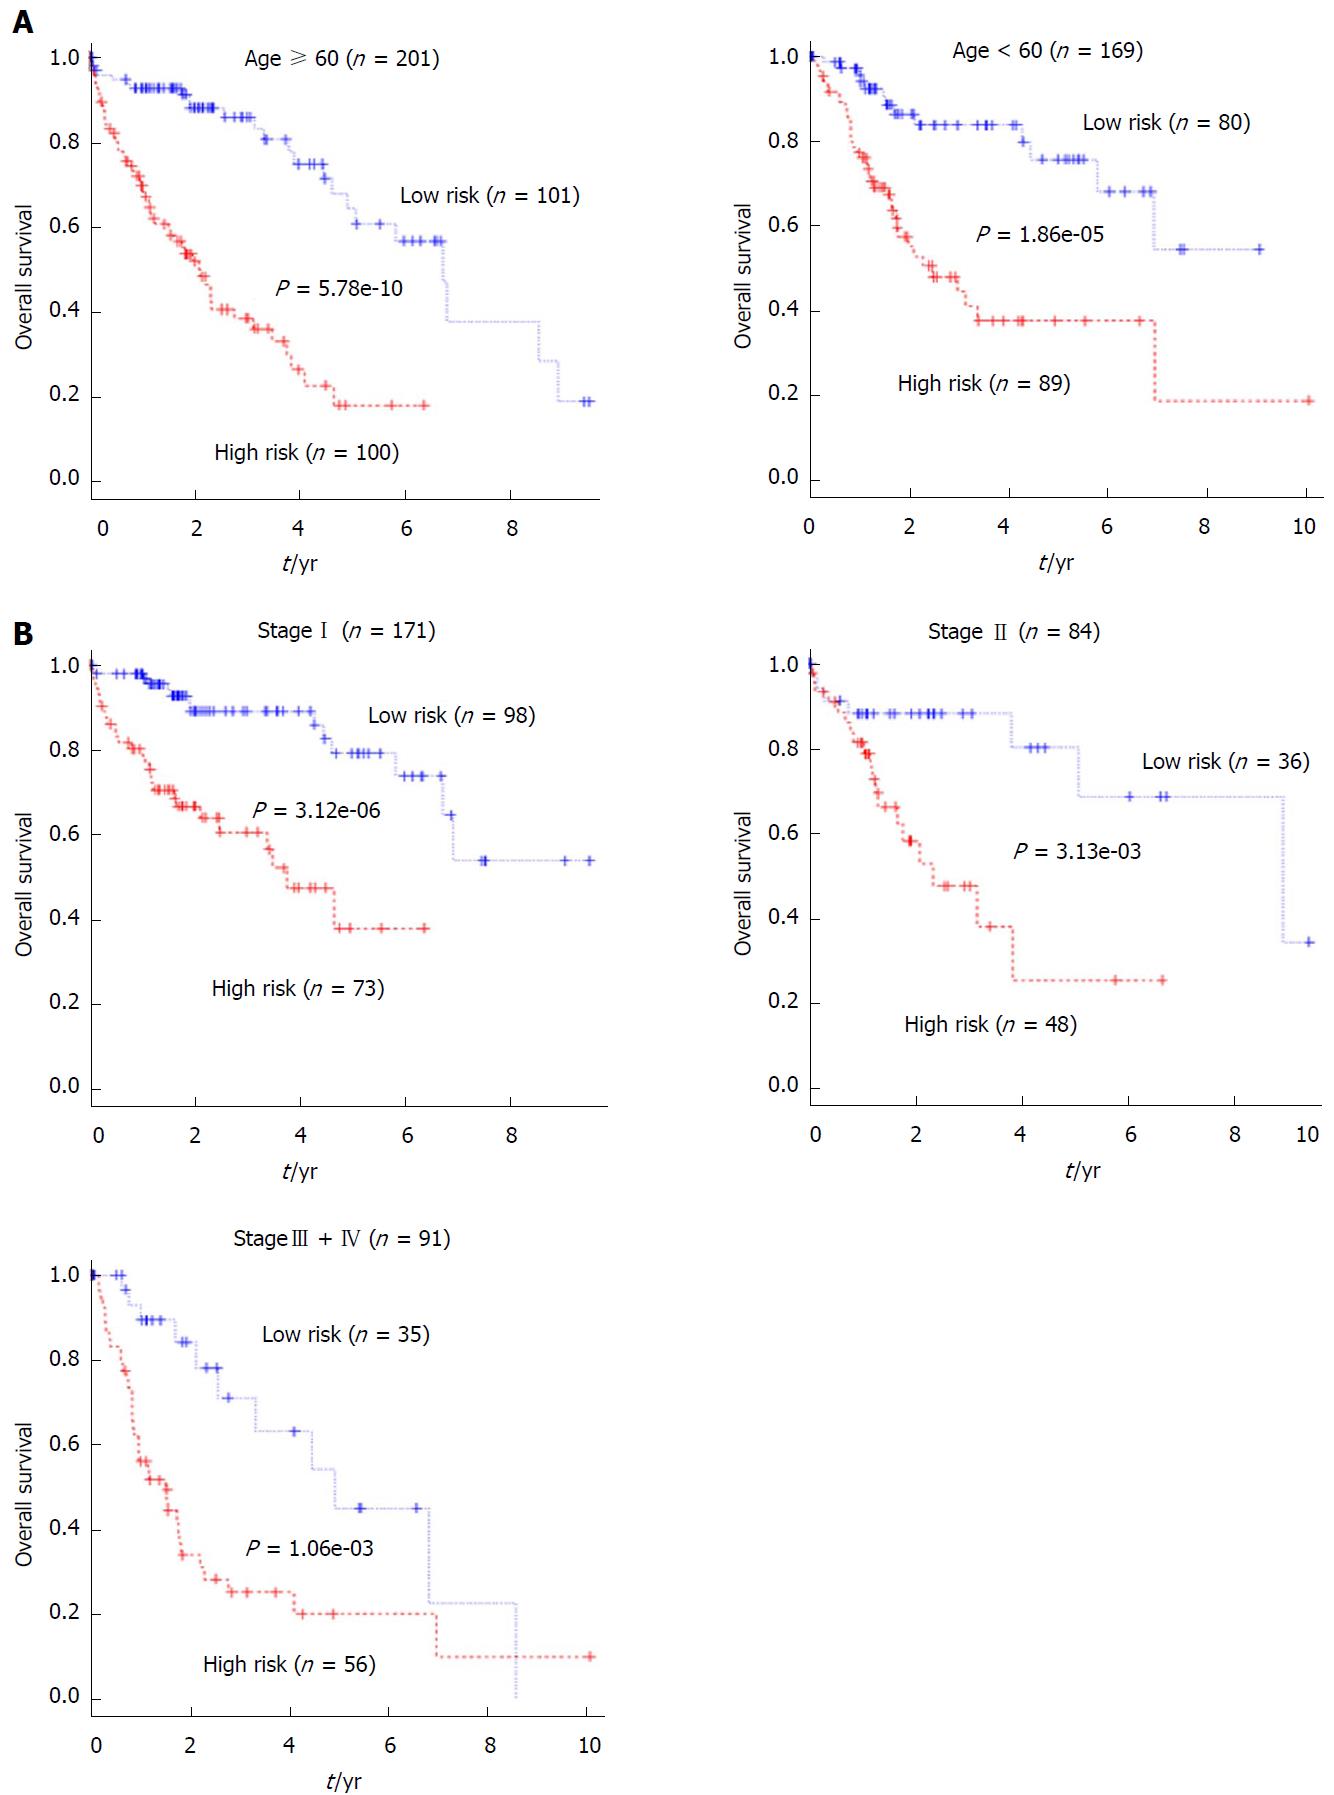
Figure 5 Stratification analyses of the prognostic value of the 5-long non-coding RNA signature-based risk score for all 370 hepatocellular carcinoma patients in the entire set.
A: Kaplan-Meier analysis of the overall survival of hepatocellular carcinoma patients < 60 or ≥ 60 years old; B: Kaplan-Meier analysis of the overall survival of patients with different pathological stages.
Figure 6 Comparison of the sensitivity and specificity for hepatocellular carcinoma survival prediction by the 5-long non-coding RNA signature and two existing signatures in the entire set.
A: Kaplan-Meier analysis of patients’ overall survival in the high-risk (n = 185) and low-risk (n = 185) subgroups based on the 3GeneSig in the entire set (left panel) and comparison of the survival difference based on the 5 long non-coding RNA (lncRNA) signature and the 3GeneSig by Kaplan-Meier analysis (right panel); B: Kaplan-Meier analysis of patients’ overall survival in the high-risk (n = 186) and low-risk (n = 184) subgroups based on the ZhongSig in the entire set (left panel) and comparison of the survival difference based on the 5 lncRNA signature and the ZhongSig (right panel); C: The ROC analysis of overall survival for the 5-lncRNA signature, ZhongSig and 3GeneSig.
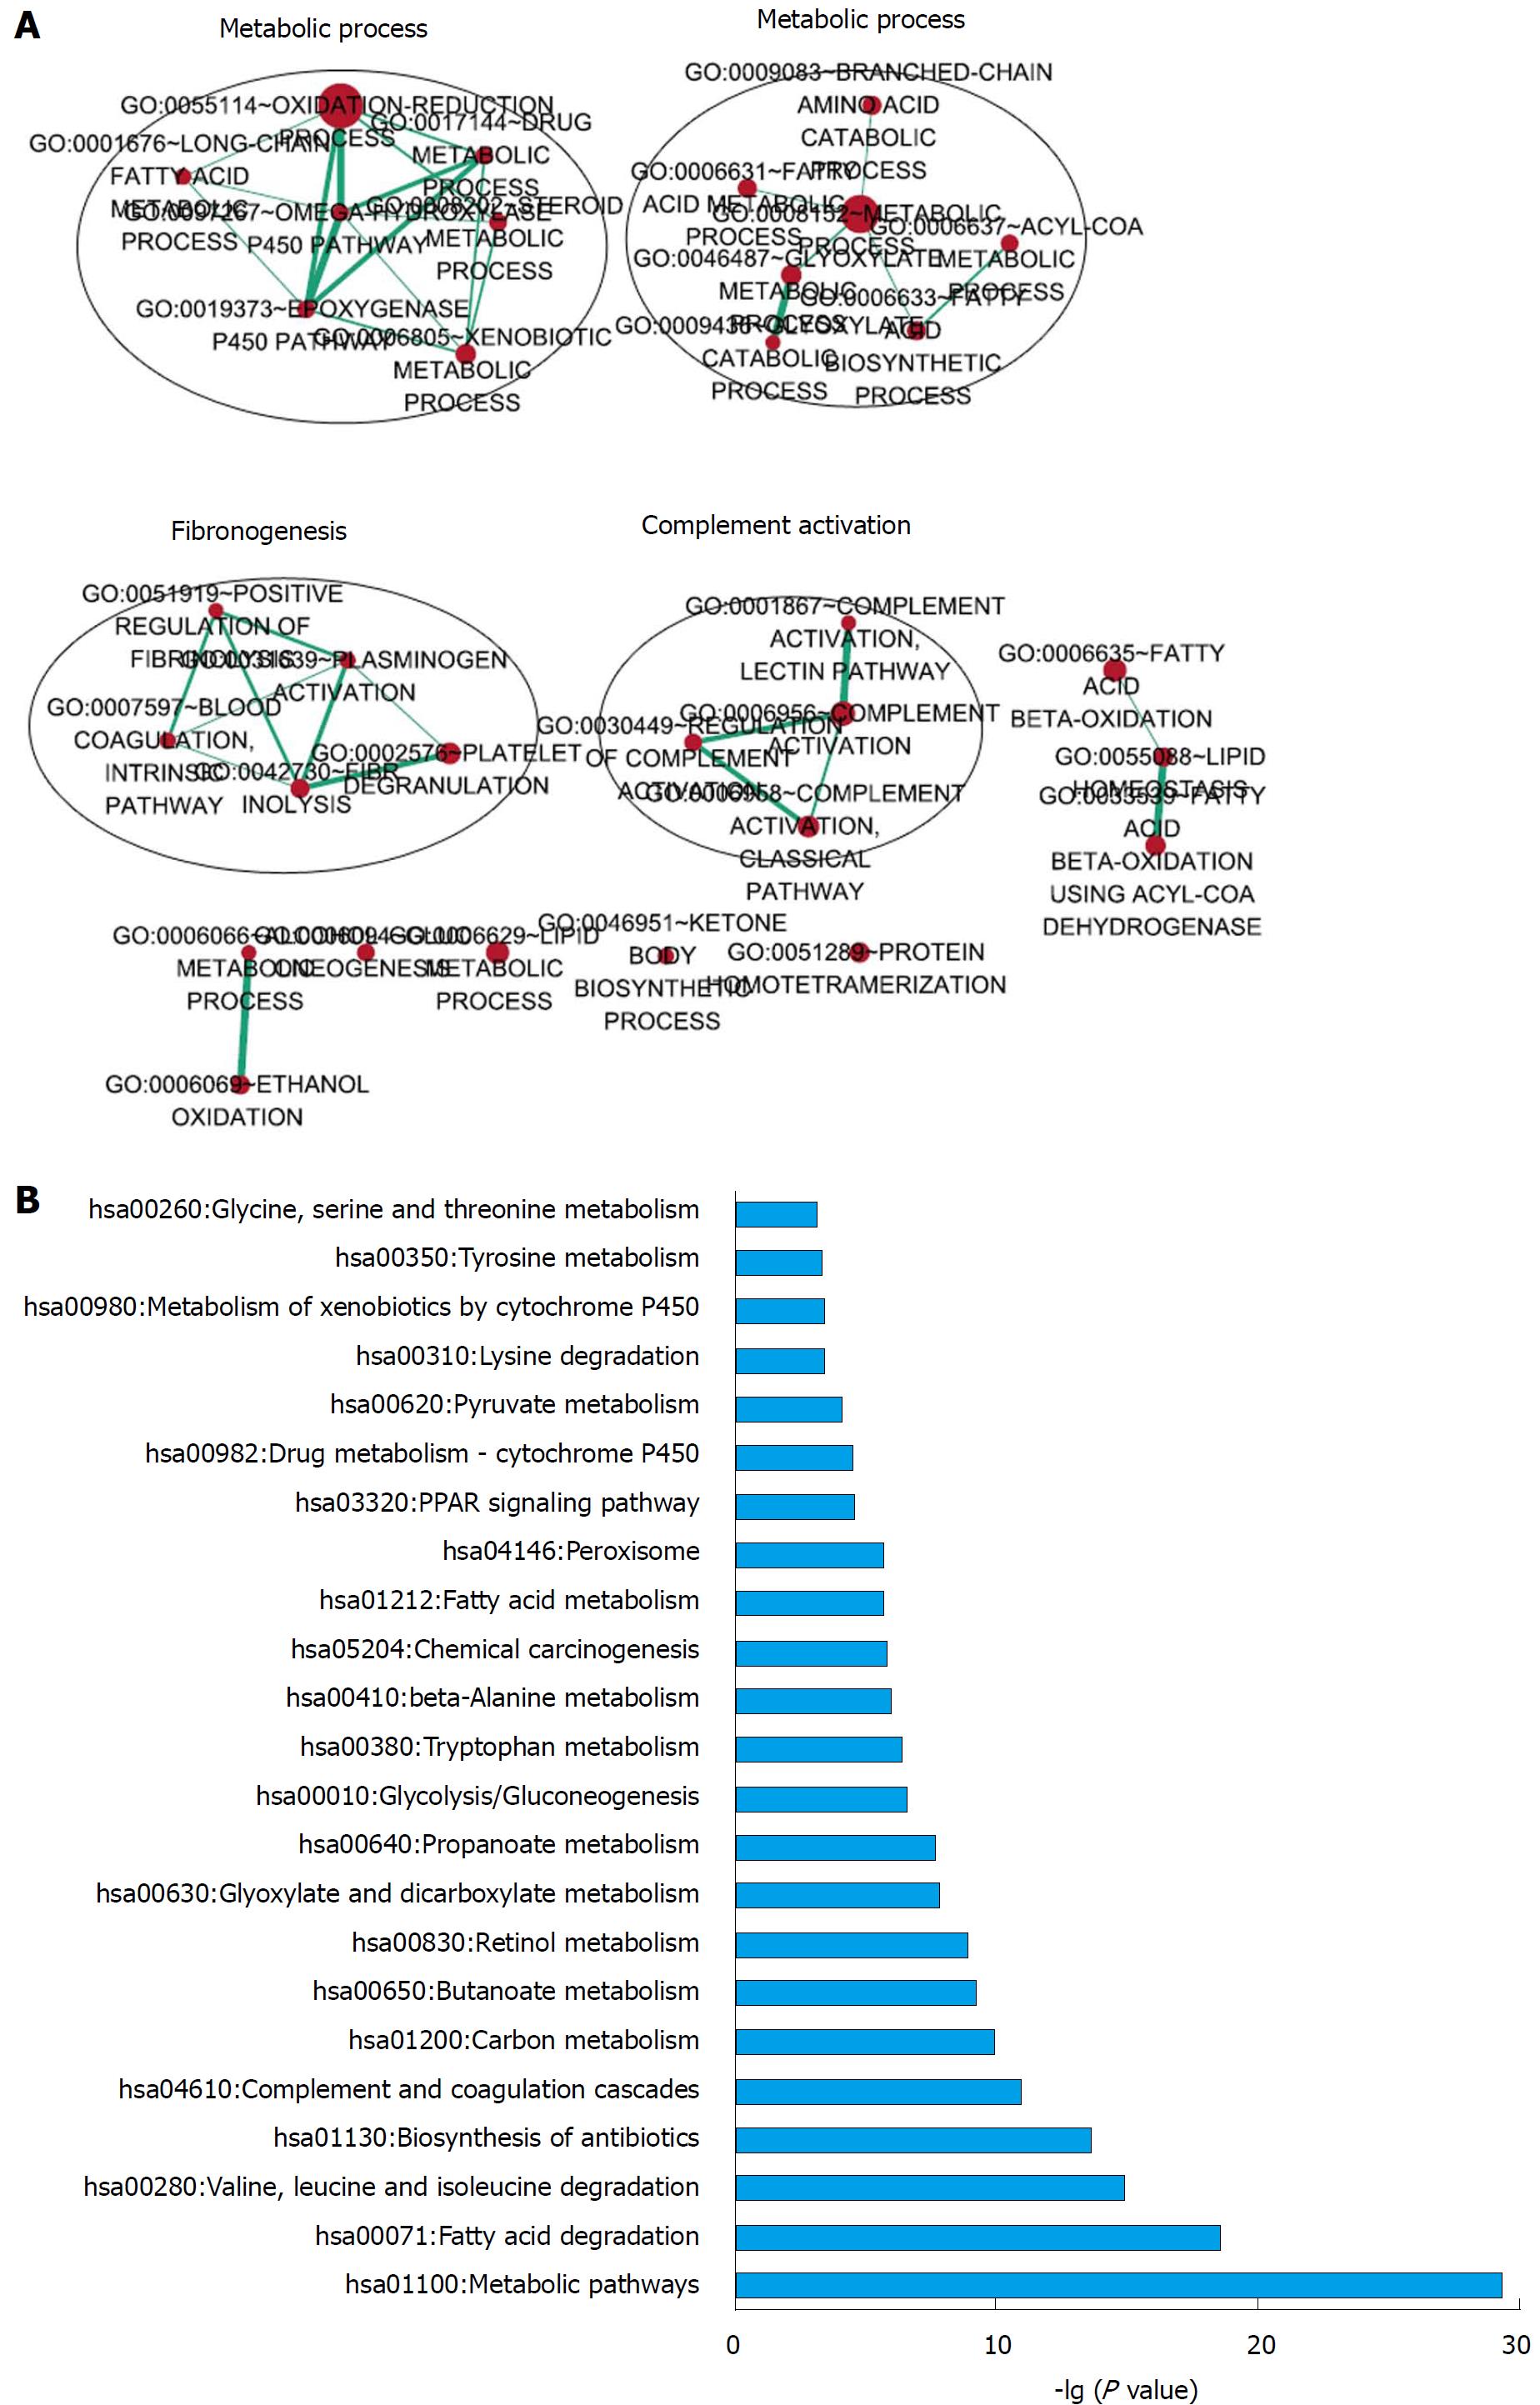
Figure 7 Functional enrichment analysis of the 5-long non-coding RNA based on their correlated protein-coding genes.
A: Functional enrichment map of significantly enriched gene ontology terms; B: KEGG pathways significantly associated with the correlated protein-coding genes.
- Citation: Zhao QJ, Zhang J, Xu L, Liu FF. Identification of a five-long non-coding RNA signature to improve the prognosis prediction for patients with hepatocellular carcinoma. World J Gastroenterol 2018; 24(30): 3426-3439
- URL: https://www.wjgnet.com/1007-9327/full/v24/i30/3426.htm
- DOI: https://dx.doi.org/10.3748/wjg.v24.i30.3426


