Copyright
©The Author(s) 2018.
World J Gastroenterol. Jul 7, 2018; 24(25): 2710-2721
Published online Jul 7, 2018. doi: 10.3748/wjg.v24.i25.2710
Published online Jul 7, 2018. doi: 10.3748/wjg.v24.i25.2710
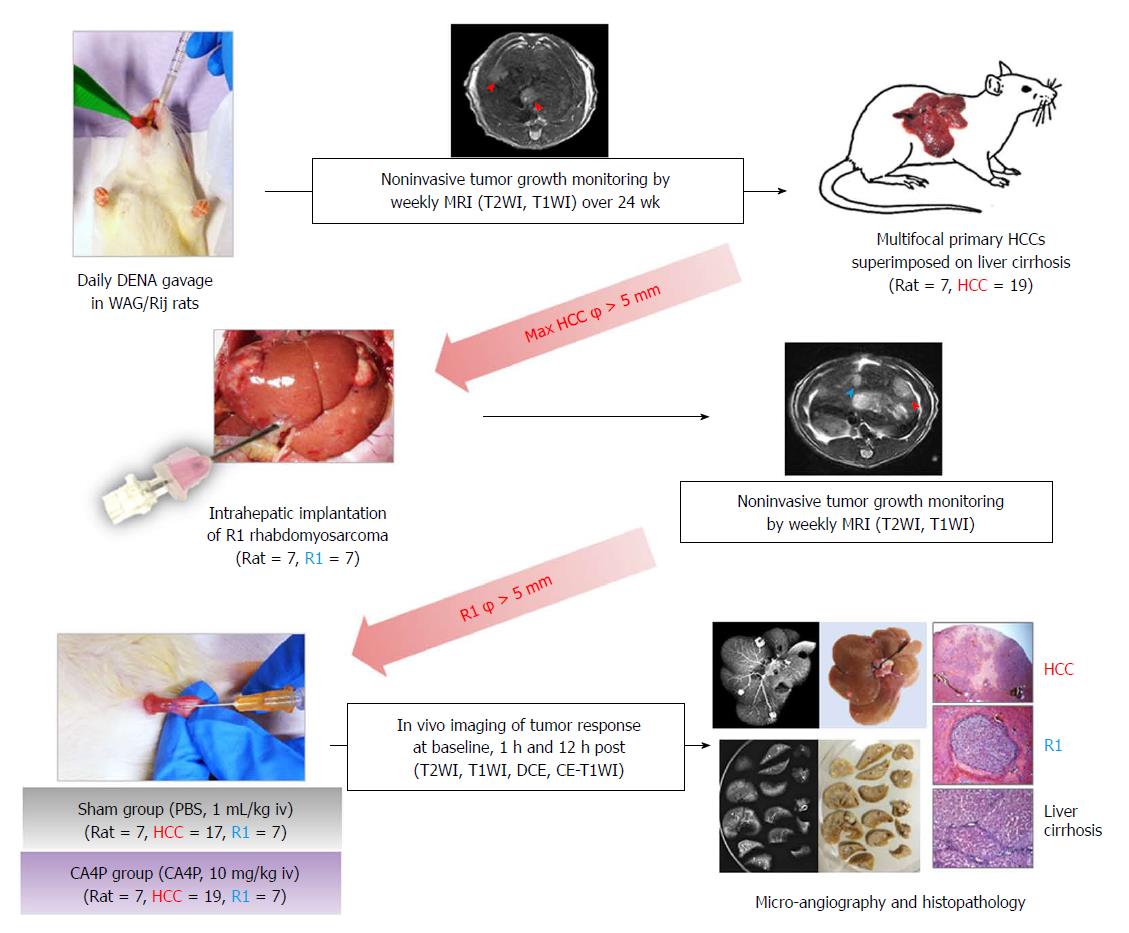
Figure 1 Flow chart of experimental protocol.
φ: Diameter; CA4P: Combretastatin-A4-phosphate; CE: Contrast-enhanced; DCE: Dynamic contrast-enhanced; DENA: Diethylnitrosamine; HCC: Hepatocellular carcinoma; iv: Intravenous(ly); MRI: Magnetic resonance imaging; PBS: Phosphate-buffered saline; R1: R1 rhabdomyosarcoma; T1WI: T1-weighted imaging; T2WI: T2-weighted imaging; WAG/Rij rat: Wistar Albino Glaxo/Rijswijk rat.
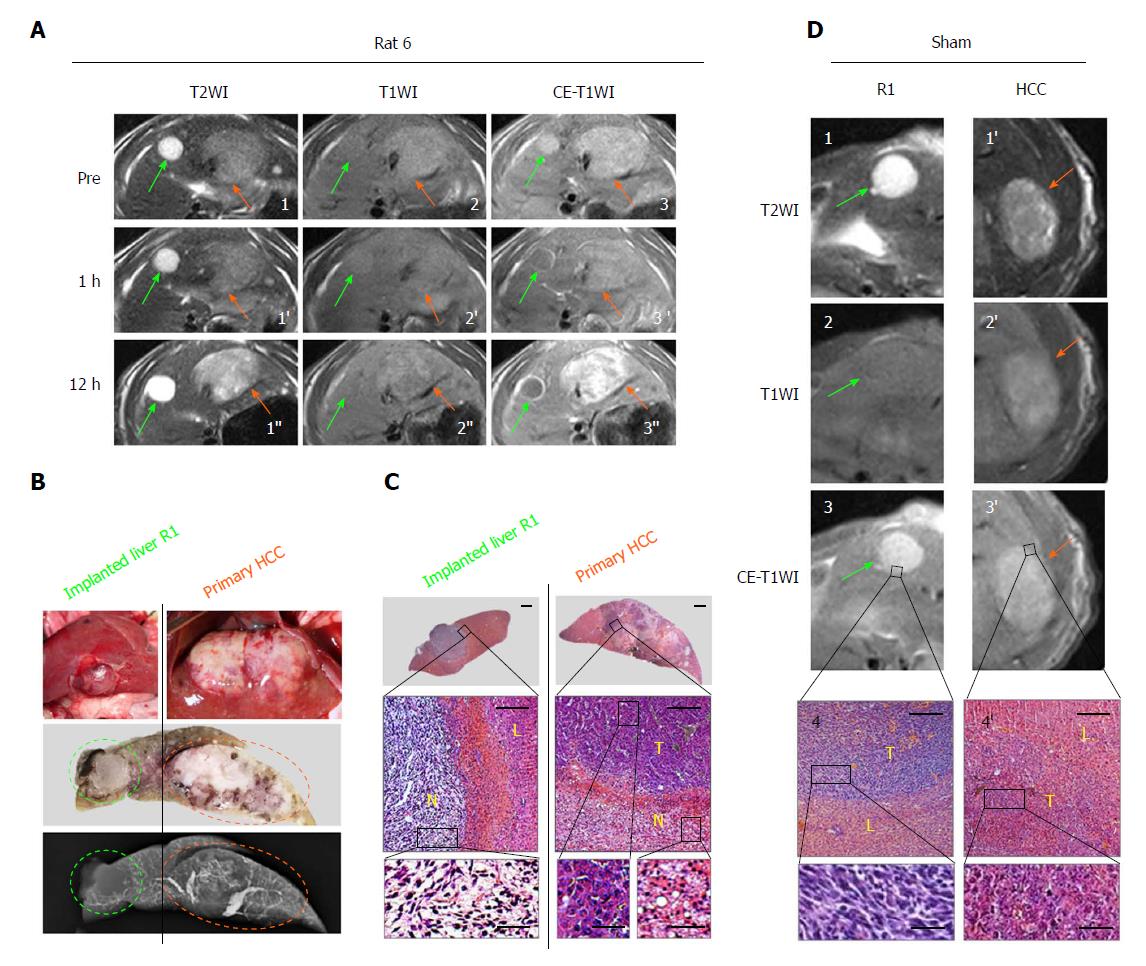
Figure 2 Intra-individual comparison of therapeutic responses to combretastatin-A4-phosphate between a primary hepatocellular carcinoma and a hepatic R1 allograft located in different liver lobes.
A: T2WIs (1-1’’), T1WIs (2-2’) and CE-T1WIs (3-3’’) of an implanted R1-tumor (green arrows) and a primary HCC (orange arrows) located in the median and left liver lobes, respectively, at baseline and 1 h and 12 h after CA4P therapy; B: Corresponding photomacrographs of median and left liver lobes (top panels), photomacrograph of liver blocks (middle panel) in 2-mm thickness corresponding to the transversal MRI, and microangiogram (bottom panel) of tumor-bearing liver blocks, revealing one R1-tumor (green circle) and one primary HCC (orange circle); C: Corresponding photomicrographs of R1-tumor (left column) and primary HCC (right column) in the median and left lobes, respectively. (HE staining; upper panels, × 12.5 original magnification, scale bar = 800 μm; lower panels, × 100 original magnification, scale bar = 100 μm, × 400 original magnification, scale bar = 25 μm); D: Sham control: T2WIs (1, 1’), T1WIs (2, 2’) and CE-T1WIs (3, 3’) of R1-tumor (green arrows) and primary HCC (orange arrows) located in the median and left liver lobes, respectively, at 12 h post PBS treatment, and corresponding photomicrographs (4, 4’; HE staining × 100 original magnification, scale bar = 100 μm, × 400 original magnification, scale bar = 25 μm). HCC: Hepatocellular carcinoma; L: Liver; N: Tumoral necrosis; PBS: Phosphate-buffered saline; T: Viable tumor.
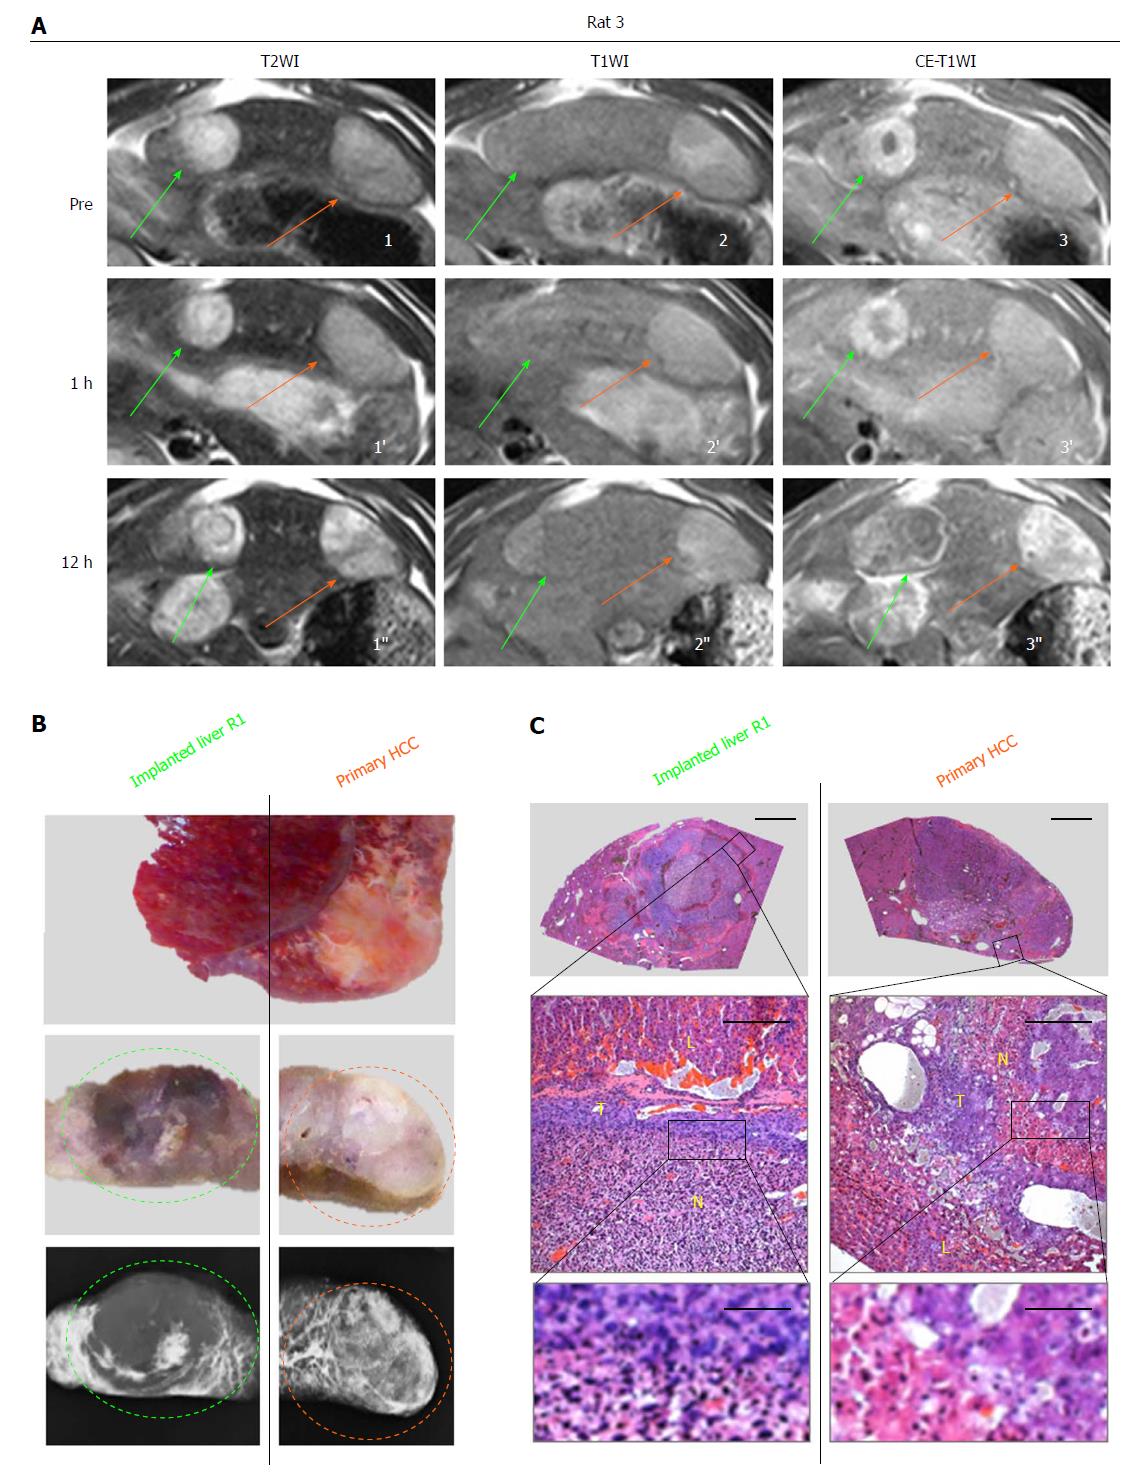
Figure 3 Intra-individual comparison of therapeutic responses to combretastatin-A4-phosphate between a primary hepatocellular carcinoma and a hepatic R1 allograft distributed in the same liver lobe.
A: T2WIs (1-1’’), T1WIs (2-2’’) and CE-T1WIs (3-3’’) of an implanted R1-tumor (green arrows) and a primary HCC (orange arrows) both located in the same left liver lobe at baseline and 1 h and 12 h after CA4P therapy; B: Corresponding macroscopic photographs of the left liver lobe (top panel) and liver blocks (middle panels) in 2-mm thickness corresponding to the transversal MRI, and microangiograms (bottom panels) of tumor-bearing liver block, revealing a R1-tumor (green circle) and a primary HCC (orange circle); C: Corresponding photomicrographs of R1-tumor (left column) and primary HCC (right column). (HE staining; upper panels, × 12.5 original magnification, scale bar = 800 μm; lower panels, × 100 original magnification, scale bar = 100 μm, × 400 original magnification, scale bar = 25 μm). HCC: Hepatocellular carcinoma; L: Liver; N: Tumoral necrosis; T: Viable tumor.
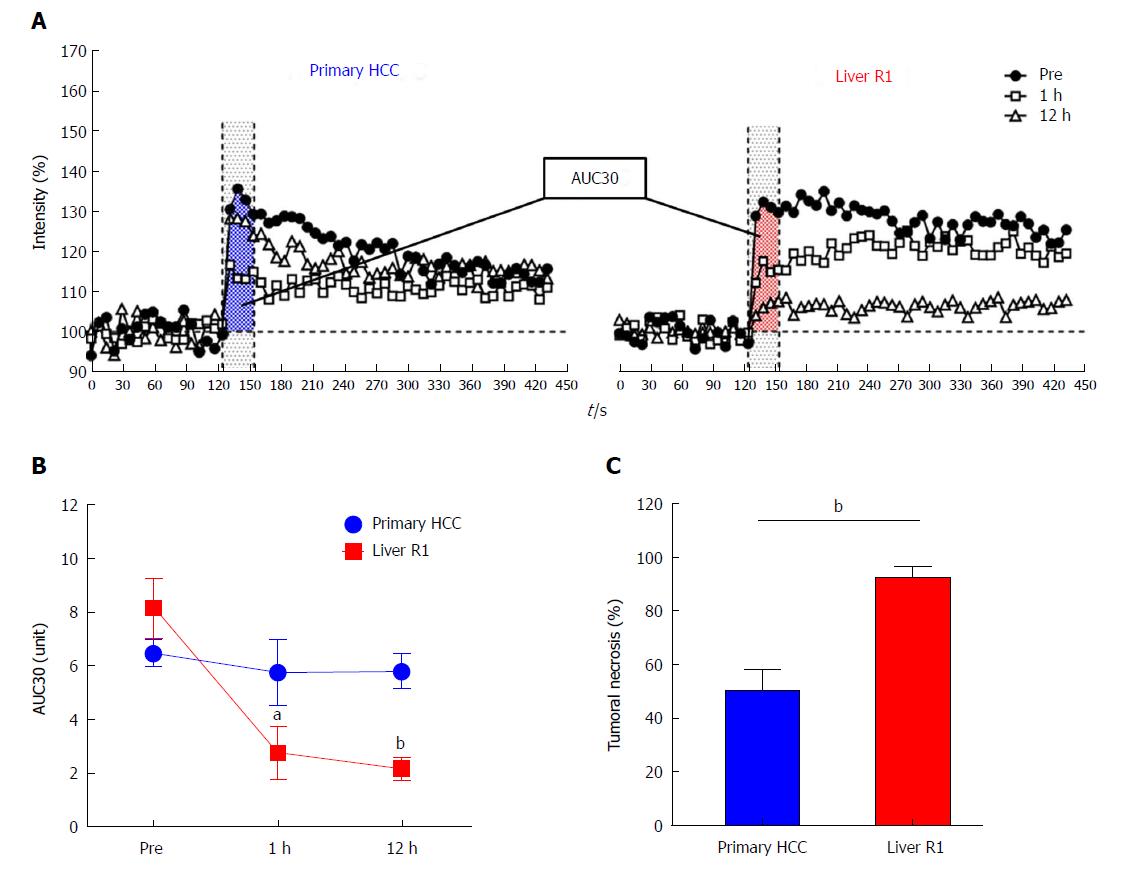
Figure 4 Changes of semiquantitative dynamic contrast-enhanced parameter of primary hepatocellular carcinomas and implanted liver R1-tumors and quantification of combretastatin-A4-phosphate-induced tumoral necrosis.
A: Representative contrast enhancement-time curves of a primary HCC and a secondary liver R1-tumor before, and 1 h and 12 h after CA4P treatment, for calculating tumor AUC30 at different time points; B: Quantitative changes of tumor blood supply between HCCs and R1-tumors at baseline and 1 h and 12 h after CA4P treatment indicated by AUC30; C: Bar chart comparing the percentile tumoral necrosis between primary HCCs and implanted liver R1 at 12 h after CA4P therapy, which was estimated by postmortem HE staining. aP < 0.05, bP < 0.01. AUC30: Area under the time signal intensity curve; HCC: Hepatocellular carcinoma.
- Citation: Liu YW, De Keyzer F, Feng YB, Chen F, Song SL, Swinnen J, Bormans G, Oyen R, Huang G, Ni YC. Intra-individual comparison of therapeutic responses to vascular disrupting agent CA4P between rodent primary and secondary liver cancers. World J Gastroenterol 2018; 24(25): 2710-2721
- URL: https://www.wjgnet.com/1007-9327/full/v24/i25/2710.htm
- DOI: https://dx.doi.org/10.3748/wjg.v24.i25.2710


