Copyright
©The Author(s) 2018.
World J Gastroenterol. Jun 28, 2018; 24(24): 2596-2604
Published online Jun 28, 2018. doi: 10.3748/wjg.v24.i24.2596
Published online Jun 28, 2018. doi: 10.3748/wjg.v24.i24.2596
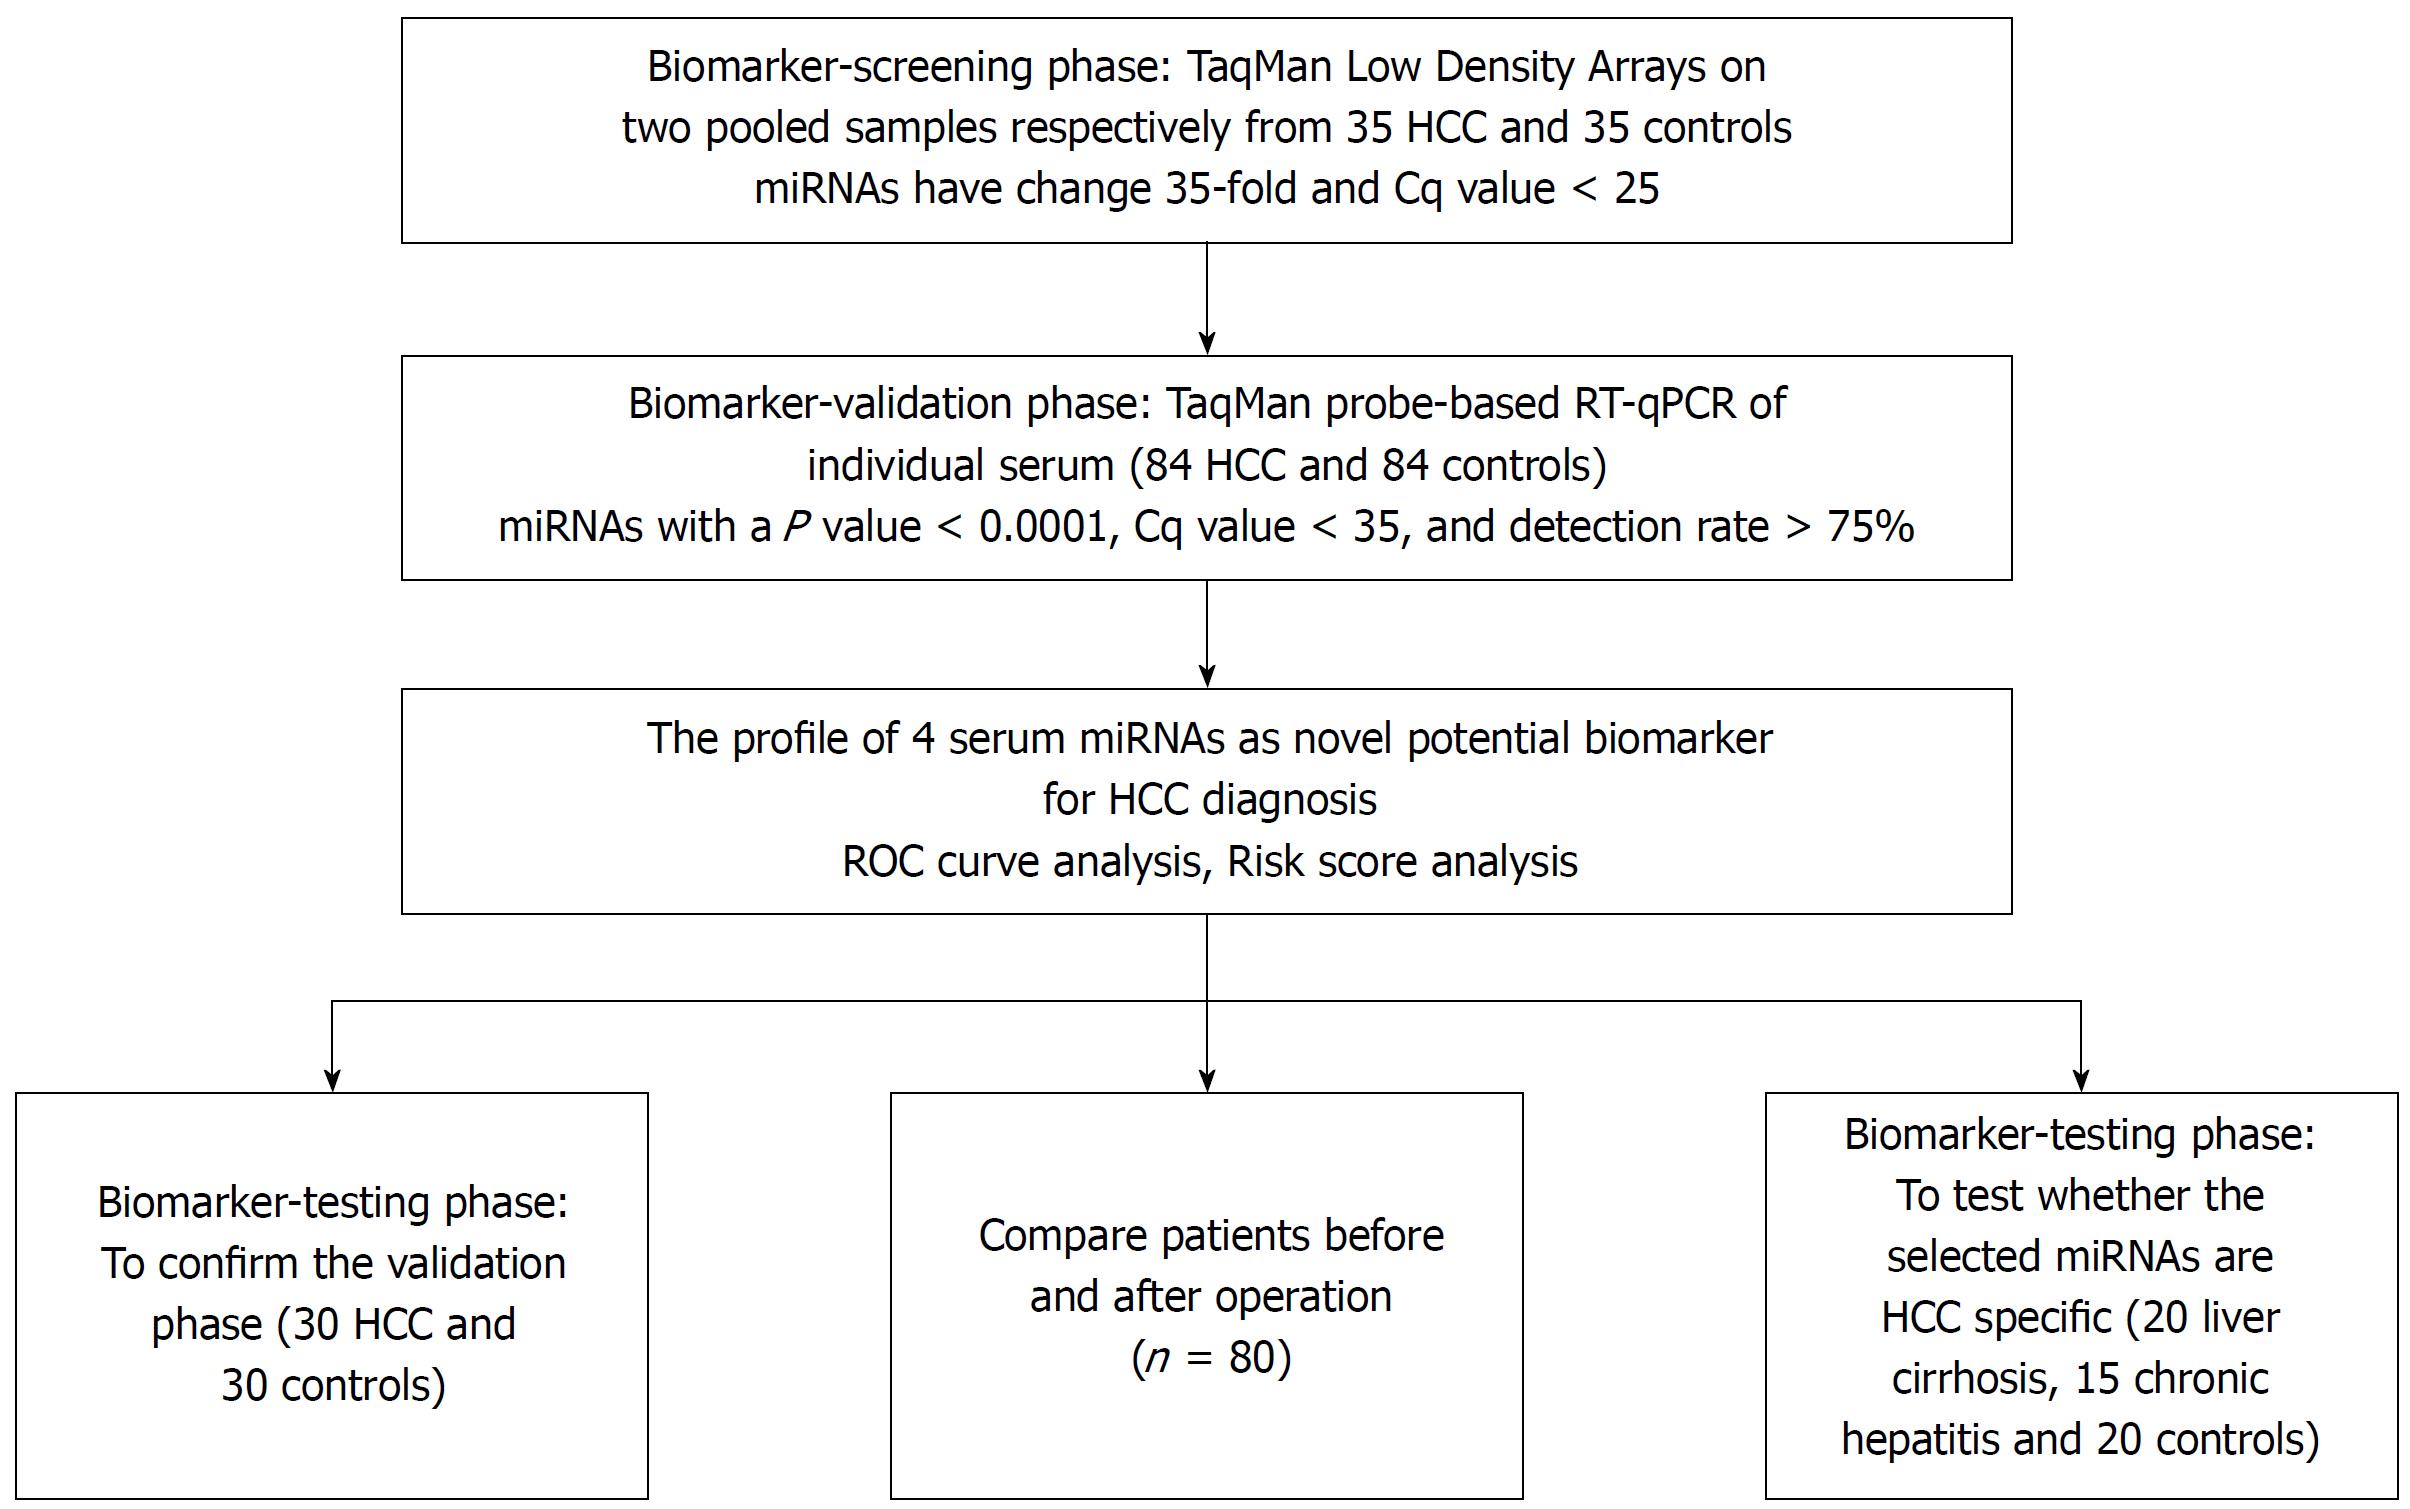
Figure 1 A flow chart of the experimental design.
HCC: Hepatocellular carcinoma; ROC: Receiver-operating-characteristic curve.
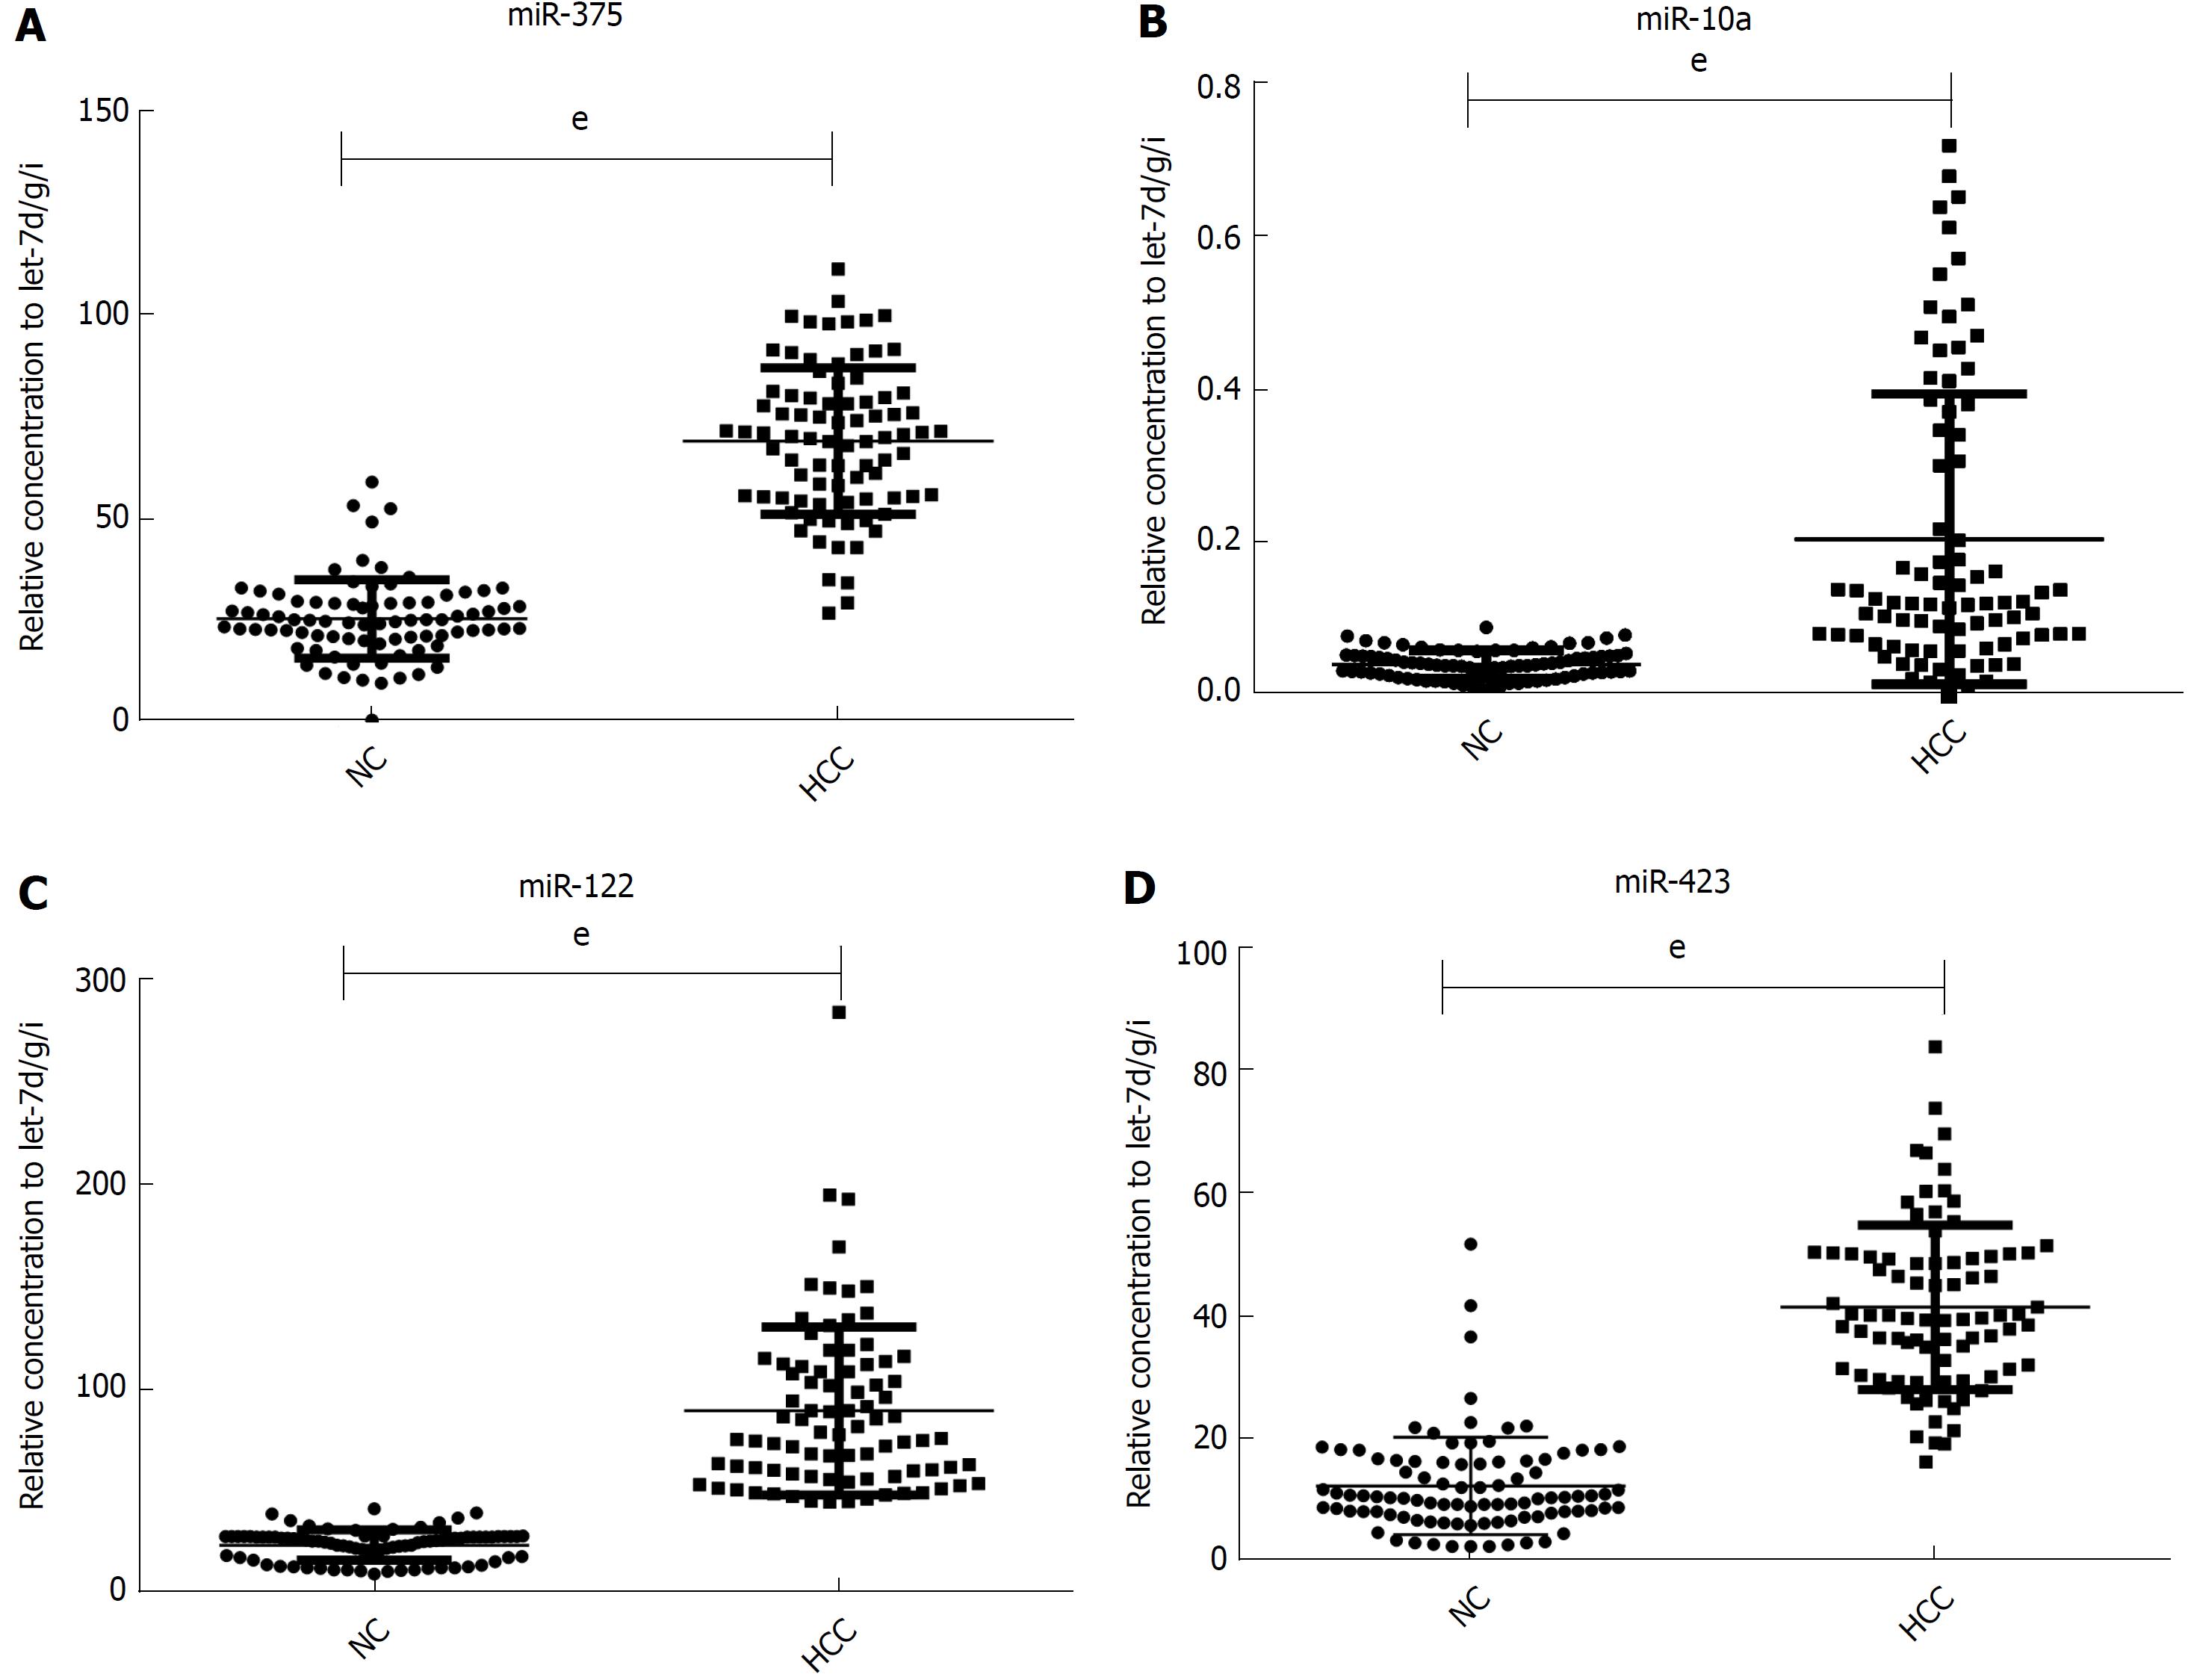
Figure 2 Relative contents of the selected four miRNAs in the sera from patient with hepatocellular carcinoma in the validation phase.
The asterisks indicate significant differences from normal controls (P < 0.05). eP < 0.001. NC: Normal controls; HCC: Hepatocellular carcinoma.
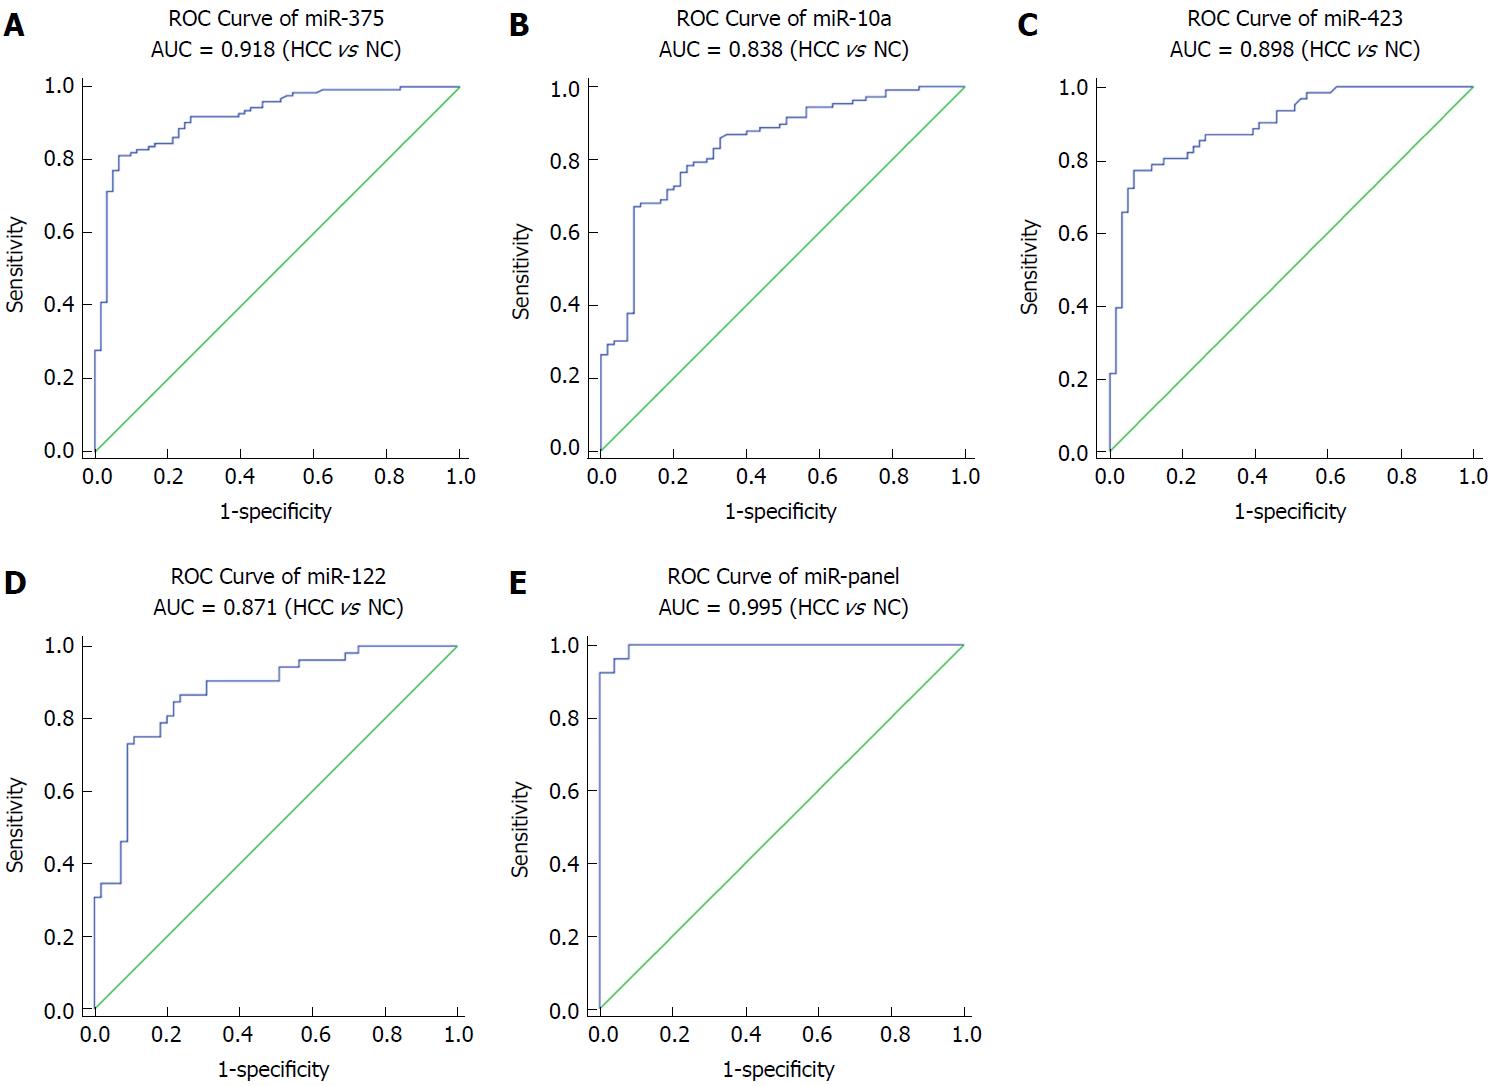
Figure 3 Sensitivity and specificity of the four-miRNA and their panel in the validation phase set.
HCC: Hepatocellular carcinoma; ROC: Receiver-operating-characteristic curve; AUC: Area under the ROC curve.
Figure 4 Relative contents of the four serum miRNAs in sera from hepatocellular carcinoma patients before and after surgery.
A-D: The contents of four miRNAs including miR-10a, miR-122, miR-375 and miR-423 in paired serum samples of 80 HCC patients before and 7-10 d after an operation were assayed by RT-qPCR assay. The relative levels of miRNAs were normalized to let-7-d/g/i and calculated using the 2-ΔΔCq method.
- Citation: An Y, Gao S, Zhao WC, Qiu BA, Xia NX, Zhang PJ, Fan ZP. Novel serum microRNAs panel on the diagnostic and prognostic implications of hepatocellular carcinoma. World J Gastroenterol 2018; 24(24): 2596-2604
- URL: https://www.wjgnet.com/1007-9327/full/v24/i24/2596.htm
- DOI: https://dx.doi.org/10.3748/wjg.v24.i24.2596


