Copyright
©The Author(s) 2018.
World J Gastroenterol. Jan 14, 2018; 24(2): 195-210
Published online Jan 14, 2018. doi: 10.3748/wjg.v24.i2.195
Published online Jan 14, 2018. doi: 10.3748/wjg.v24.i2.195
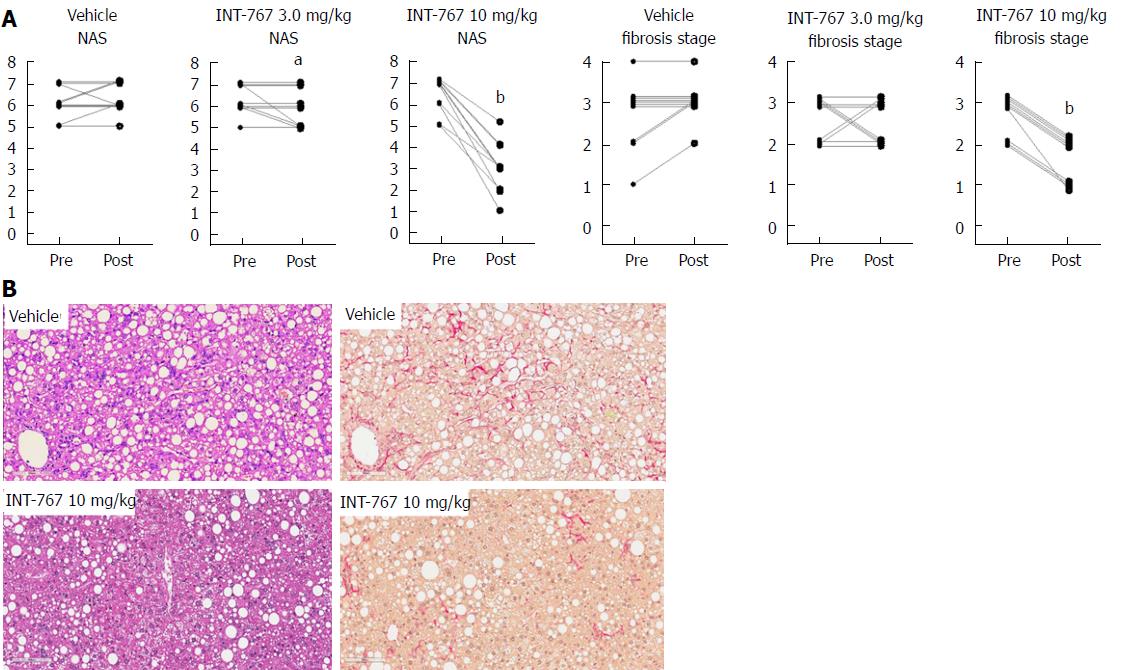
Figure 1 INT-767 treatment for 8 wk improves liver histopathology in ob/ob-NASH mice with biopsy-confirmed liver pathology.
A: Composite NAS and fibrosis stage before and after treatment intervention; B: Representative HE and PSR stainings. aP < 0.05, bP < 0.001 (χ2 test, vs vehicle controls).
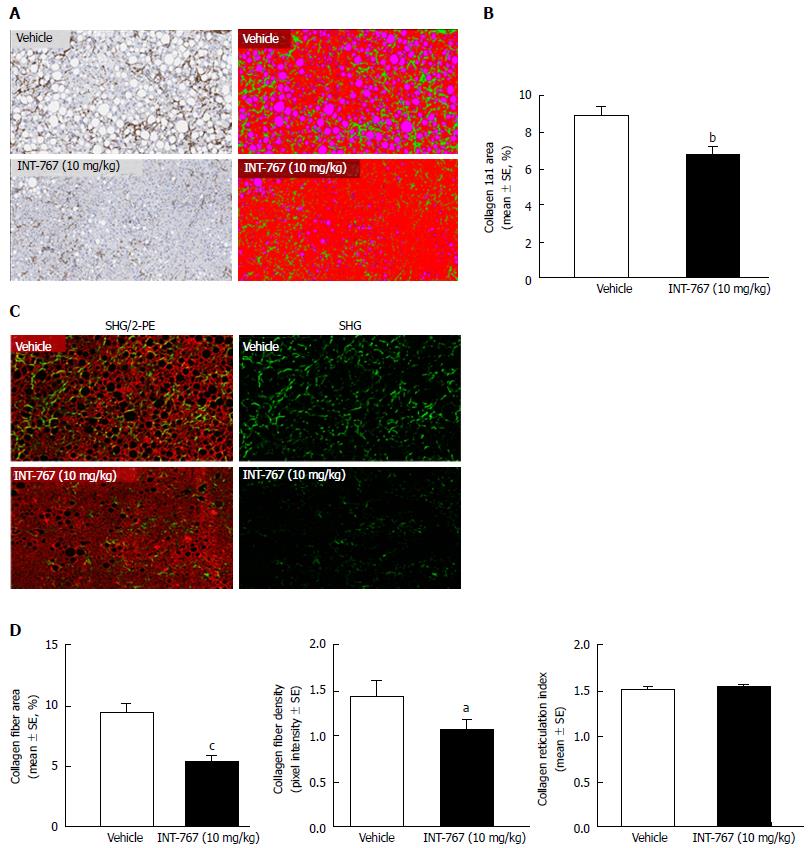
Figure 2 INT-767 treatment for 8 wk reduces hepatic collagen deposition in ob/ob-NASH mice with biopsy-confirmed liver pathology.
A: Collagen 1a1 (immunohistochemistry); B: Fractional area of collagen (immunohistochemistry); C: Label free SHG/2-PE images for collagen fiber deposition (green) in hepatic parenchyma (red). Data are expressed as % of total parenchymal area (subtraction of fat area); D: Fractional area of collagen fiber, collagen fiber density, and collagen fiber reticulation index (SHG analysis). aP < 0.05, bP < 0.01, cP < 0.001 (unpaired t-test).
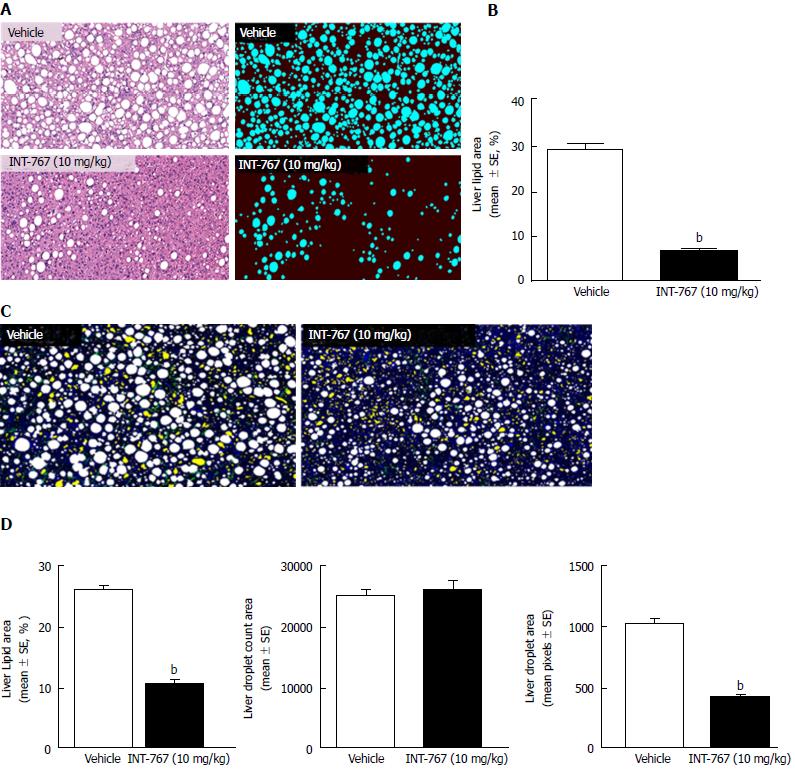
Figure 3 INT-767 treatment for 8 wk reduces hepatic lipid deposition in ob/ob-NASH mice with biopsy-confirmed liver pathology.
A: Liver lipid (HE staining); B: Fractional area of liver fat (HE staining); C: Processed (color coded) images to display hepatic lipid content. Lipid droplets (white), rejected structures (yellow), collagen (green), auto-fluorescence (blue); D: Fractional area of liver lipid area ratio (%), lipid droplet number (count in 15 mm2 tissue area), and lipid droplet area (1 pixel = 0.39 μm, 2-PE analysis). bP < 0.001 (unpaired t-test).
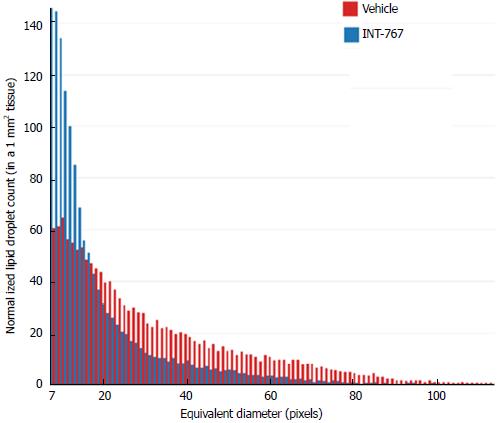
Figure 4 Histogram depicting lipid droplet size distribution in INT-767 vs vehicle treated ob/ob-NASH mice.
The “equivalent diameter” is the diameter of a circle of equivalent area as the one measured on the image (often not a perfect circle). Unit is in pixels, with 1 pixel = 0.39 μm.
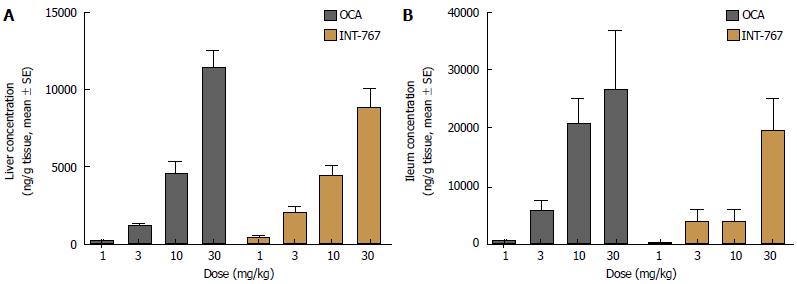
Figure 5 INT-767 and obeticholic acid (OCA) distribute similarly in the liver and ileum after 2 wk of administration in lean C57Bl/6 mice.
A: Liver concentration; B: Ileum concentration.
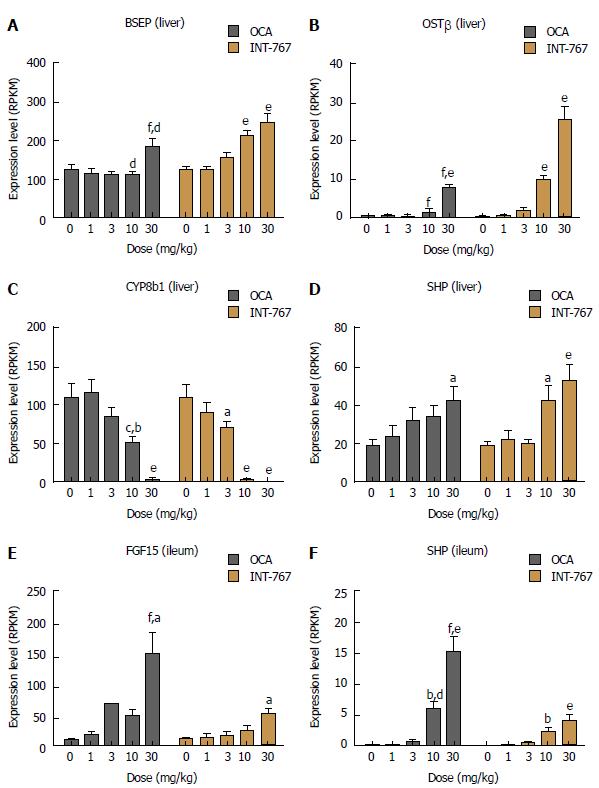
Figure 6 Obeticholic acid (OCA) and INT-767 modulate ileal and hepatic FXR target gene expression to a similar degree after 2 wk of dosing in lean C57Bl/6 mice.
A-D: Hepatic expression of BSEP, OST, CYP8b1, and SHP; E and F: Ileal mRNA expression of FGF-15 and SHP. aP < 0.05, bP < 0.01, eP < 0.001 vs no treatment (dose = 0); cP < 0.05, dP < 0.01, fP < 0.001 vs corresponding INT-767 dose (two-way ANOVA with Bonferroni’s post-hoc test).
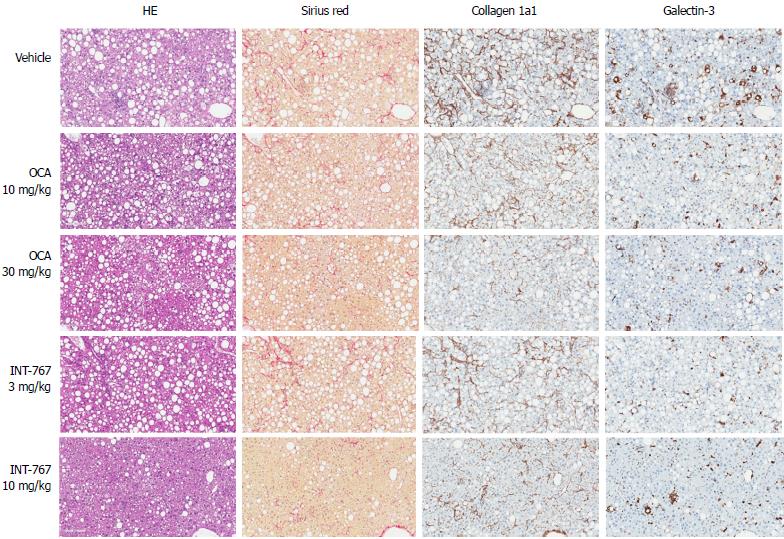
Figure 7 INT-767 and obeticholic acid (OCA) treatment for 16 wk improves liver histopathology in ob/ob-NASH mice with biopsy-confirmed liver pathology.
Representative hematoxylin-eosin (HE), picro-Sirius red, collagen 1a1 and galectin-3 stainings; NASH: Non-alcoholic steatohepatitis.
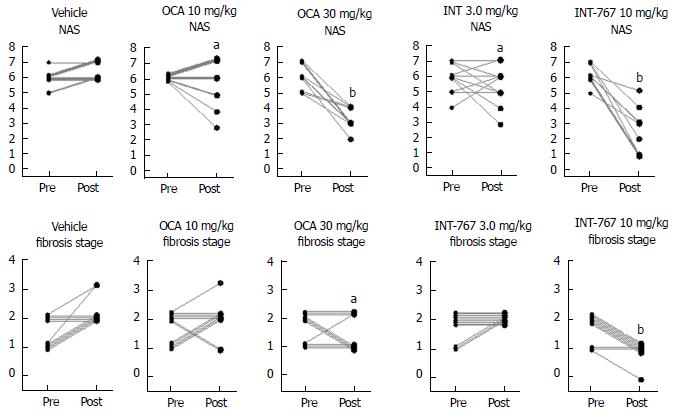
Figure 8 INT-767 and obeticholic acid (OCA) treatment for 16 wk improves liver histopathology in ob/ob-NASH mice with biopsy-confirmed liver pathology.
Composite NAS and fibrosis stage before and after treatment intervention. aP < 0.05, bP < 0.001 (χ2 test, vs vehicle controls), NASH: Non-alcoholic steatohepatitis.
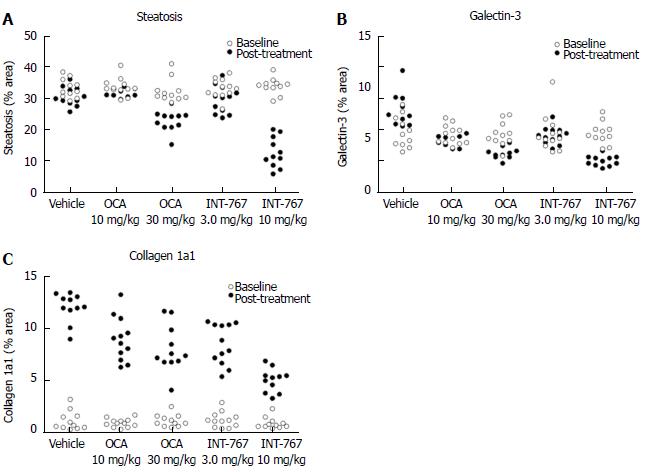
Figure 9 INT-767 or obeticholic acid treatment for 16 wks improves hepatic fat deposition, collagen 1a1 and galectin-3 levels in ob/ob-NASH mice with biopsy-confirmed liver pathology.
Data are indicated before (baseline) and after treatment intervention. A: Fractional area of fat (HE staining); B: Galectin-3; C: Collagen 1a1. Data are expressed as % of total parenchymal area (subtraction of fat area); NASH: Non-alcoholic steatohepatitis.
- Citation: Roth JD, Feigh M, Veidal SS, Fensholdt LK, Rigbolt KT, Hansen HH, Chen LC, Petitjean M, Friley W, Vrang N, Jelsing J, Young M. INT-767 improves histopathological features in a diet-induced ob/ob mouse model of biopsy-confirmed non-alcoholic steatohepatitis. World J Gastroenterol 2018; 24(2): 195-210
- URL: https://www.wjgnet.com/1007-9327/full/v24/i2/195.htm
- DOI: https://dx.doi.org/10.3748/wjg.v24.i2.195


