Copyright
©The Author(s) 2018.
World J Gastroenterol. May 14, 2018; 24(18): 2009-2023
Published online May 14, 2018. doi: 10.3748/wjg.v24.i18.2009
Published online May 14, 2018. doi: 10.3748/wjg.v24.i18.2009
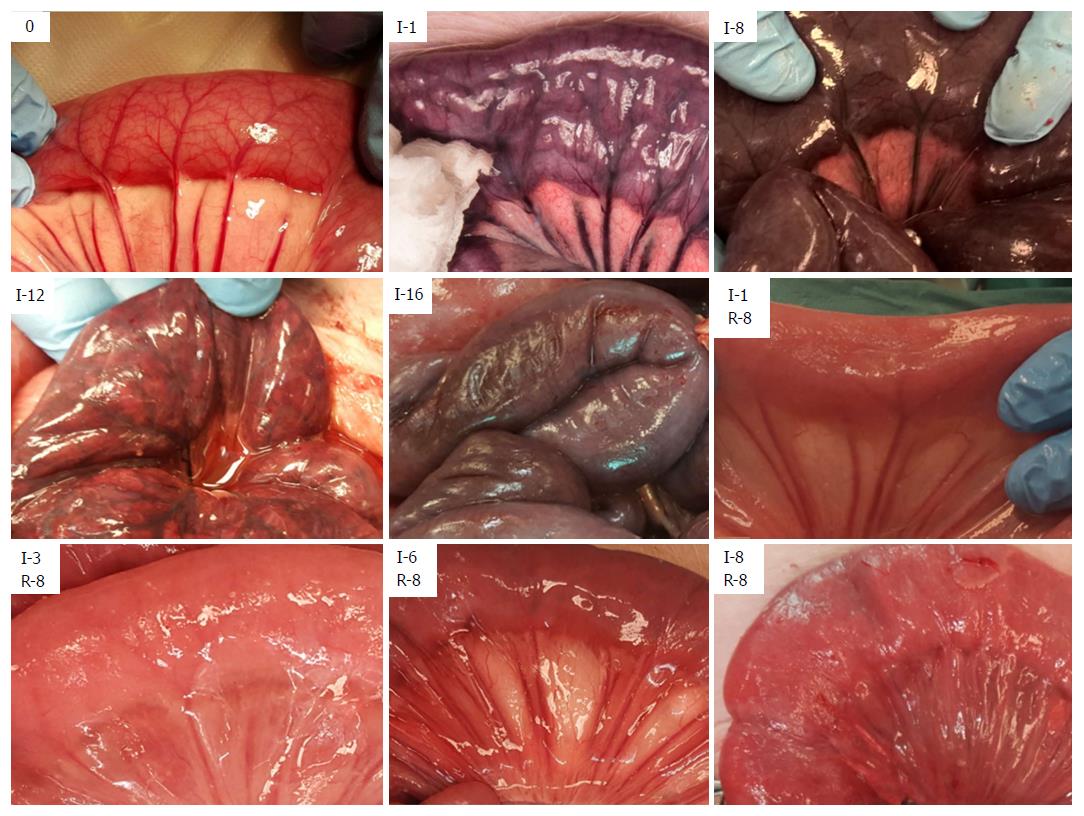
Figure 1 Jejunum at selected intervals of ischemia and reperfusion.
0: Perfused jejunum at the start of the experiment. I-1: 1 h of ischemia. I-8: 8 h of ischemia. I-12: 12 h of ischemia. I-16: 16 h of ischemia. I-1 R-8: 1 h of ischemia and 8 h of reperfusion. I-3 R-8: 3 h of ischemia and 8 h of reperfusion. I-6 R-8: 6 h of ischemia and 8 h of reperfusion. I-8 R-8: 8 h ischemia and 8 h of reperfusion. See Table 1 for description.
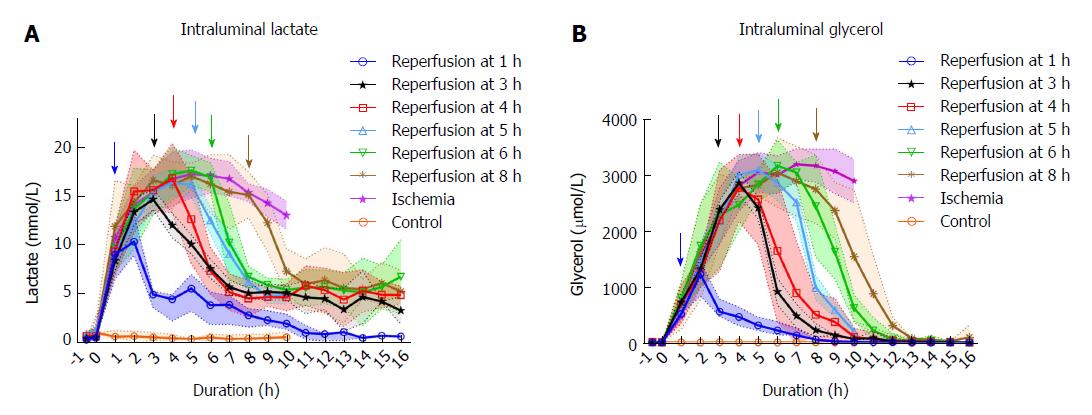
Figure 2 Intraluminal microdialysis in pig jejunum.
A: Plots show intraluminal lactate median with 95%CI bands of the median. B: Plots show intraluminal glycerol median with 95%CI bands of the median. Both: Measurements starts with a baseline 30 min before the initiation of ischemia at t = 0. Colored arrows show time points for start of reperfusion. Ischemia and reperfusion at 1, 3 and 5 h n = 14. Reperfusion at 4, 6 and 8 h n = 4. Control n = 5.
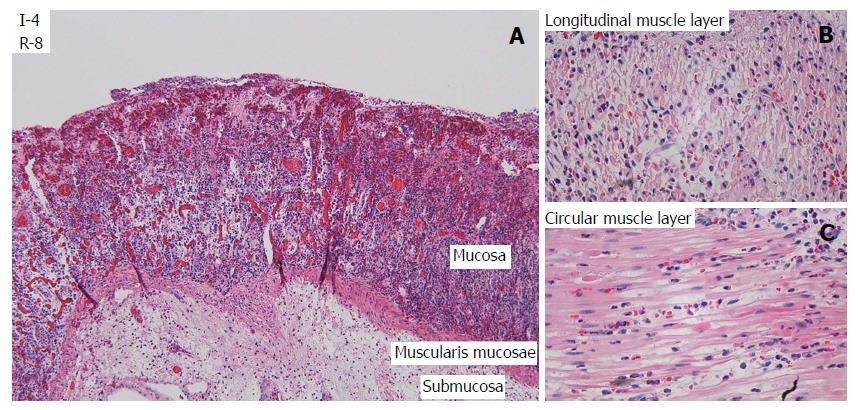
Figure 3 Light microscopy of selected structures of the jejunum after 4 h of ischemia and 8 h of reperfusion.
A: Mucosa and submucosa (HE, × 10), showing necrotic villi, total loss of crypt epithelium, shrinkage of myocytes in the muscularis mucosae, and edema in the submucosa. B: Longitudinal (outer) layer of the muscularis propria, showing edema and extensive shrinkage and loss of myocytes (HE, × 60). C: Circular (inner) layer of the muscularis propria, showing edema and extensive myocyte damage (HE, × 60).
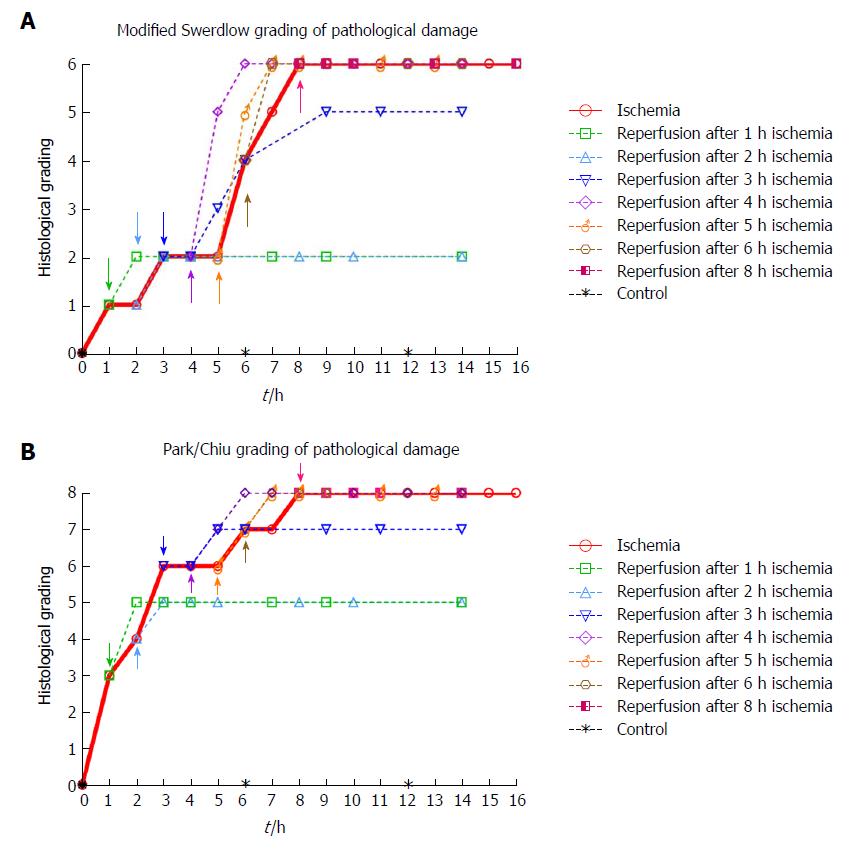
Figure 4 Histological grading of pathological damage (5 pigs, n = 128 biopsies total) at selected ischemia/reperfusion intervals.
Colored arrows show time points for start of reperfusion. Stippled lines show progression of injury following reperfusion. A: Modified Swerdlow et al[21,27,28]. B: Park/Chiu et al[22,26].
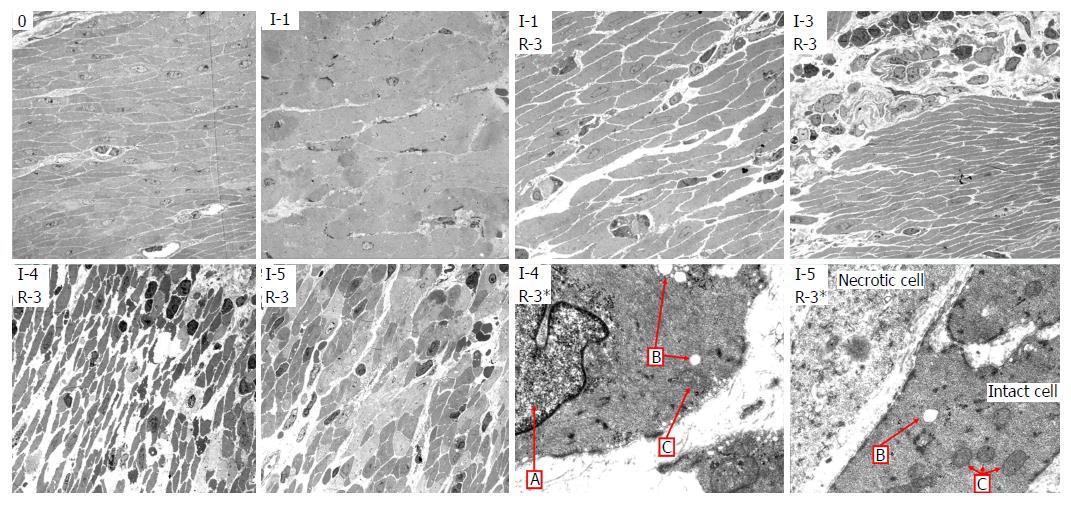
Figure 5 Transmission electron microscopy of jejunum (muscularis propria) sampled at selected time intervals of ischemia and reperfusion.
Images are indexed with I = ischemia hours and R = reperfusion hours. 0: Intact muscle. I-1: Mild intercellular edema, with increased variation in the electron density in the muscle cells. Some minimal fat vacuoles are visible. I-1 R-3: Focal/single cell necrosis with inflammatory response, low grade fine-vacuolization of the sarcoplasm. I-3 R-3: Active interstitial inflammation, swollen muscle cell nuclei. I-4 R-3: Severe interstitial edema and loss of coherence among muscle cells. Swollen nuclei and focal, mostly single cell necrosis. I-5 R-3: Focal multi cell necrosis, interstitial inflammation, vacuolization of sarcoplasm. I-4 R-3*: Swollen nucleus (A), vacuolated sarcoplasm (B) and swollen mitochondria (C). I-5 R-3*: Necrotic muscle cell adjacent to a more intact cell with some vacuoles (B) and slightly swollen mitochondria (C).
- Citation: Strand-Amundsen RJ, Reims HM, Reinholt FP, Ruud TE, Yang R, Høgetveit JO, Tønnessen TI. Ischemia/reperfusion injury in porcine intestine - Viability assessment. World J Gastroenterol 2018; 24(18): 2009-2023
- URL: https://www.wjgnet.com/1007-9327/full/v24/i18/2009.htm
- DOI: https://dx.doi.org/10.3748/wjg.v24.i18.2009


