Copyright
©The Author(s) 2018.
World J Gastroenterol. May 14, 2018; 24(18): 1995-2008
Published online May 14, 2018. doi: 10.3748/wjg.v24.i18.1995
Published online May 14, 2018. doi: 10.3748/wjg.v24.i18.1995
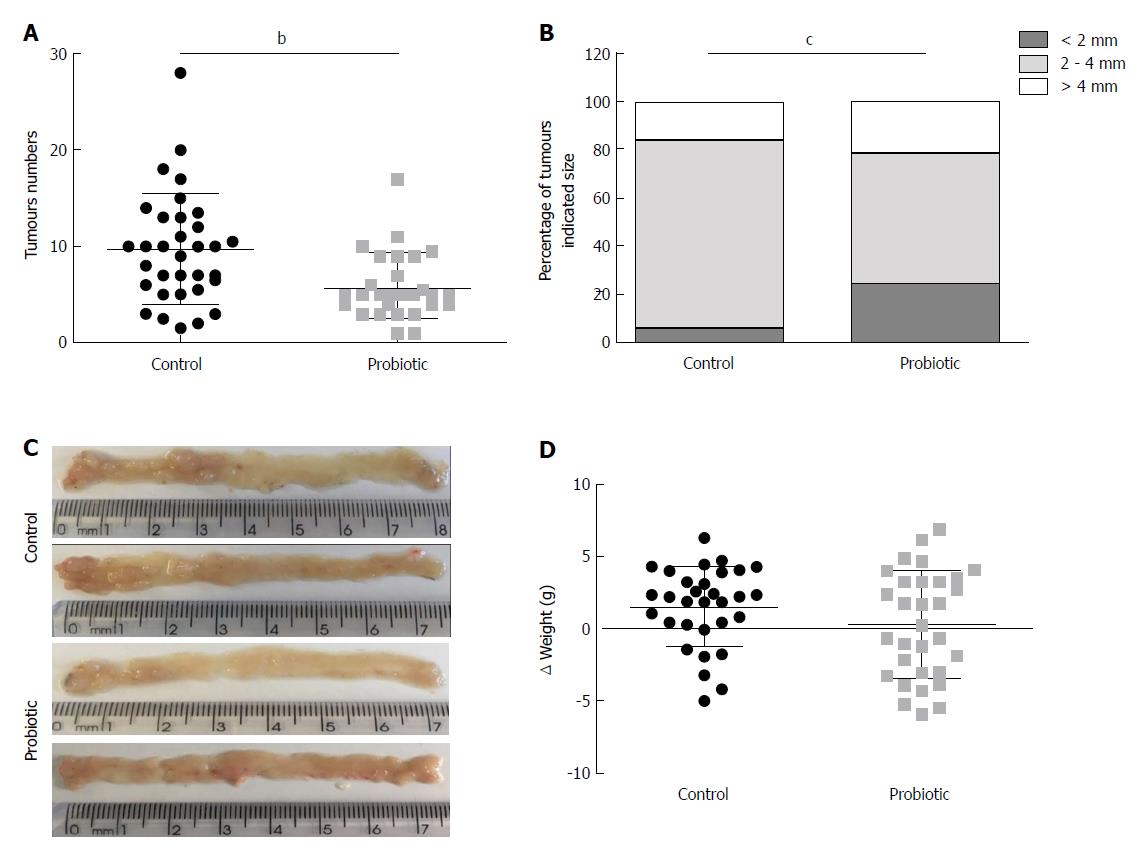
Figure 1 Probiotic supplementation reduces tumour incidence in a colorectal cancer model associated with colitis.
Number (A) and size (B) of colon tumours in the control (n = 33) and probiotic (n = 29) groups. C: Representative images of tumours in the colons of the control and probiotic groups at day 60 after injection with azoxymethane. D: Change in body weight during treatment with azoxymethane and DSS in the control (n = 31) and probiotic (n = 31) groups. aP < 0.05; bP < 0.01; cP < 0.001; Mann-whitney U test (A and D), Chi-square test (B). Data are from three independent experiments and are presented as mean and standard deviation.
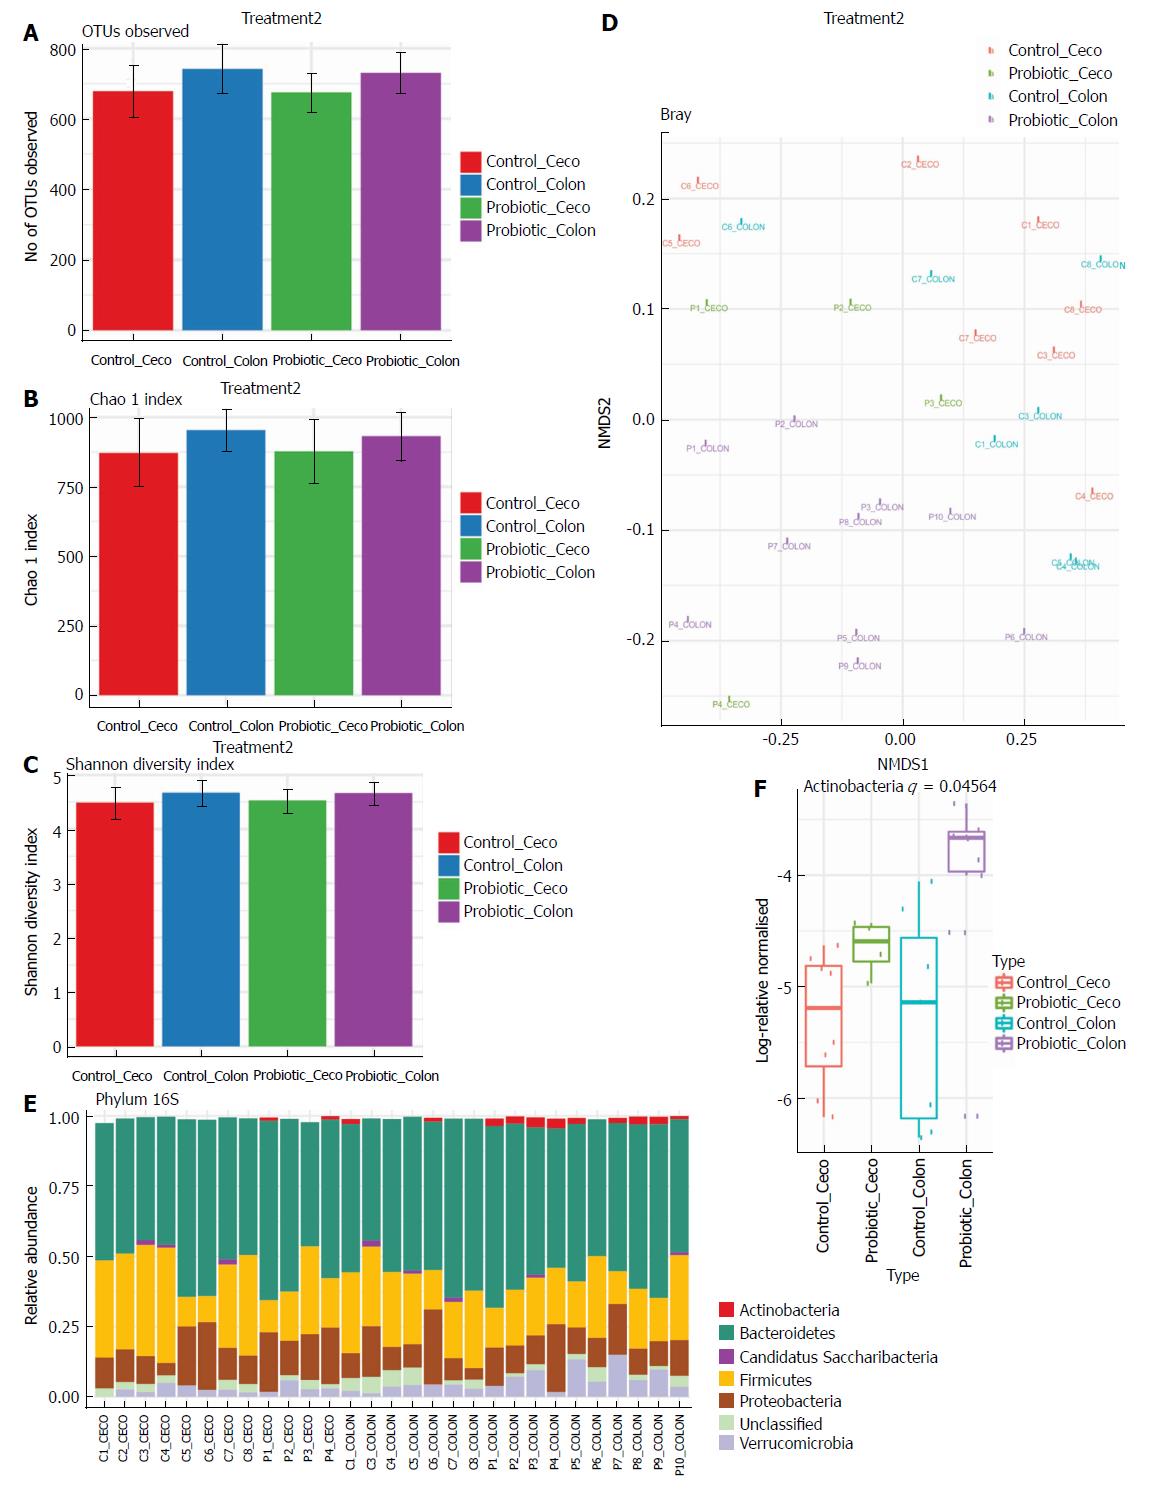
Figure 2 Probiotic supplementation changes the intestinal microbiota composition.
A-C: Microbiota alpha-diversity in the faecal content of the cecum and colon from control and probiotic groups. Differences and comparisons of species richness (A), total number of operational taxonomic units, (B) Chao1 Richness Index, (C) Shannon Diversity Index. Data are expressed as means ± SEM. Control cecum, n = 8; Probiotic cecum, n = 4; Control colon, n = 7; Probiotic colon, n = 10, Kruskal-Wallis test. D: Non-metric multidimensional scaling (nMDS) analysis of colon and cecum faecal content from control and probiotic-treated animals. Each point represents a sample, groups identified by coloration, according to legend. E, F. Relative abundance at the phylum level in the cecum and colon from control and treated with probiotic Groups. E: Each bar represents an individual animal, the colour of each cell indicates the relative abundance of bacterial phyla. Taxa with relative abundance greater than 1% are shown. F: Box-plot represents log relative normalized abundance at the phylum level in the cecum and colon from control and probiotic-treated groups. ‘C’ for Control and ‘P’ for Probiotic. Only the significant P values obtained by the Kruskal-Wallis test are shown as q value.
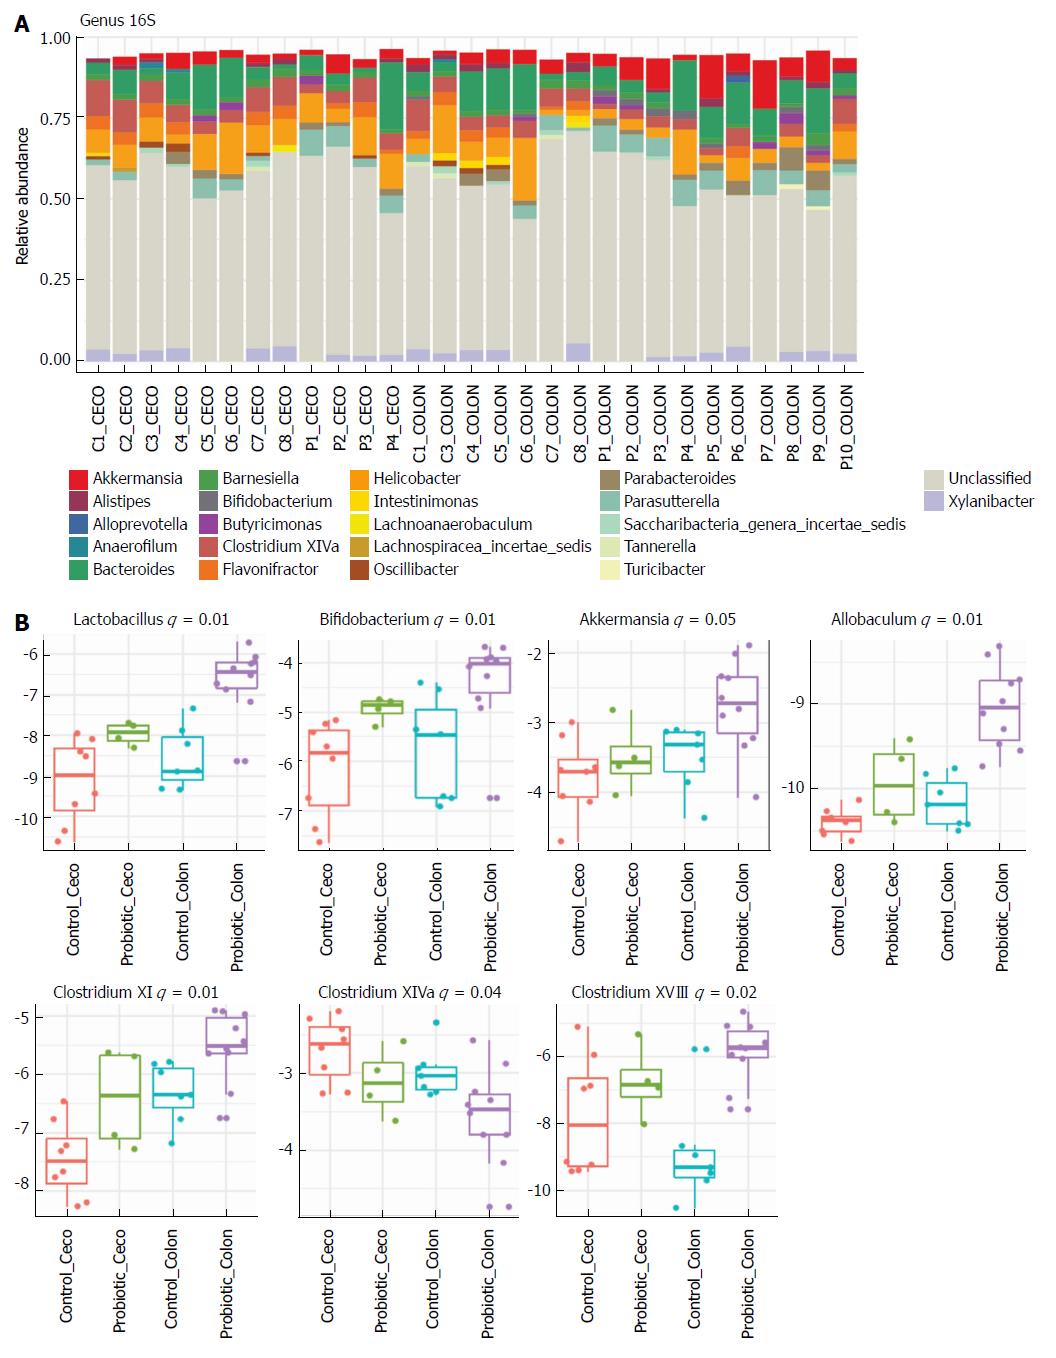
Figure 3 Probiotic supplementation changes the gut microbiota in the colon at the genus level.
Relative abundance at the genus level in the cecum and colon from control and probiotic-treated groups at day 60 after colon cancer induction. A: Each bar represents an individual animal, and the colour of each cell indicates the relative abundance of the bacterial genus. Taxa with relative abundance greater than 1% are shown. ‘C’ for Control and ‘P’ for Probiotic. B: Box-plot represents log relative normalized abundance at the genus level in the cecum and colon from control and probiotic-treated groups. Only significant P values (q value) obtained by the Kruskal-Wallis test are shown. Control cecum, n = 8; Probiotic cecum, n = 4; Control Colon, n = 7; Probiotic colon, n = 10. Kruskal-Wallis test.
Figure 4 Probiotic supplementation modulates inflammation in colorectal carcinogenesis associated with colitis.
Representative images (A) and inflammatory index (B) of mouse colons from control and probiotic groups at day 60 after azoxymethane injection stained with haematoxylin and eosin. cP < 0.001 Mann-Whitney U test, data representative of two independent experiments presented as mean and standard deviation. C: Spleen weight in control group (n = 21) and probiotic (n = 25) mice. Mann-Whitney U test. Data from two independent experiments are presented as mean and standard deviation. D: Concentration of serum cytokines analysed by Bio-Plex Multiplex cytokine assay at day 60 after injection with azoxymethane. aP < 0.05; Mann-Whitney U test. Data from two independent experiments, presented as mean and standard deviation. E: Representative western blot images of two independent experiments showing colon lysates of control and probiotic group mice; p-IKKα/β, IKKα, TNF-α, IL10 and β-tubulin.
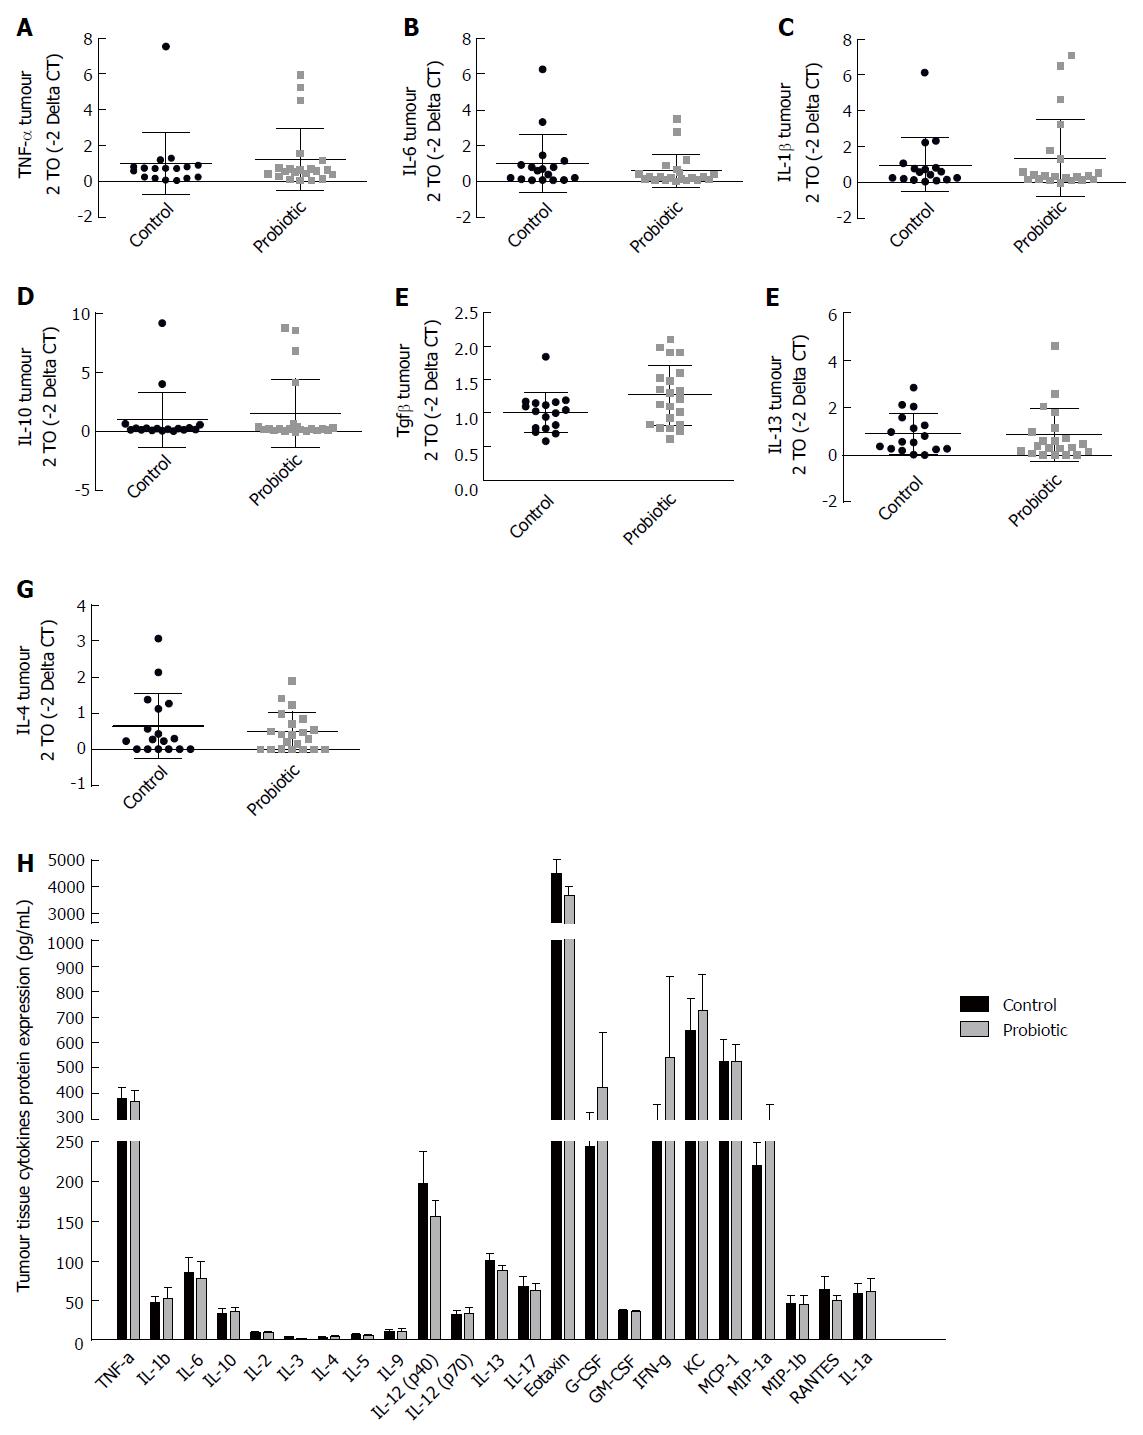
Figure 5 Probiotic supplementation does not modify the tumour microenvironment.
Real-time RT-PCR analysis of TNF-α (A), IL-6 (B), IL-1β (C), IL-10 (D), TGF-β1 (E), and IL-13 (F), IL-4(G) in colon tumour tissue of control and probiotic groups; results are presented relative to those of Gapdh. H: Concentration of cytokines in the tumour tissue analysed by Bio-Plex Multiplex cytokine assay at day 60 after injection with azoxymethane. Mann-Whitney U test. Data from two independent experiments, presented as mean and standard deviation.
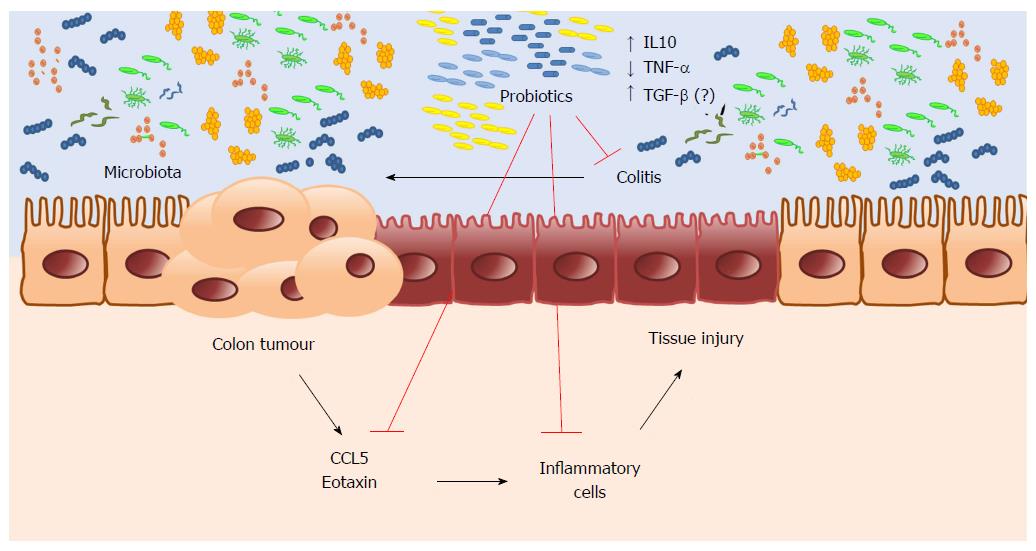
Figure 6 Microbiota modification by probiotic supplementation reduces colitis modulating cytokines expression preventing colon cancer development in mice.
- Citation: Mendes MCS, Paulino DS, Brambilla SR, Camargo JA, Persinoti GF, Carvalheira JBC. Microbiota modification by probiotic supplementation reduces colitis associated colon cancer in mice. World J Gastroenterol 2018; 24(18): 1995-2008
- URL: https://www.wjgnet.com/1007-9327/full/v24/i18/1995.htm
- DOI: https://dx.doi.org/10.3748/wjg.v24.i18.1995


