Copyright
©The Author(s) 2018.
World J Gastroenterol. Apr 28, 2018; 24(16): 1748-1765
Published online Apr 28, 2018. doi: 10.3748/wjg.v24.i16.1748
Published online Apr 28, 2018. doi: 10.3748/wjg.v24.i16.1748
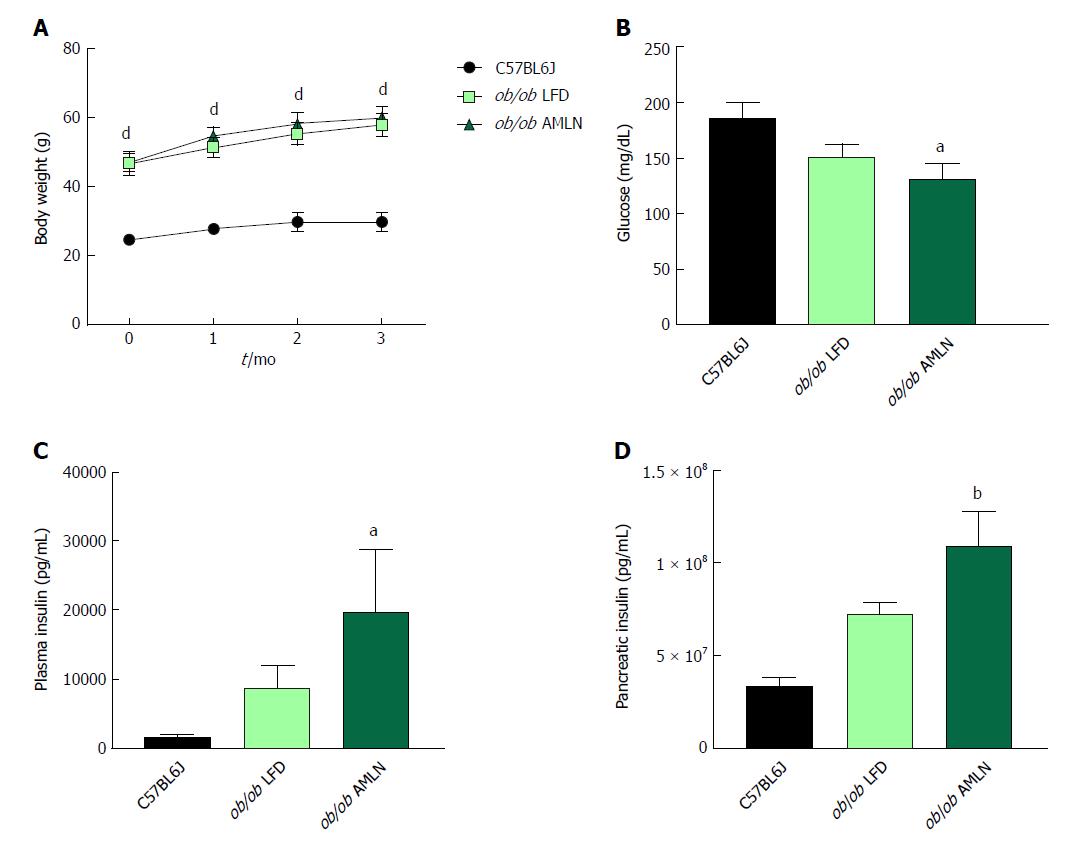
Figure 1 Obese ob/ob mice display increased hyperinsulinemia on AMLN diet.
(A): Average body weight over 12-wk disease induction period; (B): Terminal non-fasting blood glucose levels; (C): Terminal non-fasting plasma insulin levels; (D): Pancreatic insulin content. aP ≤ 0.05, bP ≤ 0.01, dP ≤ 0.0001 vs C57BL6J. LFD: Low-fat diet.
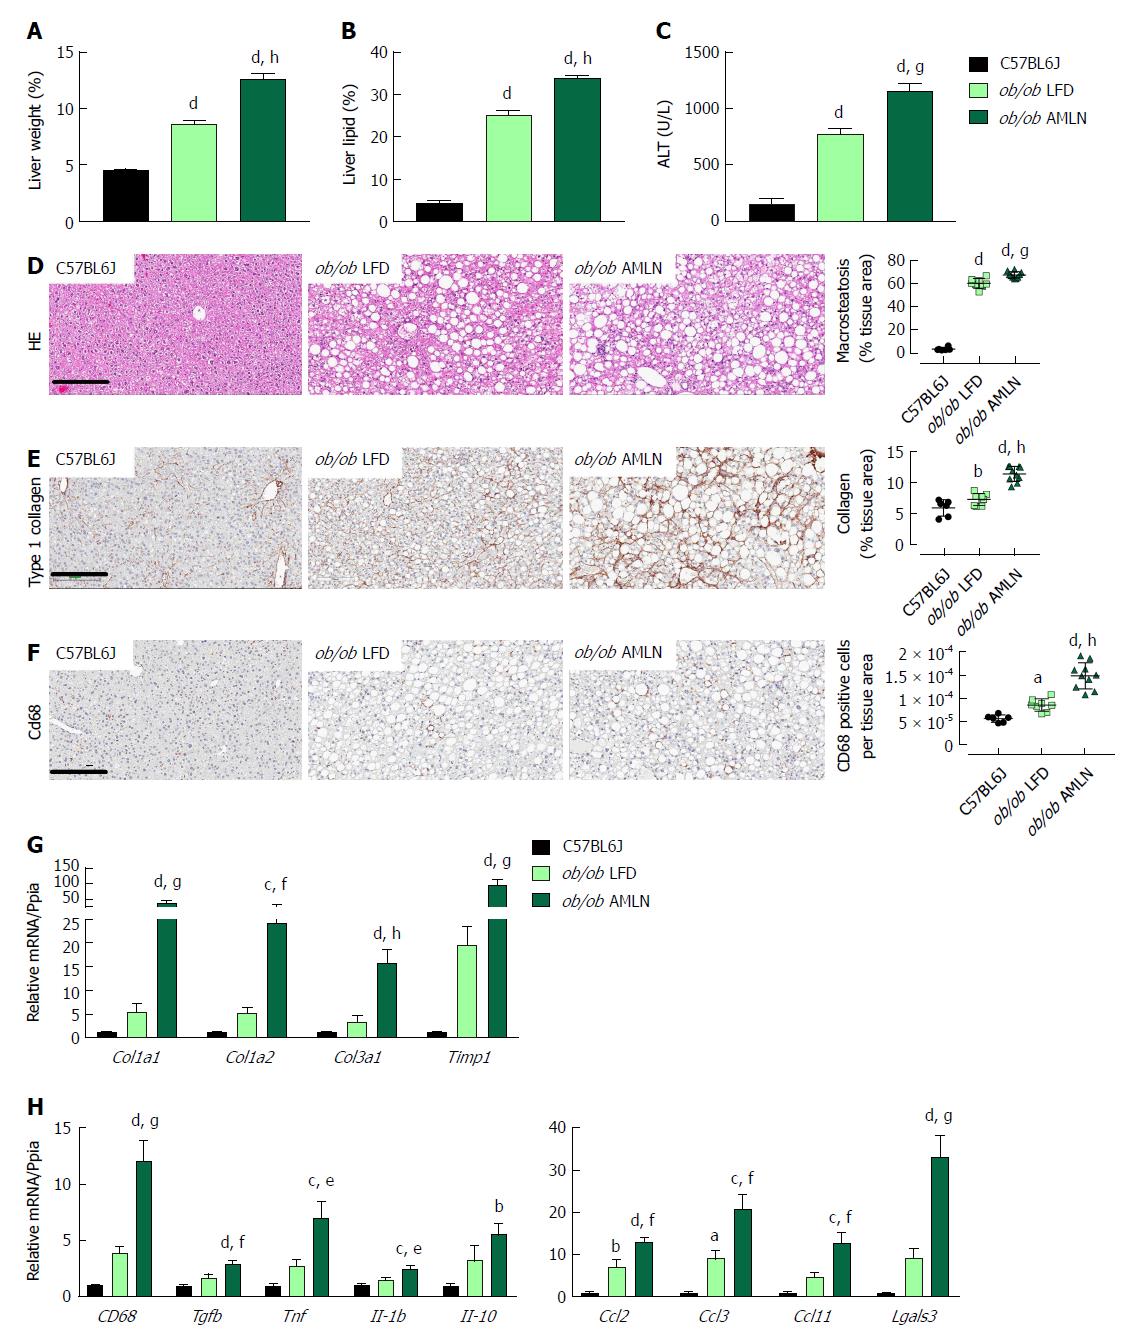
Figure 2 Comparison of metabolic and hepatic abnormalities associated with diet-induced nonalcoholic fatty liver disease/nonalcoholic steatohepatitis in ob/ob mice.
Liver weight (A), liver lipid (B), and plasma alanine aminotransferase (ALT) levels (C) of lean (C57BL6J) and ob/ob mice maintained on control low-fat diet (ob/ob LFD) or AMLN diet (ob/ob AMLN) for 12 wk; (D): Representative hematoxylin and eosin stained liver sections and quantification of percentage of liver area containing macrosteatosis; (E): Representative collagen type 1 alpha 1 stained liver sections and quantification of collagen area. Scale bar = 200 μm; (F): Representative CD68-stained liver sections and quantification of CD68-positive cells; G, H: Relative expression of genes associated with fibrosis and inflammation. aP ≤ 0.05, bP ≤ 0.01, cP ≤ 0.001, dP ≤ 0.0001 vs C57BL6J; eP ≤ 0.05, fP ≤ 0.01, gP ≤ 0.001, hP ≤ 0.0001 vs LFD. LFD: Low-fat diet.
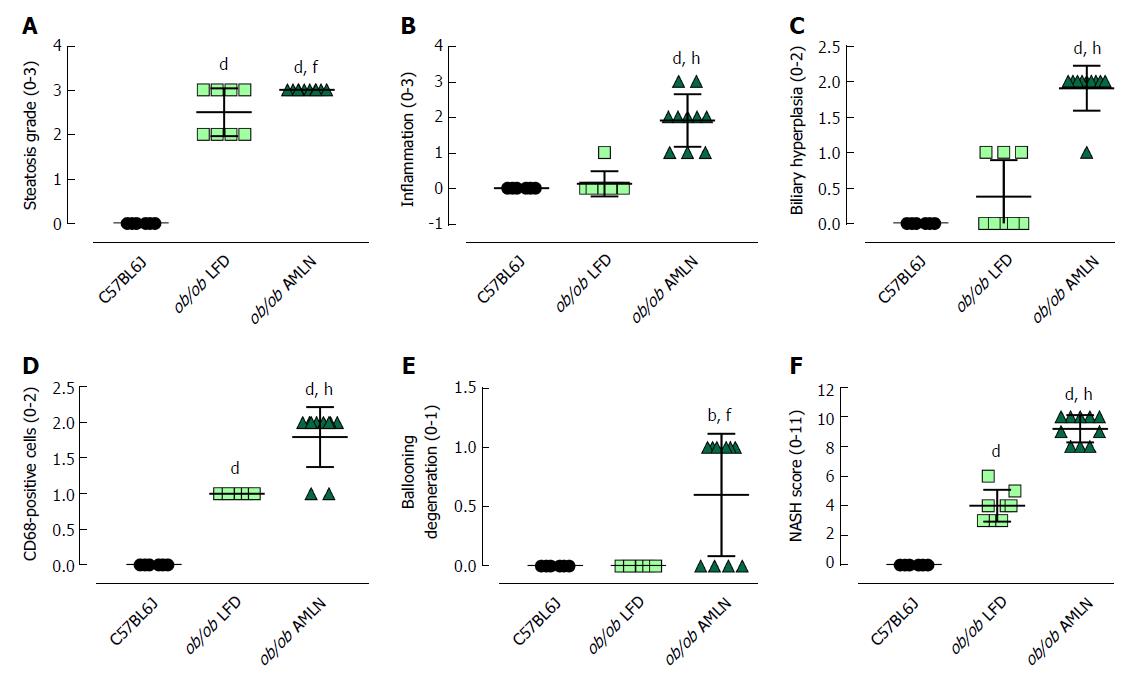
Figure 3 Histopathological grading of C57BL6J, ob/ob low-fat diet and ob/ob AMLN liver.
Individual grades of steatosis (A), inflammation (B), biliary hyperplasia (C), CD68-positive cells (D) and ballooning degeneration (E) are shown; (F): Comparison of the total NASH scores representing the sum of all histologic parameters. bP ≤ 0.01, dP ≤ 0.0001 vs C57BL6J; fP ≤ 0.01, hP ≤ 0.0001 vs LFD. LFD: Low-fat diet.
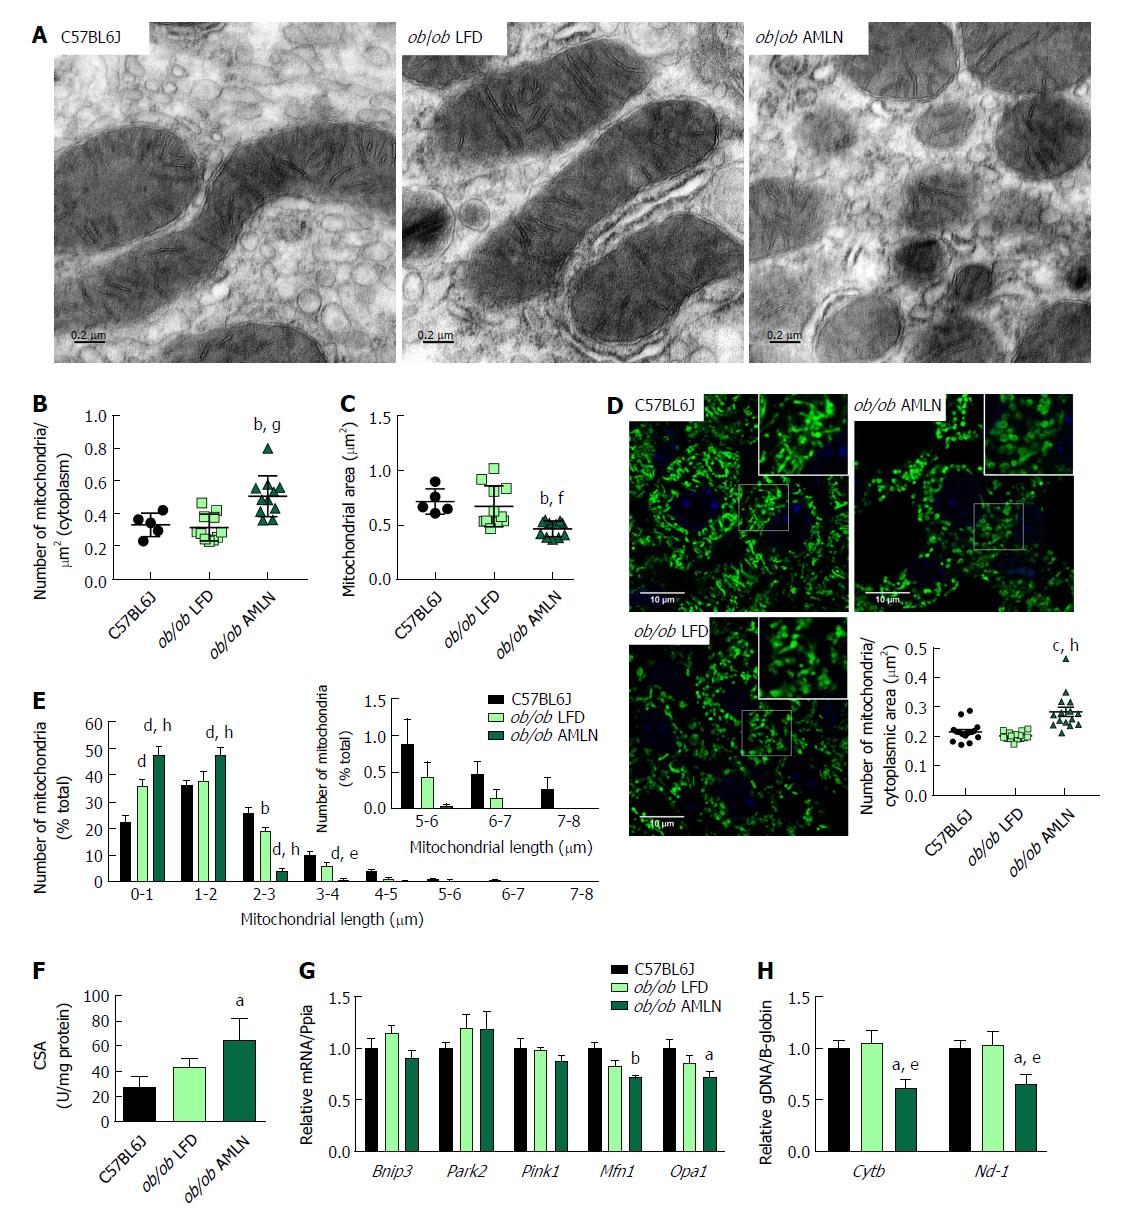
Figure 4 ob/ob AMLN hepatocytes display increased numbers of fragmented mitochondria.
(A) Transmission electron micrographs (TEM) showing mitochondrial morphology and ultrastructure in the liver. Scale bar = 0.2 μm. Quantification of the number of mitochondria (B) and mitochondrial area (C) from TEM images; (D): Confocal images of HSP60 stained liver sections and quantification of mitochondrial number per cytoplasmic area. Scale bar = 10 μm; (E): Histogram depicting the number of mitochondria per binned mitochondrial length as a percentage of total mitochondria per cell; (F): Mitochondrial content measured by citrate synthase activity in isolated primary hepatocytes; (G): Relative hepatic expression of genes associated with mitophagy; (H): Quantification of mitochondrial genome-encoded CytB or Nd1 relative to nuclear-encoded β-globin from total genomic DNA extracted from the liver. aP ≤ 0.05, bP ≤ 0.01, vs C57BL6J; eP ≤ 0.05, fP ≤ 0.01, gP ≤ 0.001, hP ≤ 0.0001 vs LFD. LFD: Low-fat diet.
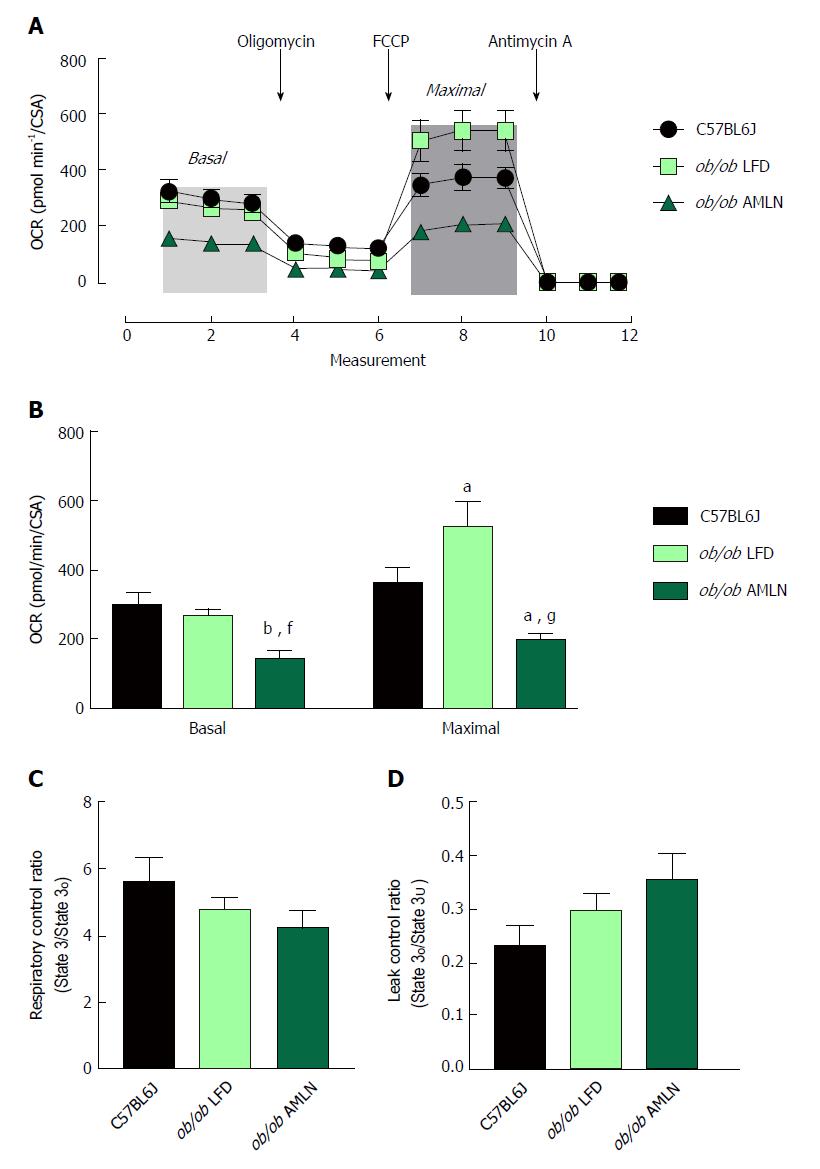
Figure 5 Mitochondria from ob/ob AMLN livers display reduced respiratory capacity and increased proton leak.
(A): Oxygen consumption of primary hepatocytes isolated from C57BL6J, ob/ob LFD and ob/ob AMLN livers normalized to mitochondrial content (citrate synthase activity, CSA). Changes in mitochondrial respiration in response to oligomycin, FCCP and antimycin A are shown. Light grey box = basal respiration, dark grey box = maximal uncoupled respiration; (B): Quantification of baseline oxygen consumption (basal respiration) and FCCP-stimulated oxygen consumption (maximal respiration) normalized to CSA; (C): Mitochondrial respiratory control ratio, a measure of mitochondrial coupling, defined as state 3/ state o respiration of mitochondria isolated from the livers of C57BL6J, ob/ob LFD and ob/ob AMLN mice; (D): Mitochondrial leaking control ratio, a measure of proton leak, defined as state o/ state 3U respiration. aP ≤ 0.05, bP ≤ 0.01, vs C57BL6J; fP ≤ 0.01, gP ≤ 0.001, vs LFD. LFD: Low-fat diet.
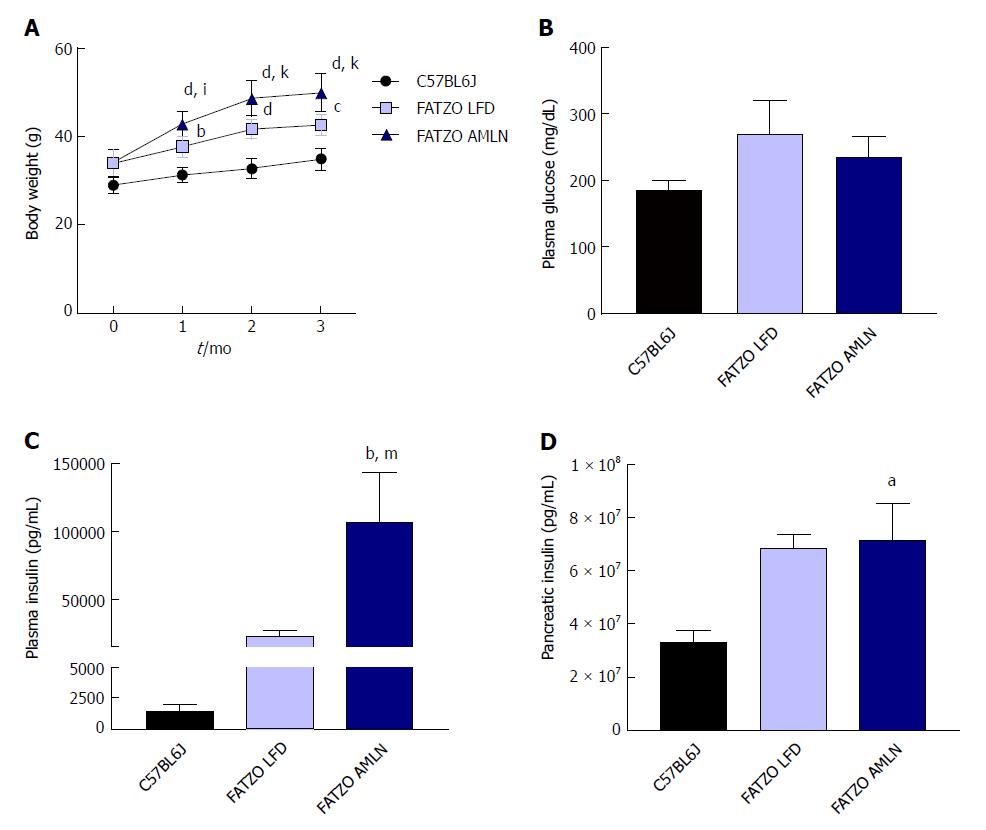
Figure 6 AMLN diet exacerbates obesity and hyperinsulinemia in FATZO mice.
(A): Average body weight over 12-wk disease induction period; (B): Terminal non-fasting blood glucose levels; (C): Terminal non-fasting plasma insulin levels; (D): Pancreatic insulin content. aP ≤ 0.05, bP ≤ 0.01, cP ≤ 0.001, dP ≤ 0.0001 vs C57BL6J; iP ≤ 0.05, kP ≤ 0.001, FATZO LFD; mP ≤ 0.05, FATZO AMLN unless noted otherwise. LFD: Low-fat diet.
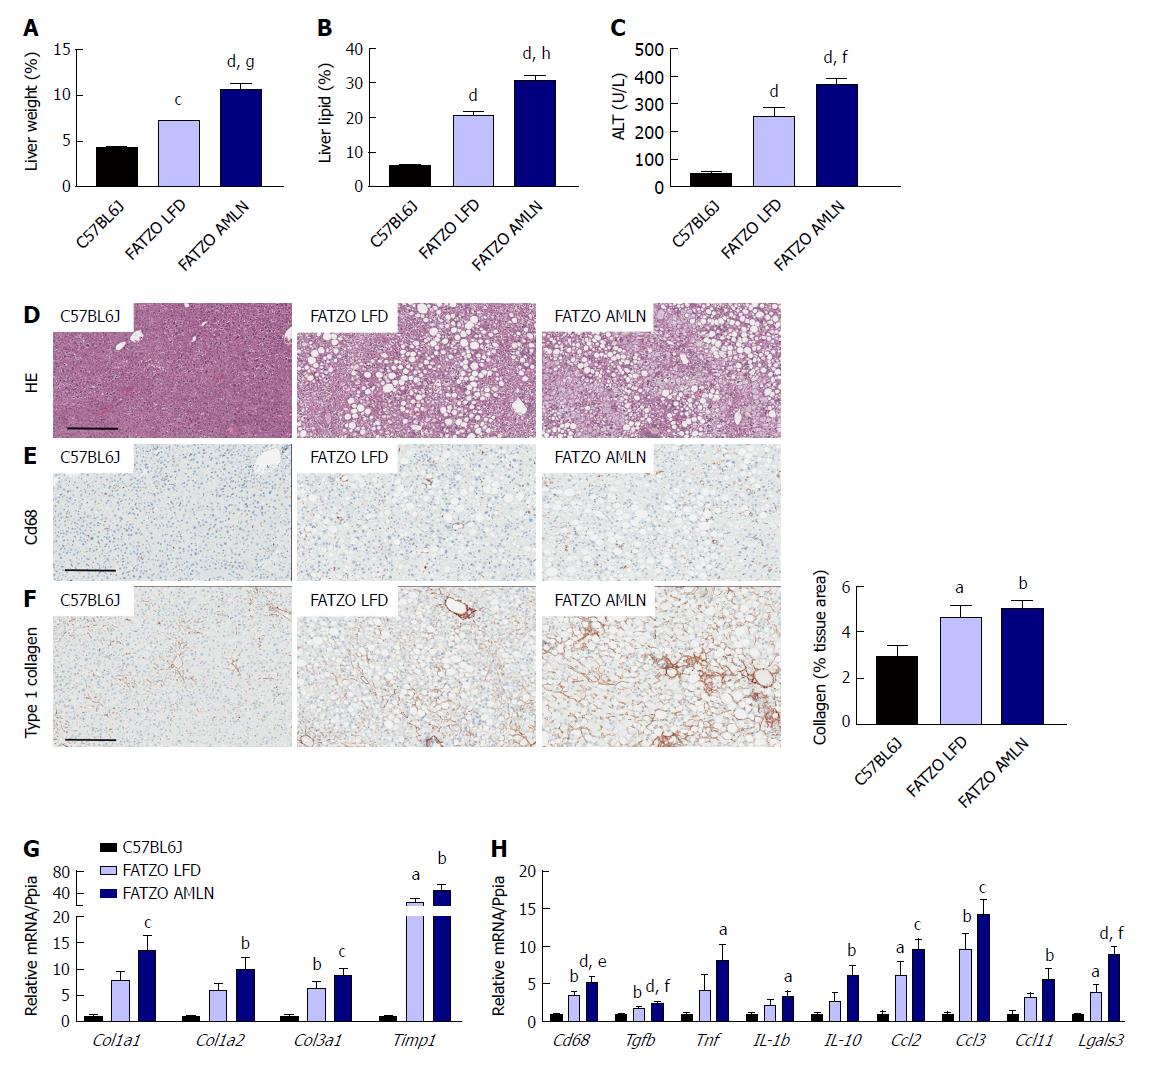
Figure 7 Comparison of metabolic and hepatic abnormalities associated with diet-induced nonalcoholic fatty liver disease/nonalcoholic steatohepatitis in FATZO mice.
Liver weight (A), liver lipid (B), and plasma alanine aminotransferase (ALT) levels (C) of lean (C57BL6J) and FATZO mice maintained on control LFD (FATZO LFD) or AMLN diet (FATZO AMLN) for 12 wk; (D): Representative hematoxylin and eosin stained liver sections and quantification of percentage of liver area containing macrosteatosis; (E): Representative CD68-stained liver sections; (F): Representative collagen type 1 alpha 1 stained liver sections and quantification of collagen area; (G, H): Hepatic expression of genes associated with fibrosis and inflammation. aP ≤ 0.05, bP ≤ 0.01, cP ≤ 0.001, dP ≤ 0.0001 vs C57BL6J; eP ≤ 0.05, fP ≤ 0.01, gP ≤ 0.001, hP ≤ 0.0001 vs LFD. LFD: Low-fat diet.
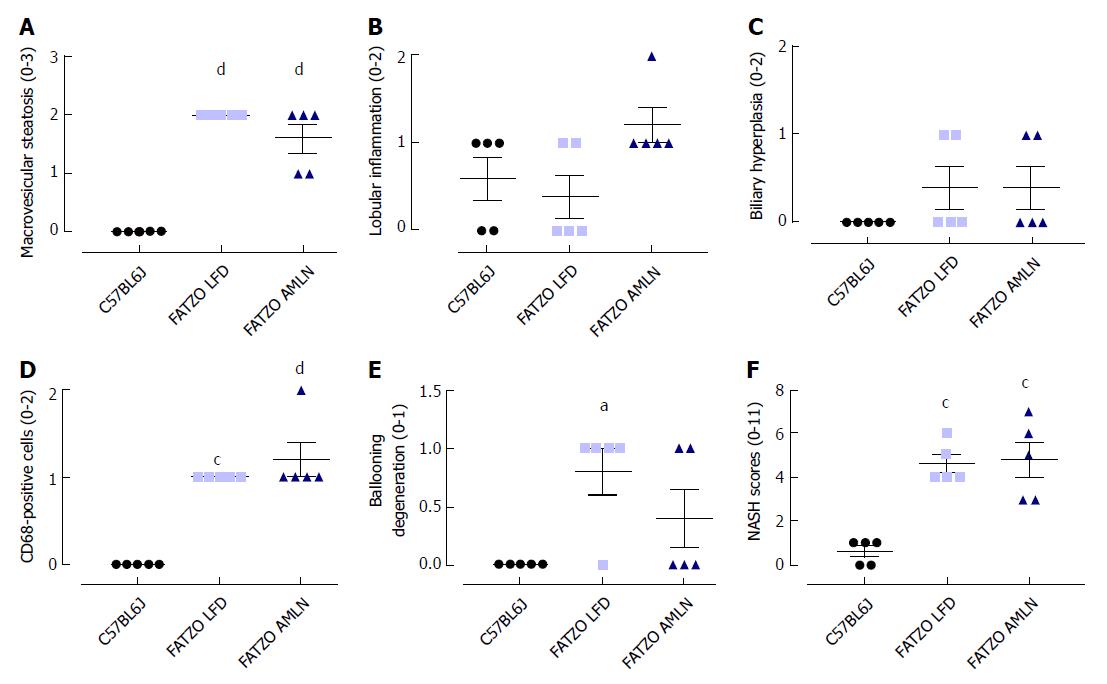
Figure 8 Histopathological scoring of FATZO mice.
Individual grades of macrovesicular steatosis (A), lobular inflammation (B), biliary hyperplasia (C), CD68-positive cells (D) and ballooning degeneration. (E) Composite NASH scores. aP ≤ 0.05, cP ≤ 0.001, dP ≤ 0.0001 vs C57BL6J.
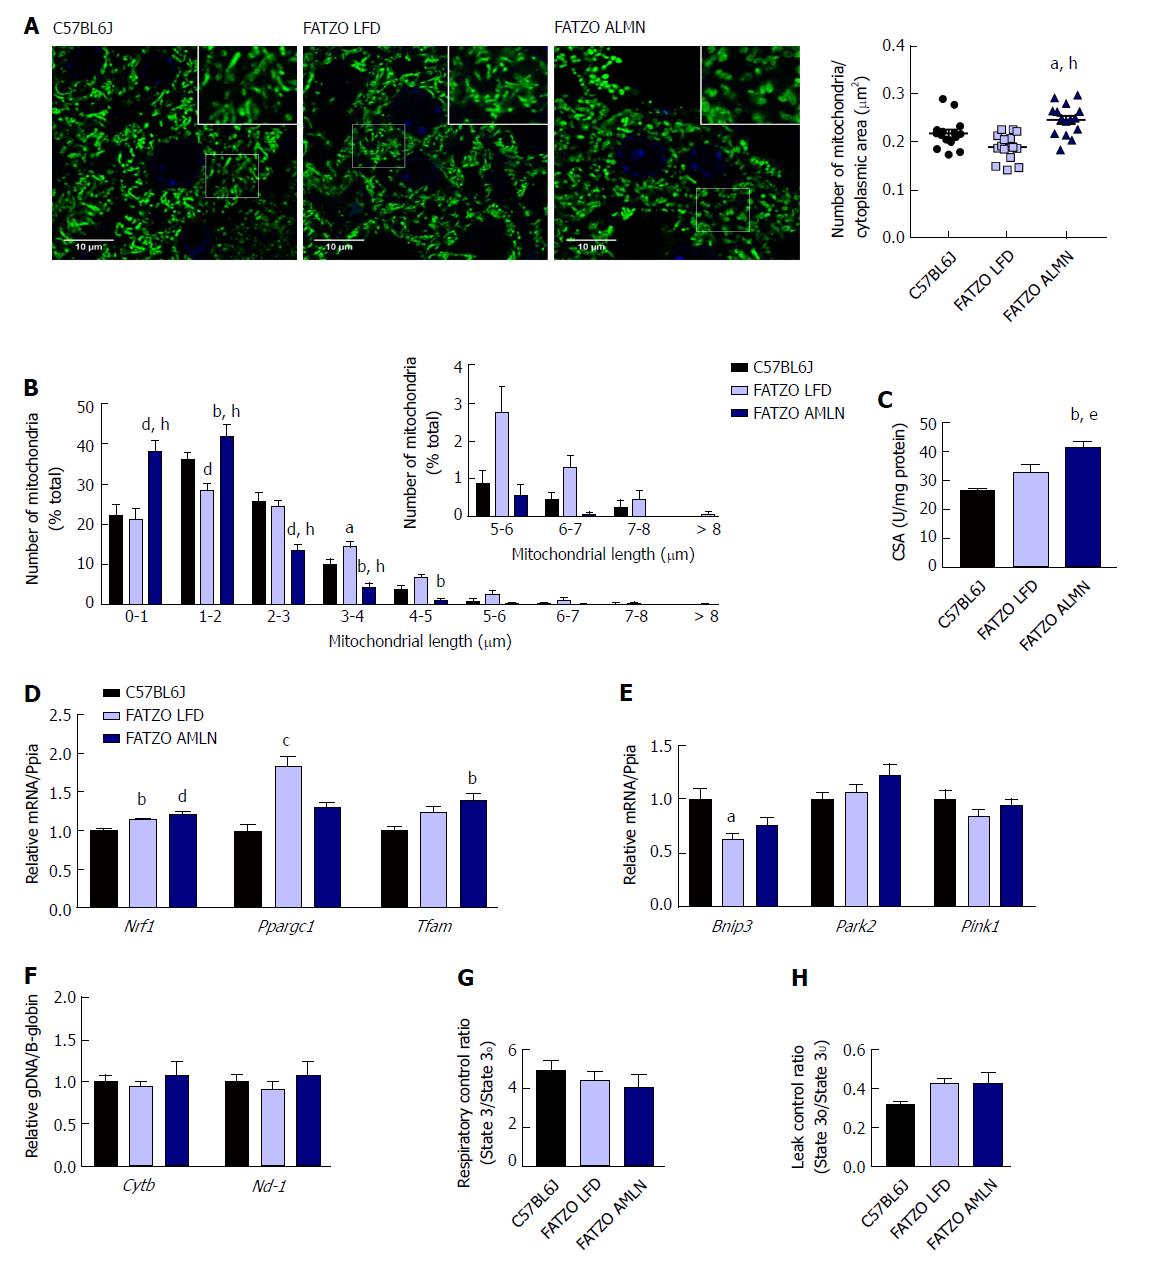
Figure 9 Mitochondrial content alterations in FATZO mice are associated with increased biogenesis and elevated proton leak.
(A): Confocal images of HSP60 stained liver sections with quantification of mitochondrial number per cytoplasmic area. Scale bar = 10 μm; (B): Histogram depicting the number of mitochondria per binned mitochondrial length as a percentage of total mitochondria per cell; (C): Mitochondrial content measured by citrate synthase activity of isolated hepatic mitochondria; (D): Expression of hepatic mitochondrial biogenesis genes; (E): Relative hepatic expression of mitophagy-associated genes; (F): Quantification of mitochondrial genome-encoded CytB or Nd1 relative to nuclear-encoded β- globin from total genomic DNA extracted from the liver; (G): Mitochondrial respiratory control ratio; (H): Mitochondrial leak control ratio. aP ≤ 0.05, bP ≤ 0.01, cP ≤ 0.001, dP ≤ 0.0001 vs C57BL6J; eP ≤ 0.05, hP ≤ 0.0001 vs LFD. LFD: Low-fat diet.
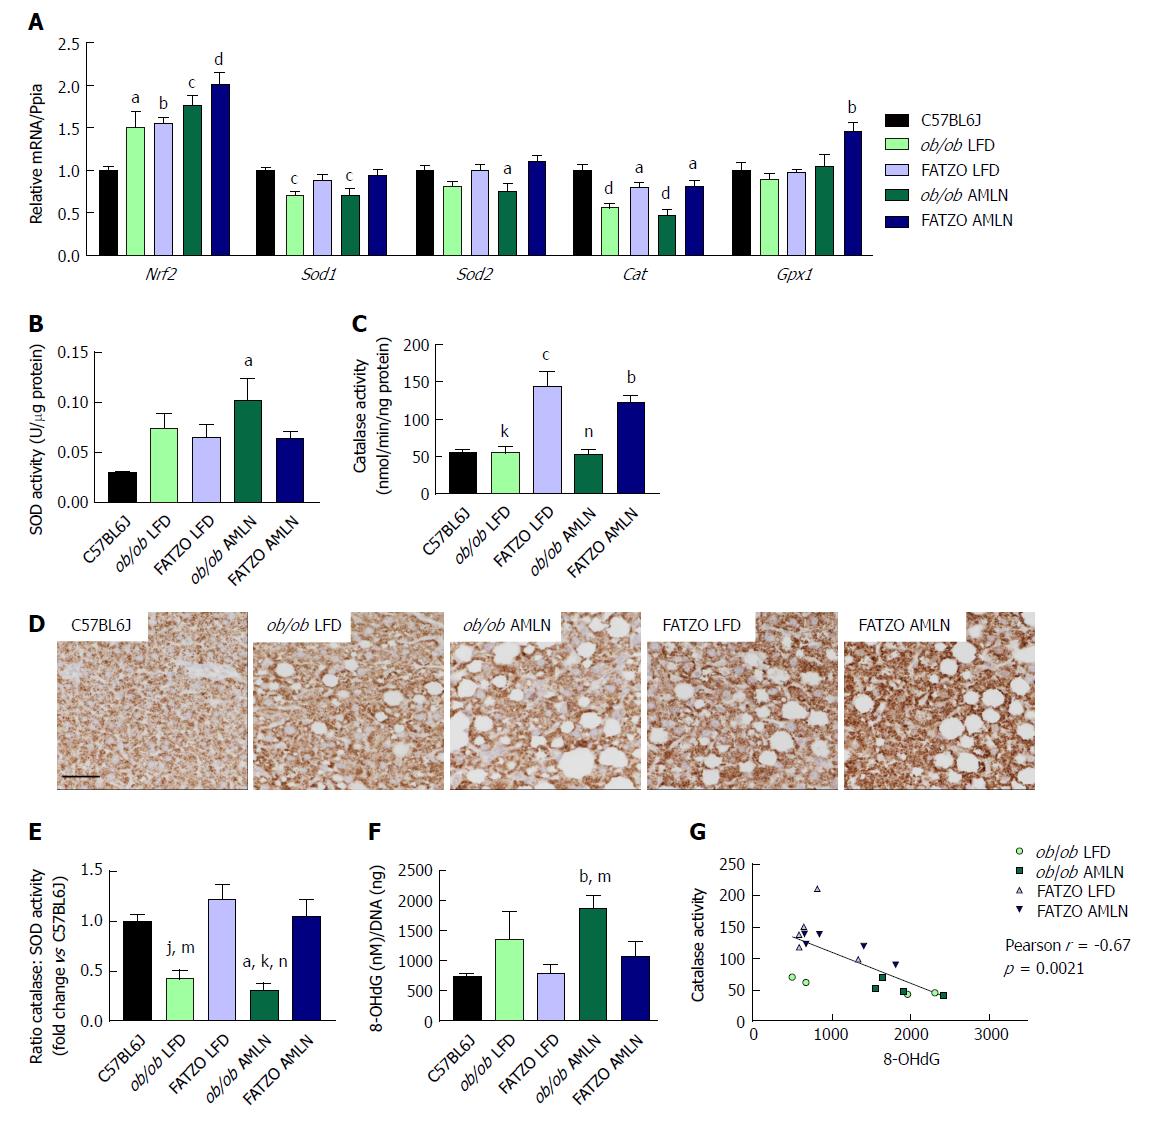
Figure 10 Hepatic oxidative stress is mitigated by increased catalase activity in FATZO but not ob/ob mice.
(A): Expression of antioxidant genes Nrf2, Sod1, Sod2, Cat and Gpx1 in ob/ob LFD, FATZO LFD, ob/ob AMLN and FATZO AMLN livers relative to lean controls. Superoxide dismutase activity (B) and catalase activity (C) in hepatic lysates from C57BL6J, ob/ob LFD, FATZO LFD, ob/ob AMLN and FATZO AMLN animals; (D): Representative images of catalase stained liver sections. Scale bar represents 100 μm; (E): Ratio of catalase: SOD activities; (F): Levels of 8-hydroxydeoxyguanosine (8-OHdG) in genomic DNA isolated from C57BL6J, ob/ob LFD, FATZO LFD, ob/ob AMLN and FATZO AMLN livers; (G): Pearson’s correlation of catalase activity and 8-OHdG levels in ob/ob and FATZO livers. aP ≤ 0.05, bP ≤ 0.01, cP ≤ 0.001, dP ≤ 0.0001 vs C57BL6J; jP ≤ 0.01, kP ≤ 0.001, FATZO LFD; mP ≤ 0.05, nP ≤ 0.01, FATZO AMLN unless noted otherwise. LFD: Low-fat diet.
- Citation: Boland ML, Oldham S, Boland BB, Will S, Lapointe JM, Guionaud S, Rhodes CJ, Trevaskis JL. Nonalcoholic steatohepatitis severity is defined by a failure in compensatory antioxidant capacity in the setting of mitochondrial dysfunction. World J Gastroenterol 2018; 24(16): 1748-1765
- URL: https://www.wjgnet.com/1007-9327/full/v24/i16/1748.htm
- DOI: https://dx.doi.org/10.3748/wjg.v24.i16.1748


