Copyright
©The Author(s) 2018.
World J Gastroenterol. Apr 21, 2018; 24(15): 1650-1657
Published online Apr 21, 2018. doi: 10.3748/wjg.v24.i15.1650
Published online Apr 21, 2018. doi: 10.3748/wjg.v24.i15.1650
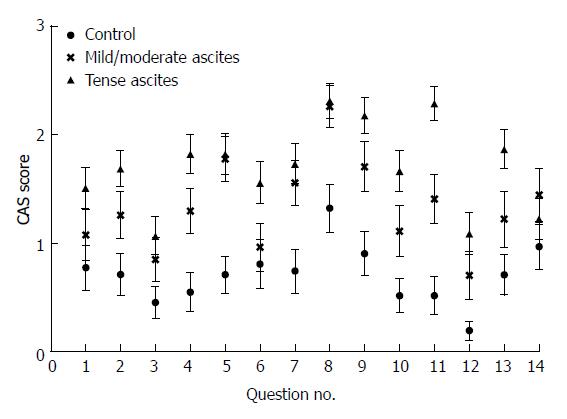
Figure 1 Mean cirrhosis-associated ascites symptom scores by question number and ascites severity.
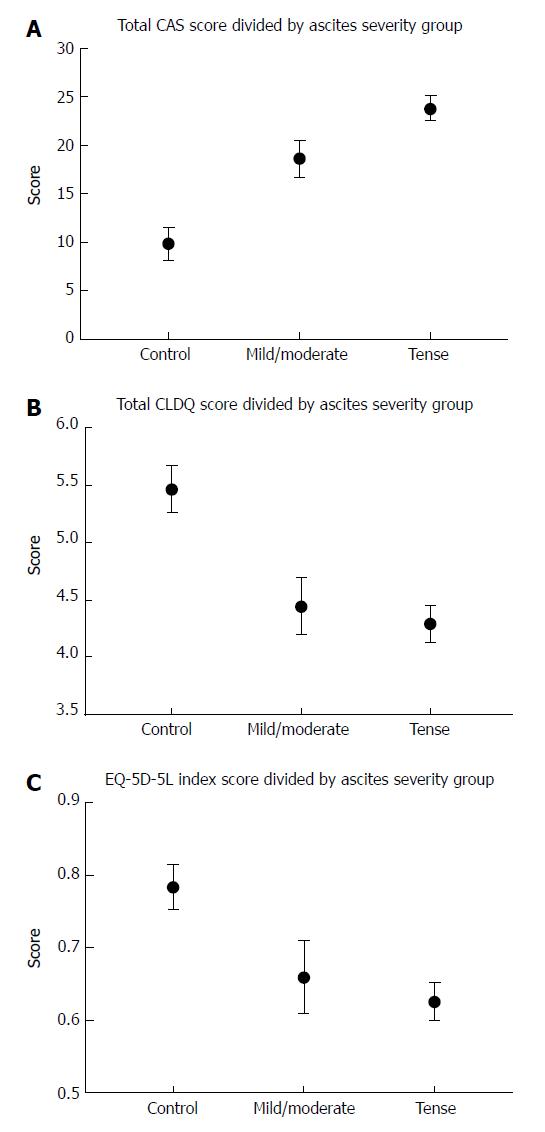
Figure 2 Median test scores with SEM divided by control, mild/moderate and tense ascites respectively.
A: CAS scale. Control vs mild/moderate, P < 0.001; control vs tense, P < 0.001; B: CLDQ. Control vs mild/moderate P = 0.002; Control vs tense, P < 0.001; C: EQ-5D-5L. Control vs mild/moderate, P = 0.038; Control vs tense, P = 0.002. CAS: Cirrhosis-associated ascites symptom scale; CLDQ: Chronic liver disease questionnaire; EQ-5D-5L: EuroQoL 5-Dimensions 5-Level scale questionnaire.
- Citation: Riedel AN, Kimer N, Jensen ASH, Dahl EK, Israelsen M, Aamann L, Gluud LL. Development and predictive validity of the cirrhosis-associated ascites symptom scale: A cohort study of 103 patients. World J Gastroenterol 2018; 24(15): 1650-1657
- URL: https://www.wjgnet.com/1007-9327/full/v24/i15/1650.htm
- DOI: https://dx.doi.org/10.3748/wjg.v24.i15.1650


