Copyright
©The Author(s) 2018.
World J Gastroenterol. Apr 21, 2018; 24(15): 1641-1649
Published online Apr 21, 2018. doi: 10.3748/wjg.v24.i15.1641
Published online Apr 21, 2018. doi: 10.3748/wjg.v24.i15.1641
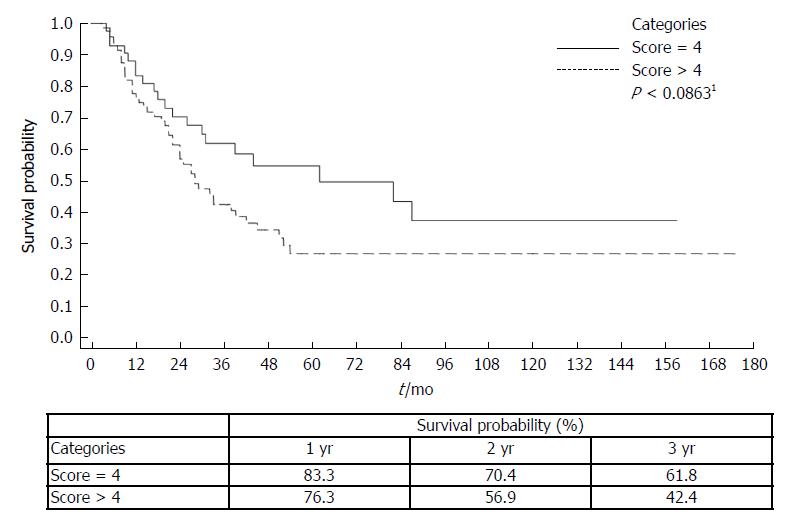
Figure 1 Kaplan-Meier survival plots between categories of aggressiveness Index, in total cohort.
Aggressiveness index as sum of scores, MTD (in tertiles): MTD < 4.5; 4.5 ≤ MTD ≤ 9.6; MTD > 9.6; scores 1, 2, 3 respectively; AFP (cut-off): AFP < 100; 100 ≤ AFP ≤ 1000; AFP > 1000 ng/mL; scores 1, 2, 3 respectively; PVT (no/yes): PVT (no); PVT (yes); scores 1, 3 respectively; Tumor nodules (number): Nodules ≤ 3; nodules > 3; scores 1, 3 respectively. 1Wilcoxon (breslow) test. MTD: Maximum tumor diameter; AFP: Alpha-fetoprotein; PVT: Portal vein thrombosis.
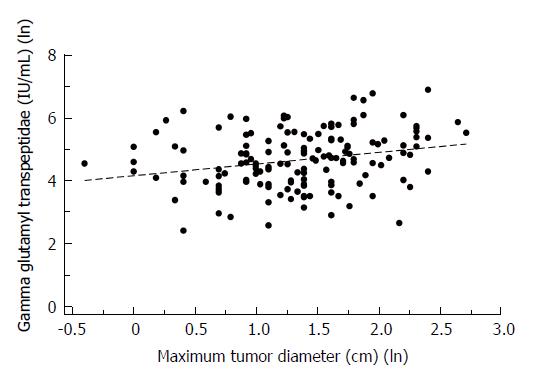
Figure 2 Scatterplots between maximum tumor diameter (cm) and gamma glutamyl transpeptidae (IU/mL) (Spearman's rho = 0.
2604, P = 0.0012), together with linear regression line of gamma glutamyl transpeptidae on maximum tumor diameter, in total cohort. All transformed into natural logarithm. ln, natural logarithm; Fitted values (-------).
- Citation: Ventura Y, Carr BI, Kori I, Guerra V, Shibolet O. Analysis of aggressiveness factors in hepatocellular carcinoma patients undergoing transarterial chemoembolization. World J Gastroenterol 2018; 24(15): 1641-1649
- URL: https://www.wjgnet.com/1007-9327/full/v24/i15/1641.htm
- DOI: https://dx.doi.org/10.3748/wjg.v24.i15.1641


