Copyright
©The Author(s) 2018.
World J Gastroenterol. Mar 28, 2018; 24(12): 1312-1320
Published online Mar 28, 2018. doi: 10.3748/wjg.v24.i12.1312
Published online Mar 28, 2018. doi: 10.3748/wjg.v24.i12.1312
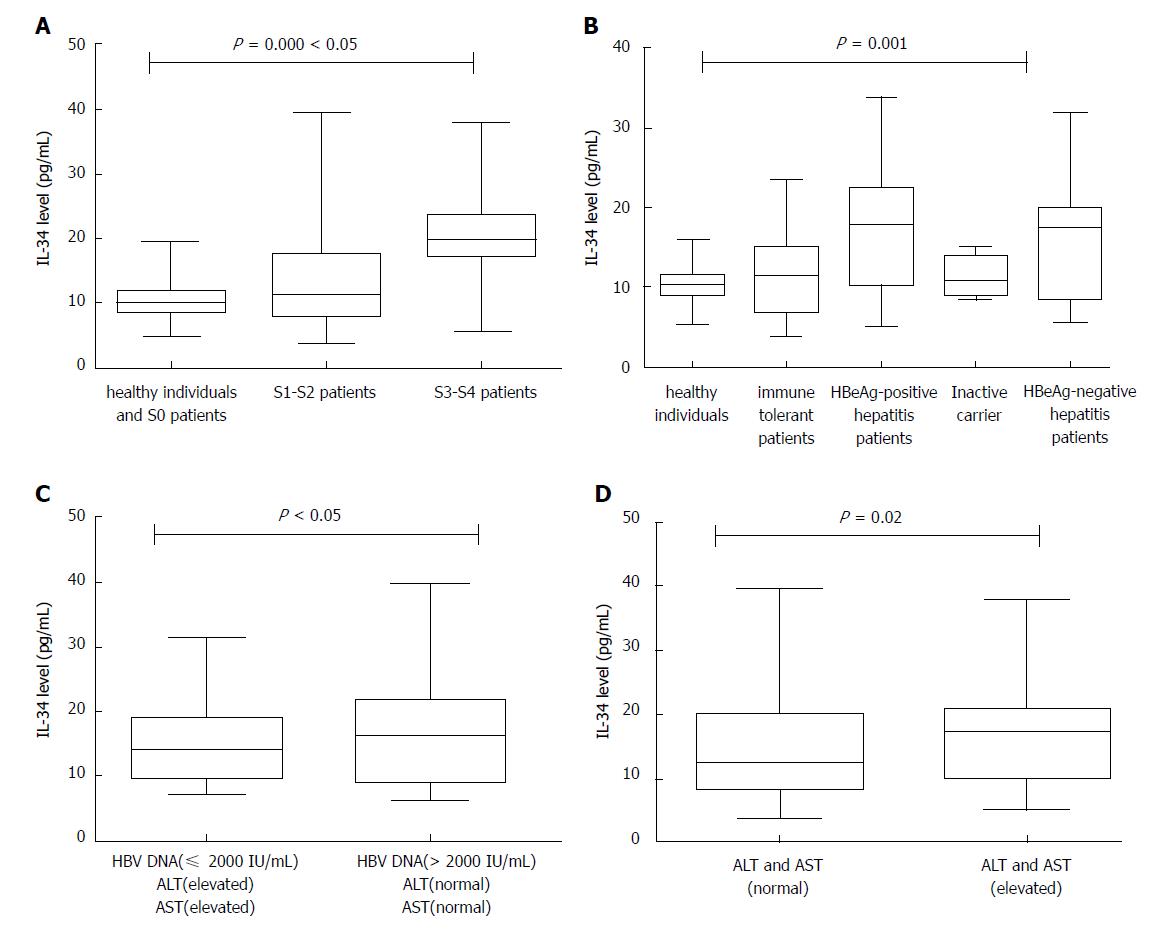
Figure 1 Box-and-whisker plots.
A: IL-34 levels in groups of patients with various stages of fibrosis; B: IL-34 levels in groups of different phases of chronic hepatitis B infection; C: IL-34 levels in two groups of HBeAg-negative patients: low viral load (HBV DNA level ≤ 2000 IU/mL) and elevated aminotransferase level; high viral load (HBV DNA level > 2000 IU/mL) and normal aminotransferase level; D: IL-34 levels in group of patients with normal aminotransferase or elevated aminotransferase level. IL: Interleukin; HBeAg: Hepatitis B e antigen; HBV: Hepatitis B virus.
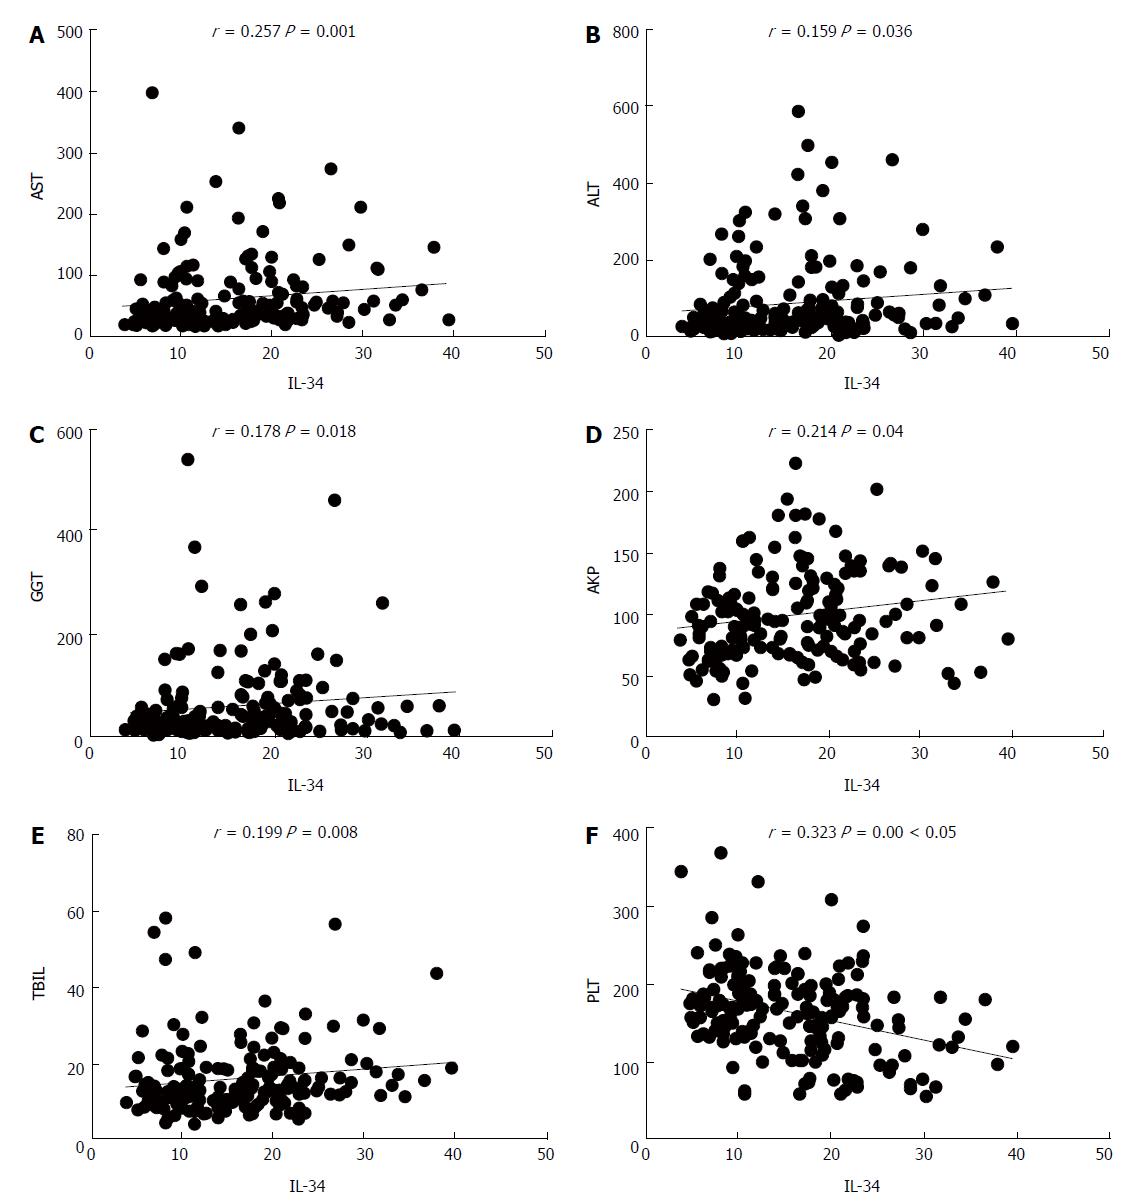
Figure 2 Correlation between IL-34 levels and other laboratory indexes.
A: AST; B: ALT; C: GGT; D: AKP; E: TBIL; F: PLT. AKP: Alkaline phosphatase; ALT: Alanine aminotransferase; AST: Aspartate aminotransferase; GGT: Gamma-glutamyl transferase; PLT: Platelet; TBIL: Total bilirubin.
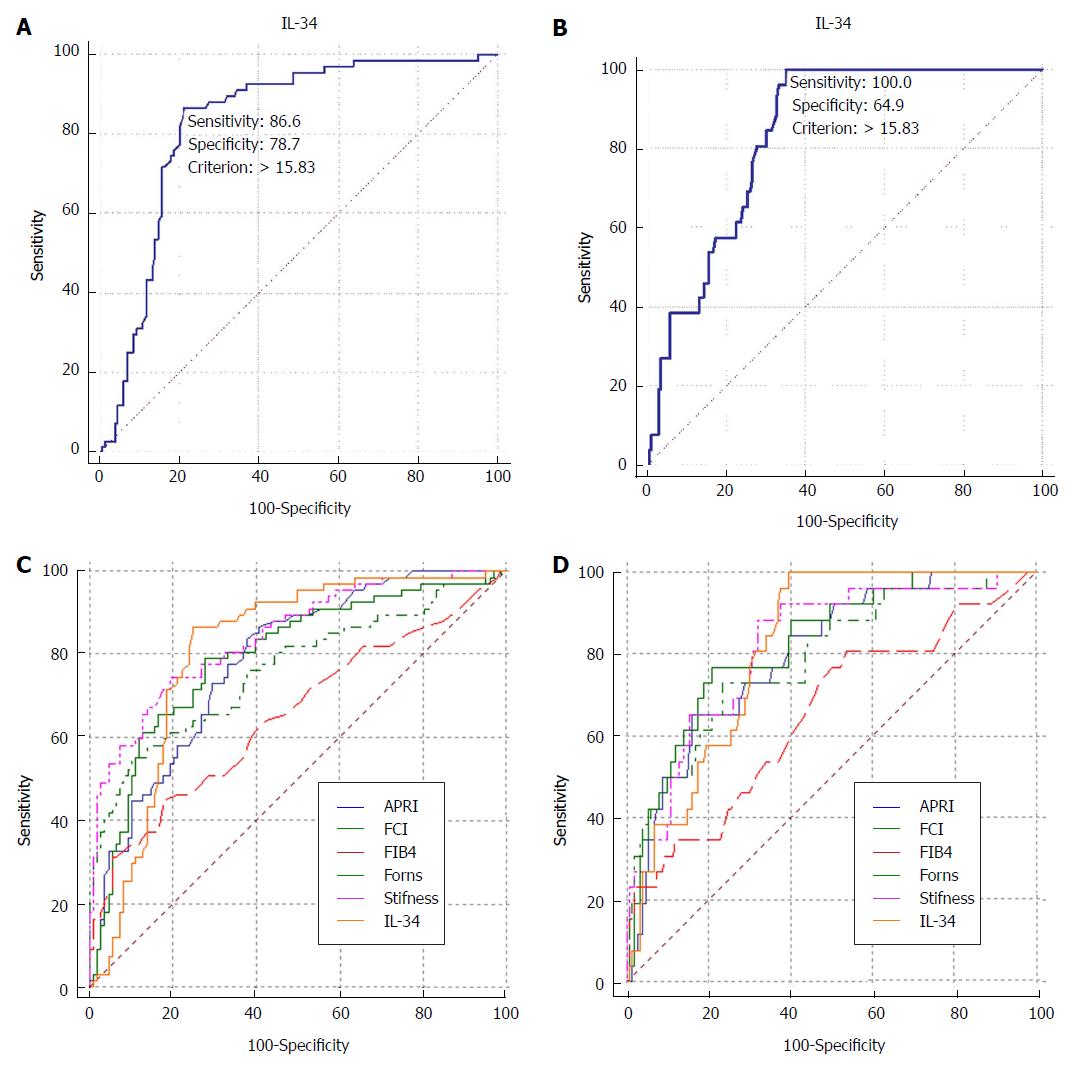
Figure 3 ROC curves, sensitivity and specificity.
A: ROC curve analysis for severe fibrosis (S3-S4); B: ROC curve analysis for early cirrhosis (S4); C: AUC comparison of IL-34 level, liver stiffness and other scores for the diagnosis of severe fibrosis (S3-S4); D: AUC comparison of IL-34 level, liver stiffness and other scores for the diagnosis of early cirrhosis (S4). APRI: Aspartate aminotransferase to platelet ratio index; AUC: Area under the curve; FCI: Fibrosis-cirrhosis index; FIB-4: Fibrosis-4; ROC: Receiver operating characteristic.
- Citation: Wang YQ, Cao WJ, Gao YF, Ye J, Zou GZ. Serum interleukin-34 level can be an indicator of liver fibrosis in patients with chronic hepatitis B virus infection. World J Gastroenterol 2018; 24(12): 1312-1320
- URL: https://www.wjgnet.com/1007-9327/full/v24/i12/1312.htm
- DOI: https://dx.doi.org/10.3748/wjg.v24.i12.1312


