Copyright
©The Author(s) 2018.
World J Gastroenterol. Jan 7, 2018; 24(1): 58-68
Published online Jan 7, 2018. doi: 10.3748/wjg.v24.i1.58
Published online Jan 7, 2018. doi: 10.3748/wjg.v24.i1.58
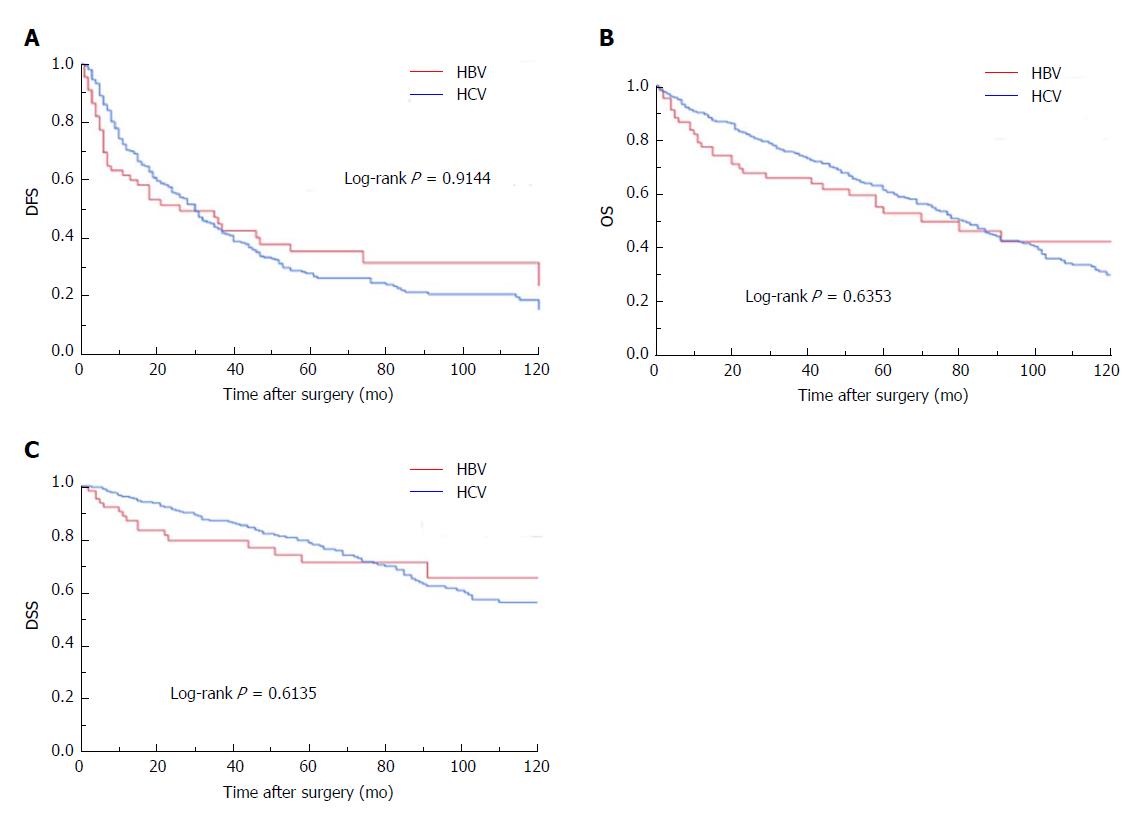
Figure 1 Kaplan-Meier curves according to viral infection status for disease-free survival (A), overall survival (B) and disease-specific survival (C).
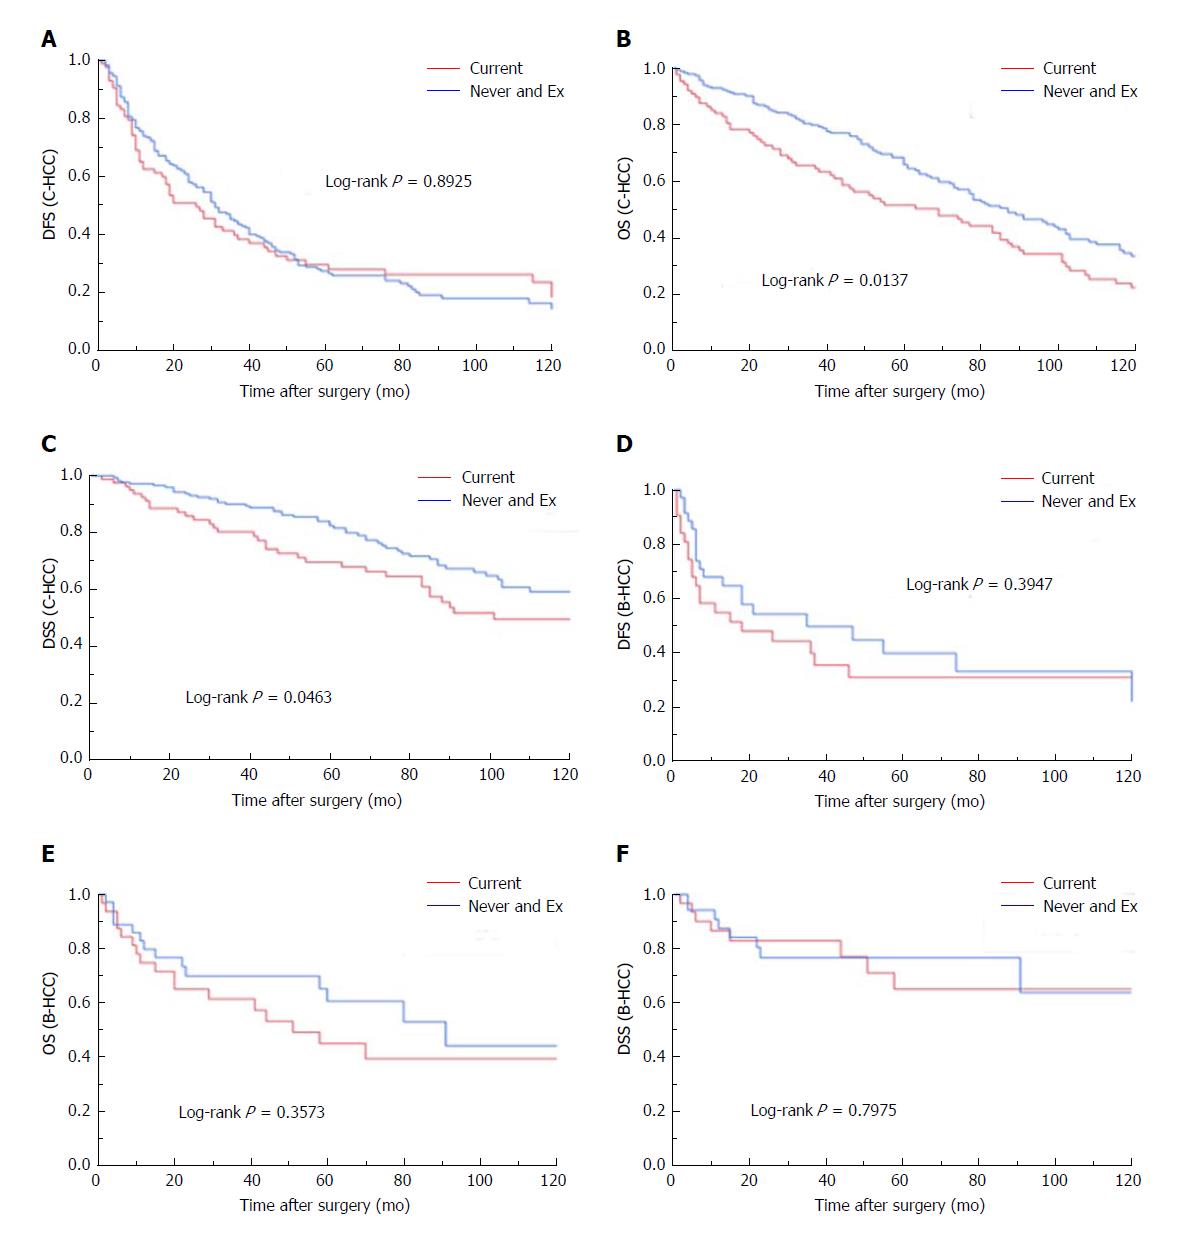
DFS: Disease-free survival; OS: Overall survival; DSS: Disease-specific survival.
Figure 2 Kaplan-Meier curves according to smoking status for disease-free survival, overall survival and disease-specific survival in the hepatitis C virus -related hepatocellular carcinoma patients (A-C) and hepatitis B virus-related hepatocellular carcinoma patients (D-F).
- Citation: Kai K, Komukai S, Koga H, Yamaji K, Ide T, Kawaguchi A, Aishima S, Noshiro H. Correlation between smoking habit and surgical outcomes on viral-associated hepatocellular carcinomas. World J Gastroenterol 2018; 24(1): 58-68
- URL: https://www.wjgnet.com/1007-9327/full/v24/i1/58.htm
- DOI: https://dx.doi.org/10.3748/wjg.v24.i1.58


