Copyright
©The Author(s) 2018.
World J Gastroenterol. Jan 7, 2018; 24(1): 23-34
Published online Jan 7, 2018. doi: 10.3748/wjg.v24.i1.23
Published online Jan 7, 2018. doi: 10.3748/wjg.v24.i1.23
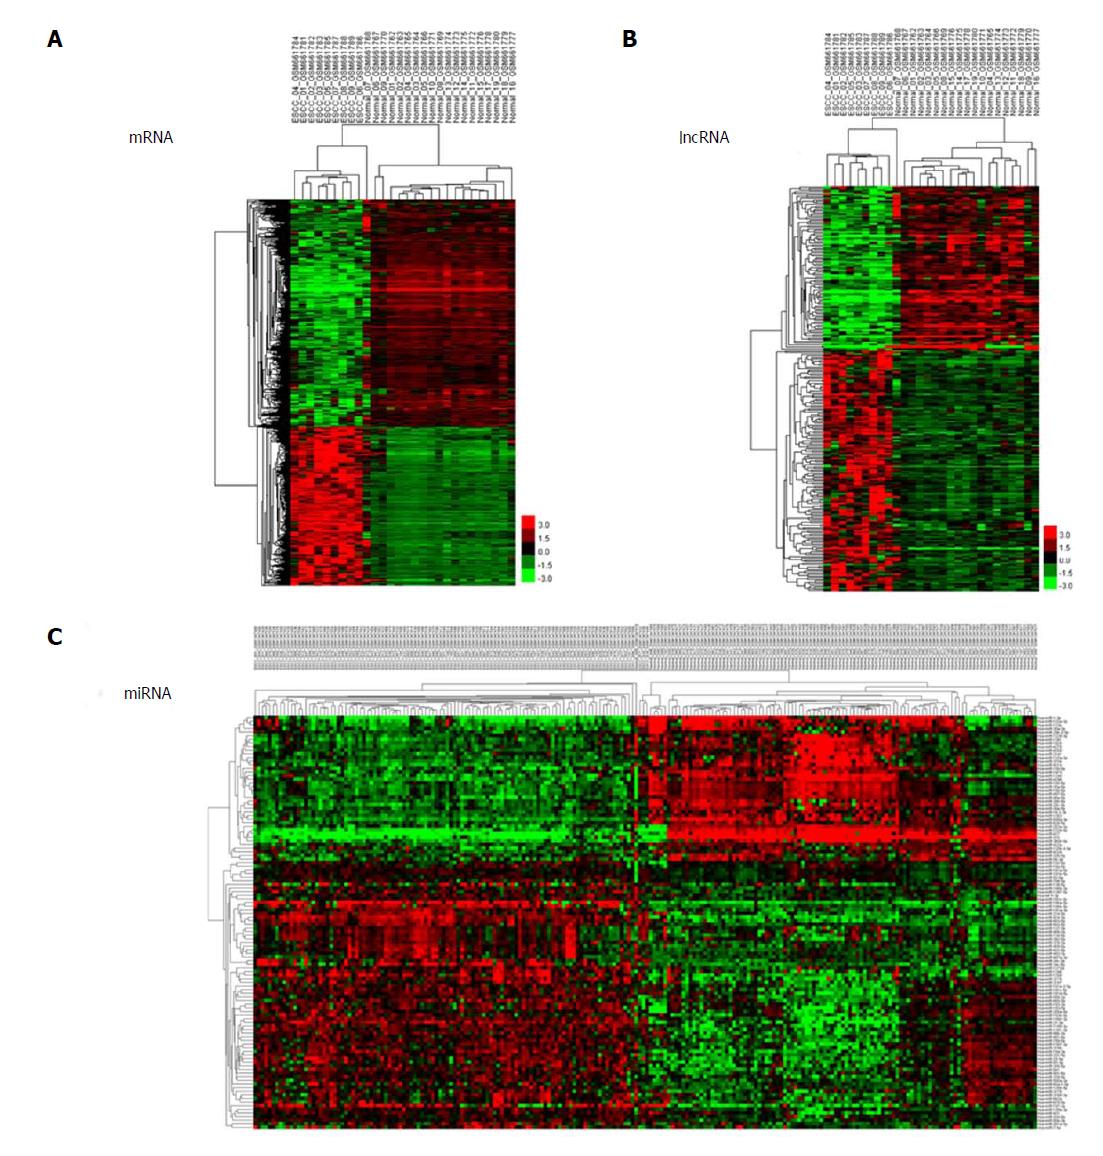
Figure 1 Cluster analysis of differentially expressed profiles.
A: mRNAs; B: lncRNAs; and C: miRNAs in tumour tissues vs adjacent non-tumour tissues. The result of hierarchical cluster analysis shows distinguishable expression profiles between samples. The rows show differentially expressed miRNAs, lncRNAs, and mRNAs, while the columns show three paired samples. Red represents high expression and green represents low expression.
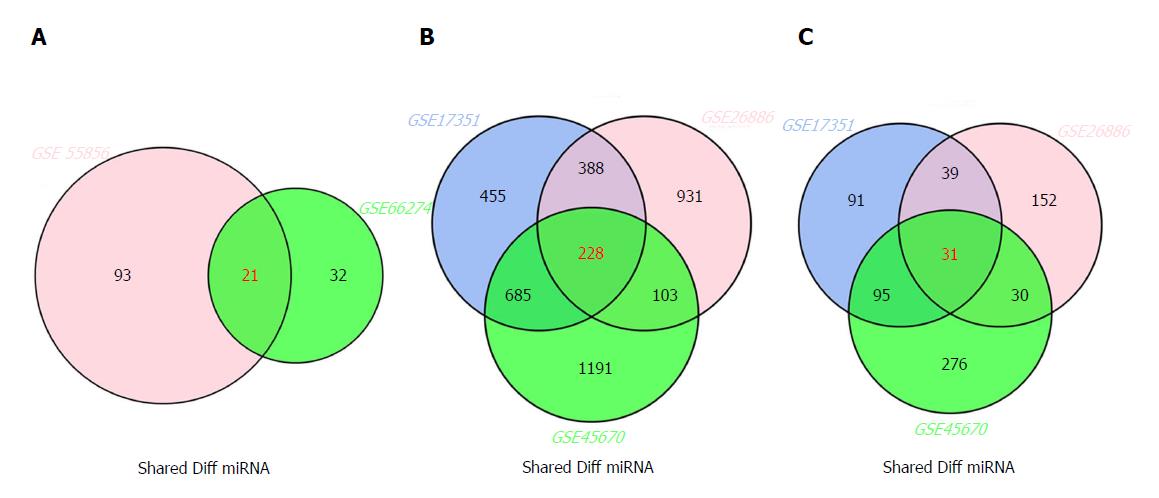
Figure 2 Venn diagram analysis of differentially expressed genes in comparison groups.
A: miRNAs; B: mRNAs; C: lncRNAs.
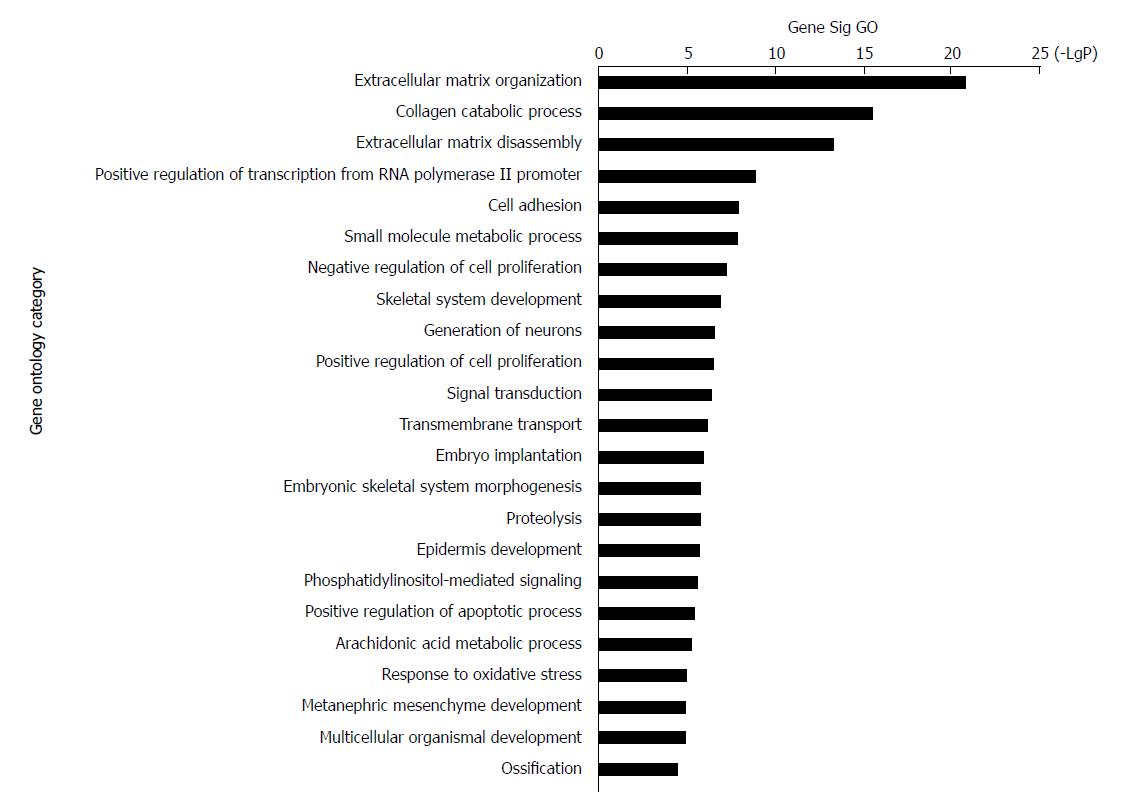
Figure 3 Top 23 GO enrichment terms for differentially expressed intersection mRNAs.
GO analysis of the common differentially expressed mRNAs was performed.
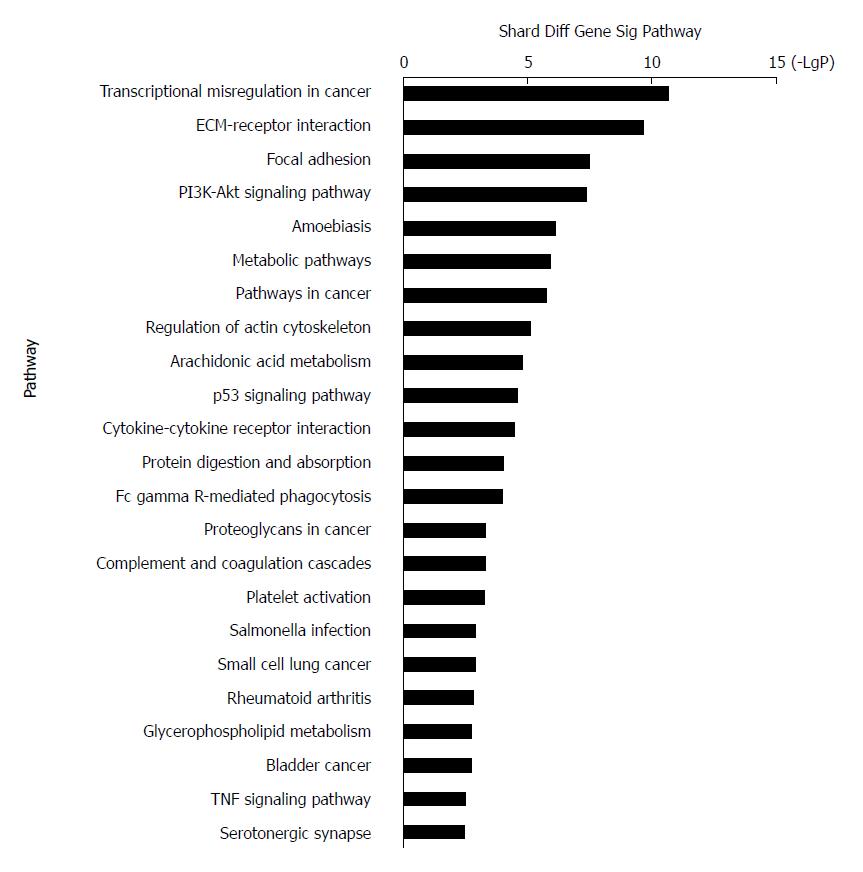
Figure 4 Top 23 pathway enrichment terms for differentially expressed intersection mRNAs.
KEGG pathway analysis of the common differentially expressed mRNAs was performed.
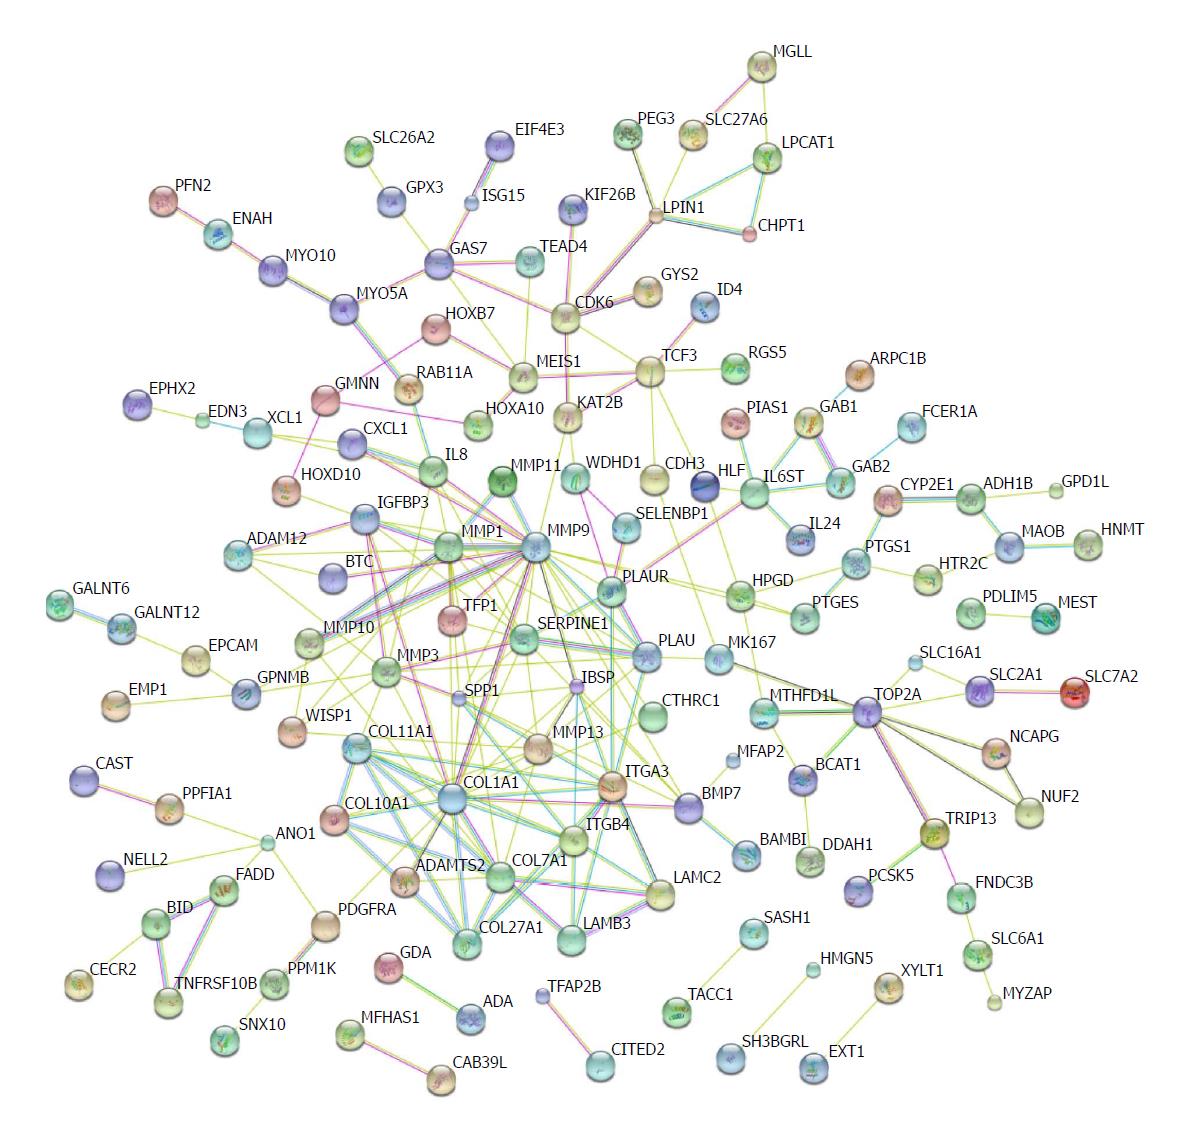
Figure 5 Protein regulation network analysis.
The protein-protein interaction networks were constructed by Cytoscape Software. Proteins are represented with colour nodes, and interactions are represented with edges.
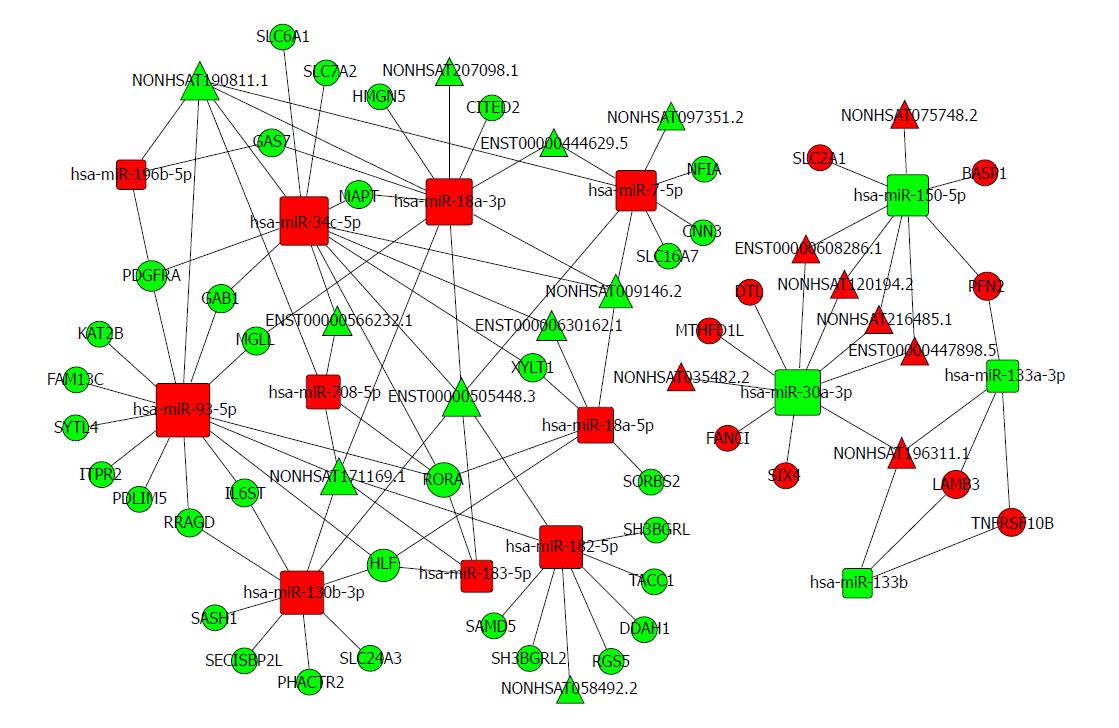
Figure 6 The lncRNA-miRNA-mRNA ceRNA network.
The rectangles indicate miRNAs and circles represent mRNAs. The red indicates up-regulation and green indicates down-regulation.
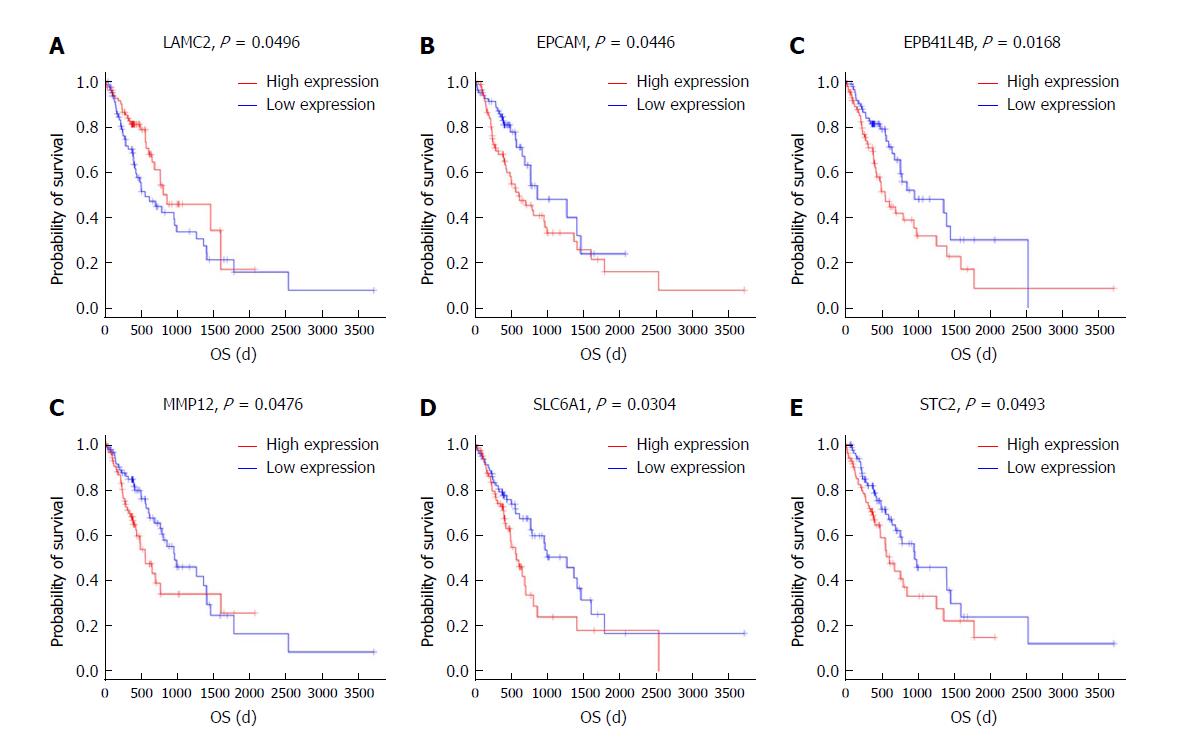
Figure 7 Kaplan-Meier survival curves for eight mRNAs associated with overall survival.
Log-rank tests were performed to evaluate the survival differences between the two curves. Horizontal axis: Overall survival time, days; Vertical axis: Survival function.
- Citation: Xue WH, Fan ZR, Li LF, Lu JL, Ma BJ, Kan QC, Zhao J. Construction of an oesophageal cancer-specific ceRNA network based on miRNA, lncRNA, and mRNA expression data. World J Gastroenterol 2018; 24(1): 23-34
- URL: https://www.wjgnet.com/1007-9327/full/v24/i1/23.htm
- DOI: https://dx.doi.org/10.3748/wjg.v24.i1.23


