Copyright
©The Author(s) 2017.
World J Gastroenterol. Mar 7, 2017; 23(9): 1576-1585
Published online Mar 7, 2017. doi: 10.3748/wjg.v23.i9.1576
Published online Mar 7, 2017. doi: 10.3748/wjg.v23.i9.1576
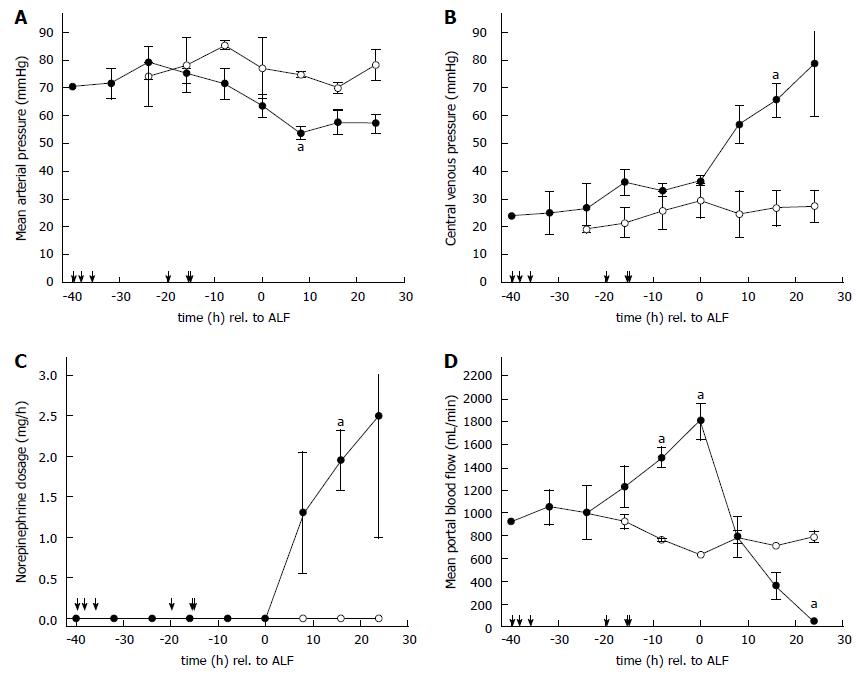
Figure 1 Profile of mean arterial pressure, central venous pressure, norepinephrine dosage and portal blood flow in sham operated and acetaminophen intoxicated animals.
The course of mean arterial pressure (A), central venous pressure (B), dosage of norepinephrine (C) and portal blood flow (D) in sham (white line) and acetaminophen intoxicated (black line) animals. All values are given as mean ± SE relative to the onset of acute liver failure (ALF) (in hours). Black arrows on x-axis indicate start of acetaminophen intoxication of individual animals. ap < 0.05 vs sham animals.
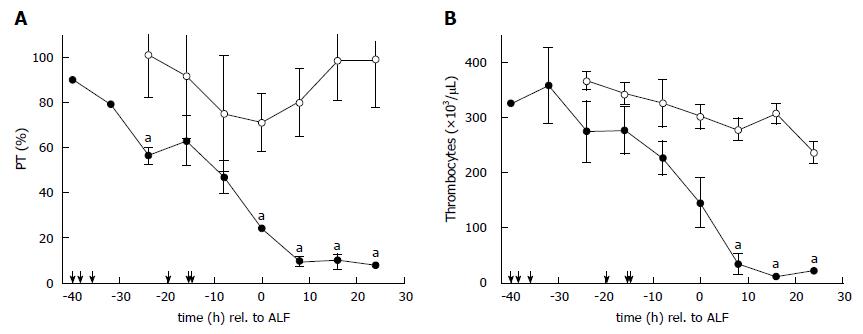
Figure 2 Profile of prothrombin time and thrombocytes in acetaminophen intoxicated and sham animals.
The course of prothrombin time (PT) (A) and thrombocytes (B) in sham (white line) and acetaminophen intoxicated (black line) animals. All values are given as mean ± SE relative to the first onset of ALF (in hours). Black arrows on the X-axis indicate start of acetaminophen intoxication of individual animals. ap < 0.05, vs sham animals. ALF: Acute liver failure.
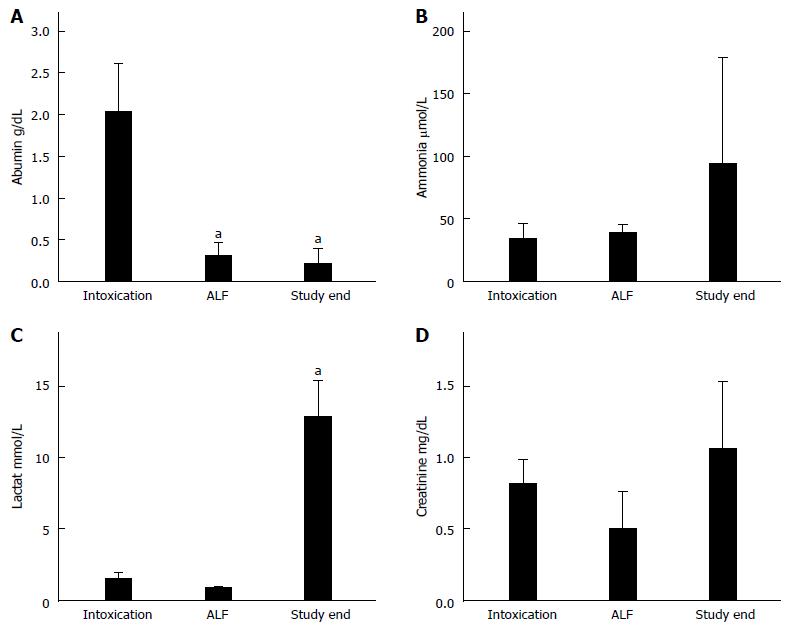
Figure 3 acute liver failure related laboratory parameters of acetaminophen intoxicated animals.
Box plot analysis of the selected laboratory values albumin (A), ammonia (B), lactate (C) and creatinine (D) at the moments: start of intoxication, ALF and study end. All values are given as mean ± SE. ap < 0.05, vs the moment start of intoxication. ALF: Acute liver failure.
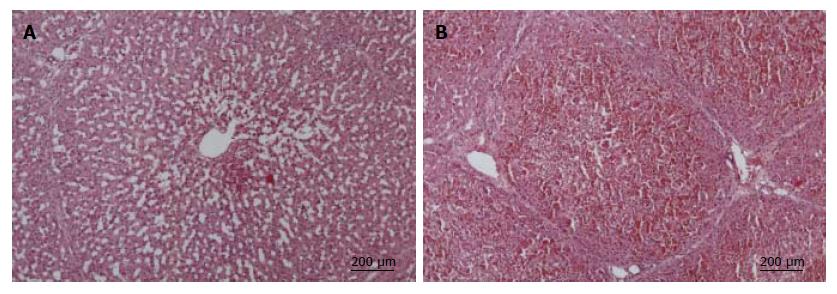
Figure 4 Light microscopic preparations (haematoxylin-eosin staining) of liver biopsies.
Biopsies taken 24 h after acetaminophen intoxication show enlarged liver sinus with beginning centrilobular necrosis. A: Exitus biopsy shows progedient centrilobular necrosis; B: Bar indicates 200 µm; objective magnification × 20.
- Citation: Thiel K, Klingert W, Klingert K, Morgalla MH, Schuhmann MU, Leckie P, Sharifi Y, Davies NA, Jalan R, Peter A, Grasshoff C, Königsrainer A, Schenk M, Thiel C. Porcine model characterizing various parameters assessing the outcome after acetaminophen intoxication induced acute liver failure. World J Gastroenterol 2017; 23(9): 1576-1585
- URL: https://www.wjgnet.com/1007-9327/full/v23/i9/1576.htm
- DOI: https://dx.doi.org/10.3748/wjg.v23.i9.1576


