Copyright
©The Author(s) 2017.
World J Gastroenterol. Mar 7, 2017; 23(9): 1568-1575
Published online Mar 7, 2017. doi: 10.3748/wjg.v23.i9.1568
Published online Mar 7, 2017. doi: 10.3748/wjg.v23.i9.1568
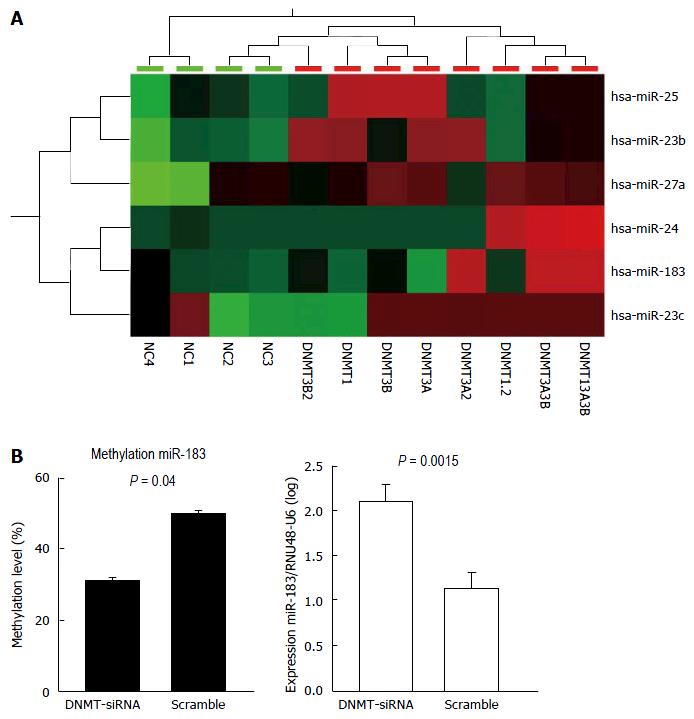
Figure 1 Upregulated microRNAs after DNA methyltransferases knockdown (A); and Methylation and expression changes of hsa-miR-183 after DNA methyltransferases knockdown (B).
A: Cluster analysis after single and combined DNMT knockdown using siRNAs (as indicated in the lower panel) shows upregulation of selected microRNAs (right panel). High, intermediate, and low microRNA expression levels in the heatmap are indicated with red, black, and green, respectively. B: Upon DNMT1 knockdown in HLE cell lines, DNA methylation at the promoter of miR-183 decreased significantly (right panel, P = 0.0015) accompanied by elevated miR-183 expression (left panel, P = 0.04). NC = negative control siRNA and DNMT (1, 3A, 3B) = DNA methyl transferase 1, -3A, -3B siRNA treated samples. DNMT: DNA methyltransferase.
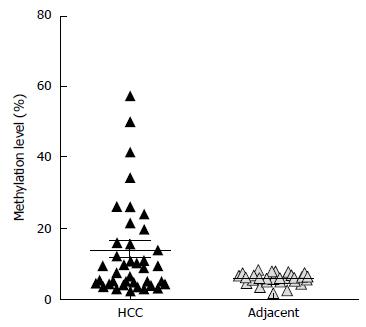
Figure 2 Differential DNA methylation at hsa-mir-183 promoter in primary hepatocellular carcinoma specimens compared to the adjacent liver tissues.
High-resolution quantitative DNA methylation analysis using pyrosequencing shows 30% of HCC samples with hypermethylation. "Hypermethylation" was defined as described in Materials and Methods. HCC: Hepatocellular carcinoma.
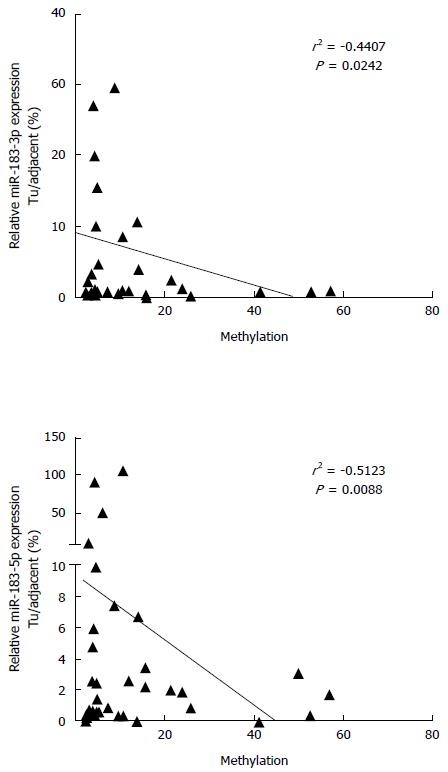
Figure 3 DNA hypermethylation leads to repression of hsas-miR-183 transcription.
Shown are scatter plots demonstrating negative correlation between DNA methylation levels and miR-183 expression case by case.
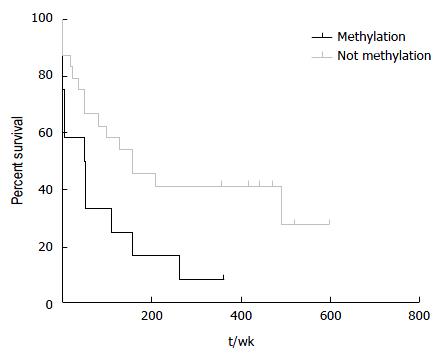
Figure 4 Hypermethylation at hsa-miR-183 significantly correlates with worse survival in hepatocellular carcinoma.
The Kaplan-Meier plot shows comparison of HCC patient survival between those with hypermethylated and non-methylated hsa-miR-183 locus (log-rank test P = 0.03, median survivals are 49.5 and 150 wk for patients with hypermethylation and without increased methylation at hsa-miR-183 locus respectively). HCC: Hepatocellular carcinoma.
- Citation: Anwar SL, Krech T, Hasemeier B, Schipper E, Schweitzer N, Vogel A, Kreipe H, Buurman R, Skawran B, Lehmann U. hsa-mir-183 is frequently methylated and related to poor survival in human hepatocellular carcinoma. World J Gastroenterol 2017; 23(9): 1568-1575
- URL: https://www.wjgnet.com/1007-9327/full/v23/i9/1568.htm
- DOI: https://dx.doi.org/10.3748/wjg.v23.i9.1568


