Copyright
©The Author(s) 2017.
World J Gastroenterol. Feb 28, 2017; 23(8): 1375-1386
Published online Feb 28, 2017. doi: 10.3748/wjg.v23.i8.1375
Published online Feb 28, 2017. doi: 10.3748/wjg.v23.i8.1375
Figure 1 Hydrogen-rich water decreases the weight loss and achieves a lower disease activity index score in dextran sulfate sodium-induced inflammatory bowel disease.
The changes in weight and disease activity index were assessed on the 7th d after inflammatory bowel disease (IBD) modeling. n = 6, mean ± SEM, aP < 0.05 vs control group; bP < 0.05 vs dextran sulfate sodium (DSS) group. HRW: Hydrogen-rich water.
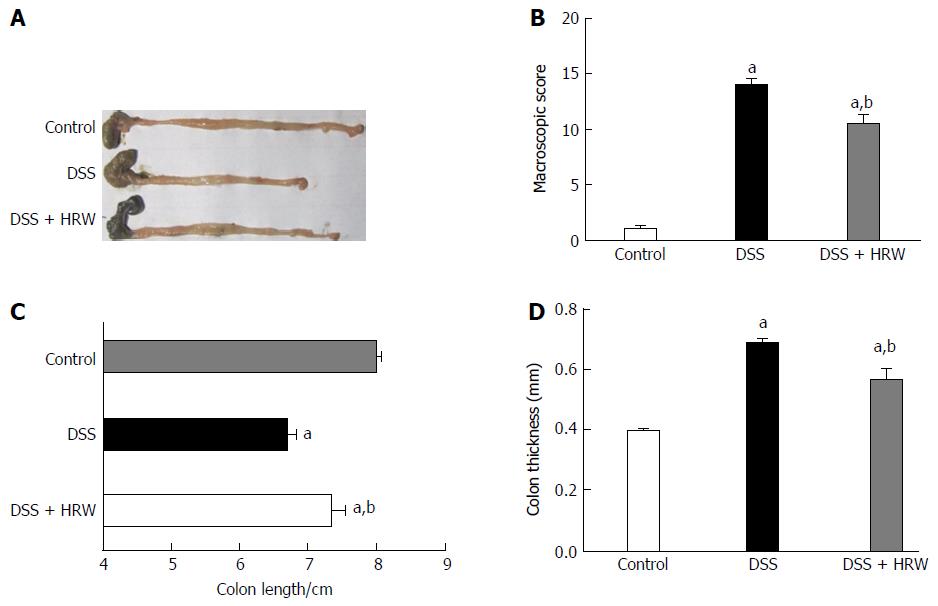
Figure 2 Hydrogen-rich water alleviates the changes in colon length, thickness and macroscopic score in dextran sulfate sodium-induced inflammatory bowel disease.
Mice were sacrificed, and the colons were rapidly removed and processed for analysis on the 7th d after inflammatory bowel disease (IBD) modeling. A: The representative pictures of the colons in each group; B-D: The macroscopic score, length, and the thickness of the colons from each group. n = 6, mean ± SEM, aP < 0.05 vs control group; bP < 0.05 vs dextran sulfate sodium (DSS) group. HRW: Hydrogen-rich water.
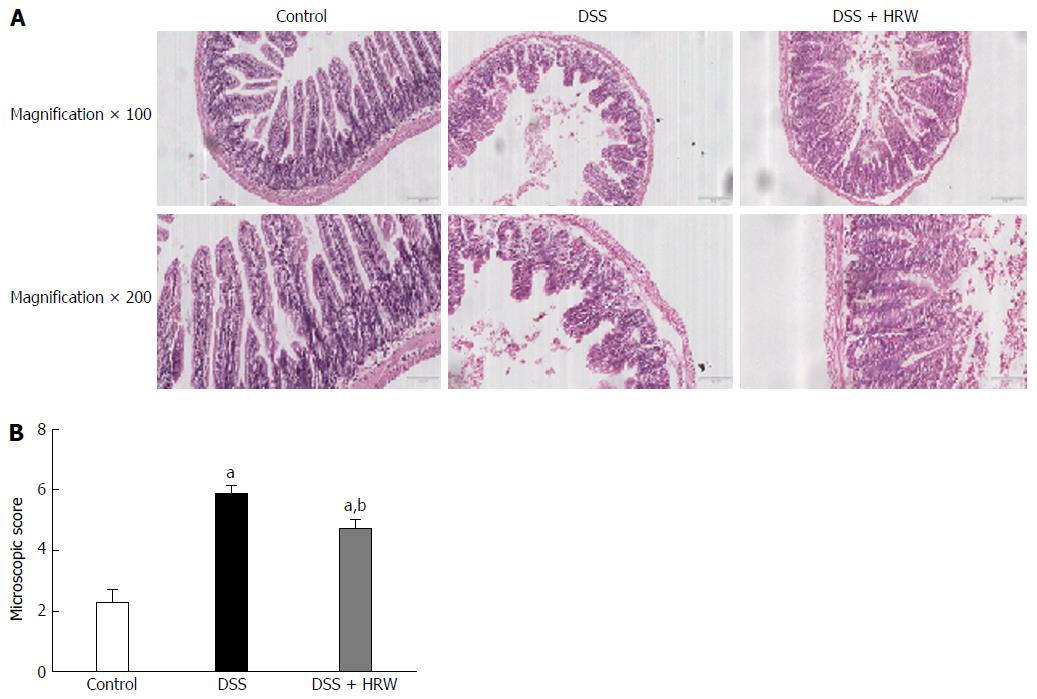
Figure 3 Hydrogen-rich water alleviates the changes in histological studies and microscopic score in dextran sulfate sodium-induced inflammatory bowel disease.
Mice were sacrificed, and the colons were rapidly removed and processed for analysis on the 7th d after inflammatory bowel disease (IBD) modeling. A: Hematoxylin-eosin staining of colon tissues (magnification × 100, 200); B: The microscopic score of the colon in each group. n = 6, mean ± SEM, aP < 0.05 vs control group; bP < 0.05 vs dextran sulfate sodium (DSS) group. HRW: Hydrogen-rich water.
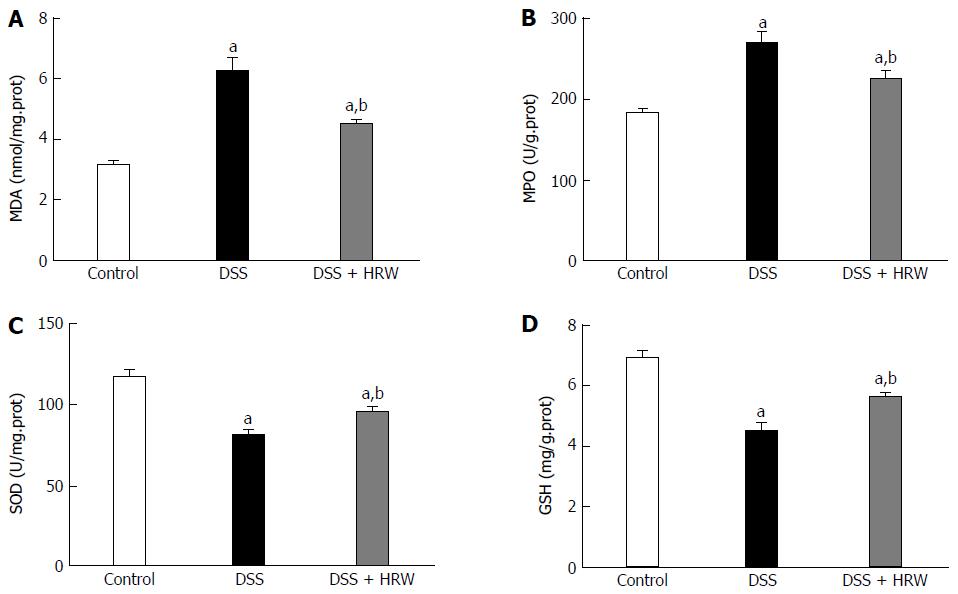
Figure 4 Hydrogen-rich water decreases the oxidative stress in dextran sulfate sodium-induced inflammatory bowel disease.
On the 7th d after inflammatory bowel disease (IBD) modeling, the colon tissues were harvested to evaluate the oxidative stress. The levels of MDA, MPO, SOD and GSH in the colon tissues were measured. n = 6, mean ± SEM, aP < 0.05 vs control group; bP < 0.05 vs dextran sulfate sodium (DSS) group. HRW: Hydrogen-rich water; MDA: Malonaldehyde; SOD: Superoxide dismutase; GSH: Glutathione.
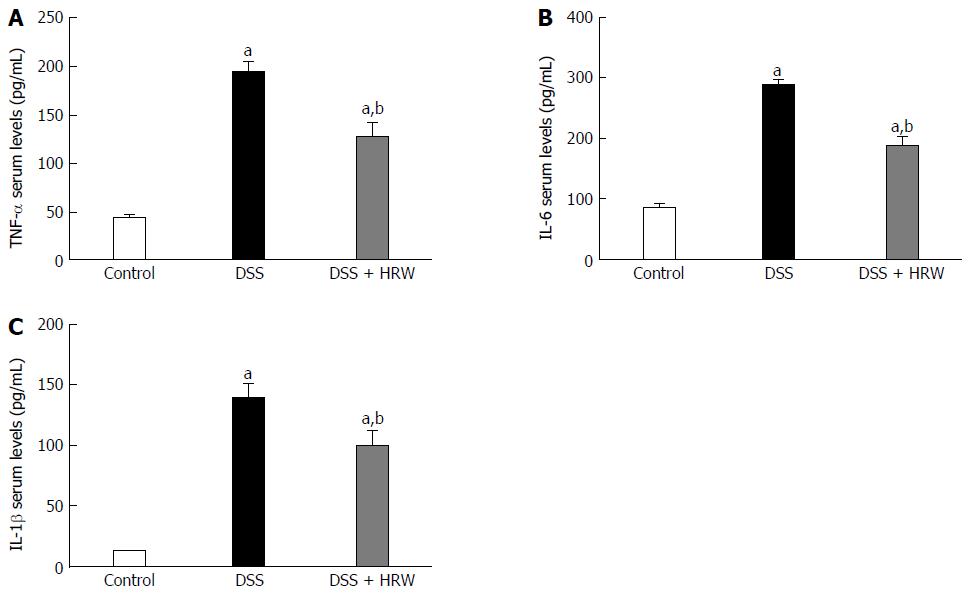
Figure 5 Hydrogen-rich water decreases inflammatory factors in dextran sulfate sodium-induced inflammatory bowel disease.
On the 7th d after inflammatory bowel disease (IBD) modeling, the blood samples were harvested to evaluate the oxidative stress. HRW reduced the serum TNF-α, IL-6 and IL-1β concentrations (A-C). n = 6, mean ± SEM, aP < 0.05 vs control group; bP < 0.05 vs dextran sulfate sodium (DSS) group. HRW: Hydrogen-rich water.
Figure 6 Hydrogen-rich water inhibits endoplasmic reticulum stress in DSS-induced inflammatory bowel disease.
On the 7th d after inflammatory bowel disease (IBD) modeling, the colon tissues were harvested to evaluate the endoplasmic reticulum stress. Western blot analysis was conducted to evaluate the protein contents of p-eIF2α, ATF4, XBP1s and CHOP. β-actin was used as an internal control. n = 6, mean ± SEM, aP < 0.05 vs control group; bP < 0.05 vs dextran sulfate sodium (DSS) group. HRW: Hydrogen-rich water.
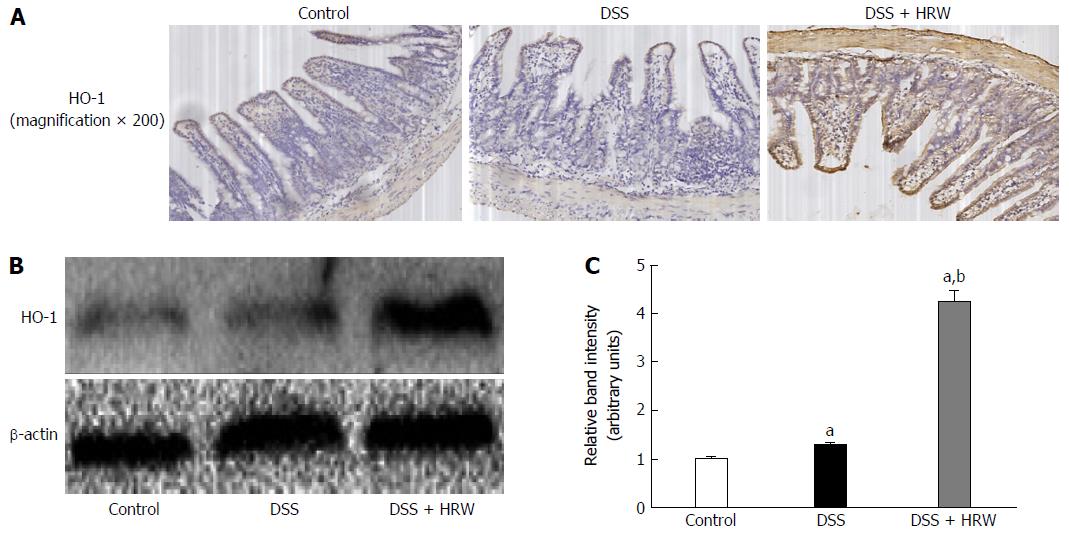
Figure 7 Hydrogen-rich water up-regulates expression of heme oxygenase-1 in dextran sulfate sodium-induced inflammatory bowel disease.
On the 7th d after inflammatory bowel disease (IBD) modeling, the colon tissues were harvested and Western blot analysis was conducted to evaluate the level of heme oxygenase-1 (HO-1). n = 6, mean ± SEM, aP < 0.05 vs control group; bP < 0.05 vs dextran sulfate sodium (DSS) group. HRW: Hydrogen-rich water.
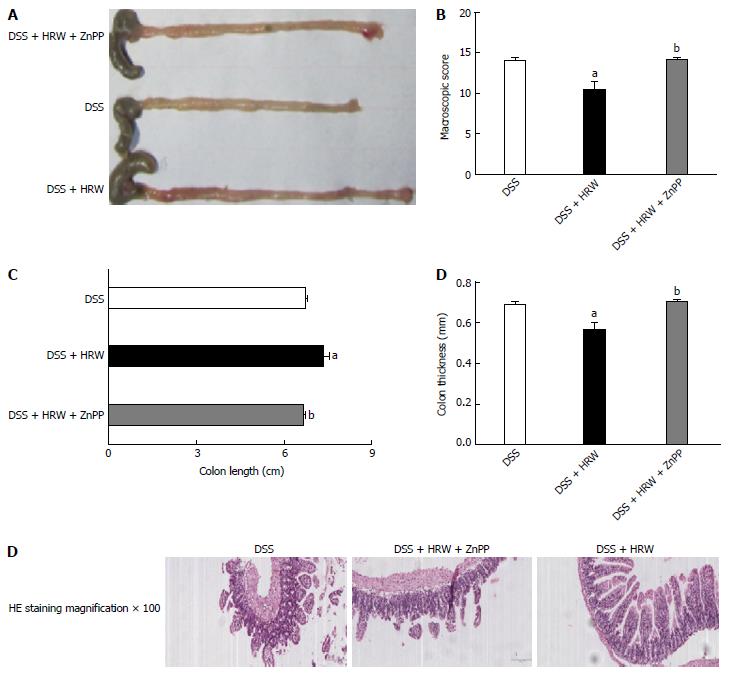
Figure 8 Lack of heme oxygenase-1 reverses the protective role of hydrogen-rich water in dextran sulfate sodium-induced inflammatory bowel disease.
Mice were sacrificed, and the colons were rapidly removed and processed for analysis on the 7th d after inflammatory bowel disease (IBD) modeling. A: The representative pictures of the colon in each group; B: The macroscopic score of the colon in each group; C: The length of the colon in each group; D: The thickness of the colon in each group; E: Hematoxylin-eosin staining of colon tissues (magnification ×100). n = 6, mean ± SEM, aP < 0.05 vs dextran sulfate sodium (DSS) group; bP < 0.05 vs DSS + HRW group. HO-1: Heme oxygenase-1; HRW: Hydrogen-rich water; HE: Hematoxylin and eosin.
- Citation: Shen NY, Bi JB, Zhang JY, Zhang SM, Gu JX, Qu K, Liu C. Hydrogen-rich water protects against inflammatory bowel disease in mice by inhibiting endoplasmic reticulum stress and promoting heme oxygenase-1 expression. World J Gastroenterol 2017; 23(8): 1375-1386
- URL: https://www.wjgnet.com/1007-9327/full/v23/i8/1375.htm
- DOI: https://dx.doi.org/10.3748/wjg.v23.i8.1375


