Copyright
©The Author(s) 2017.
World J Gastroenterol. Feb 28, 2017; 23(8): 1338-1344
Published online Feb 28, 2017. doi: 10.3748/wjg.v23.i8.1338
Published online Feb 28, 2017. doi: 10.3748/wjg.v23.i8.1338
Figure 1 TGR5 mRNA levels in different cell lines.
A: TGR5 mRNA level was significantly higher in Barrett’s cell line CP-A than in squamous cell line HET-1A; B: Levels of TGR5 mRNA were significantly increased in Barrett’s dysplastic cell line CP-D and EA cell line SK-GT-4, when compared with CP-A cells. In addition, TGR5 mRNA was significantly higher in SK-GT-4 cells than in CP-D cells. These data suggest that TGR5 may play an important role in the progression from BE to EA. n = 3, t test, aP < 0.02; ANOVA, bP < 0.01 vs CP-A.
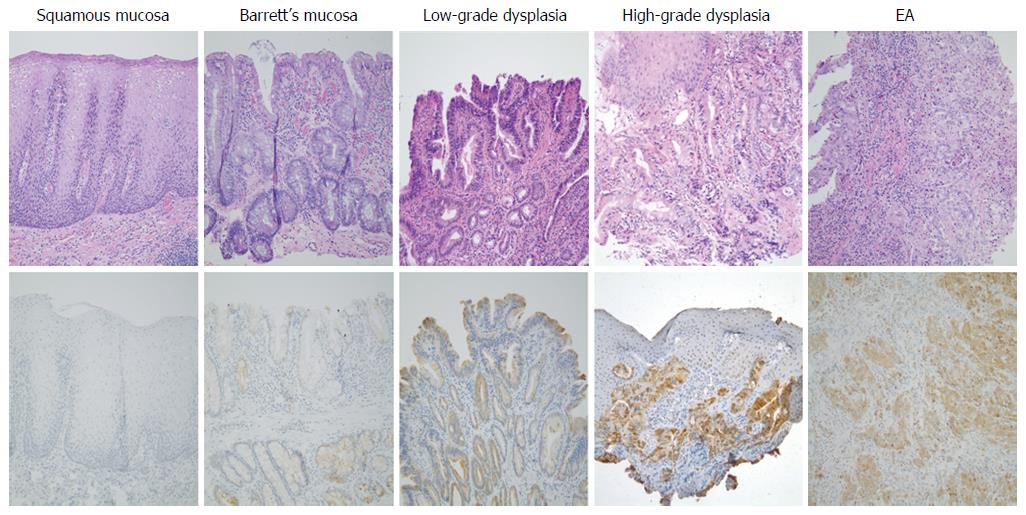
Figure 2 Representative images of squamous mucosa, Barrett’s esophagus mucosa, low-grade dysplasia, high-grade dysplasia and esophageal adenocarcinoma.
Upper panel: Hematoxylin-eosin staining stain, Lower panel: TGR5 immunostaining, magnification × 200. EA: Esophageal adenocarcinoma.
- Citation: Marketkar S, Li D, Yang D, Cao W. TGR5 expression in benign, preneoplastic and neoplastic lesions of Barrett’s esophagus: Case series and findings. World J Gastroenterol 2017; 23(8): 1338-1344
- URL: https://www.wjgnet.com/1007-9327/full/v23/i8/1338.htm
- DOI: https://dx.doi.org/10.3748/wjg.v23.i8.1338


