Copyright
©The Author(s) 2017.
World J Gastroenterol. Feb 21, 2017; 23(7): 1250-1261
Published online Feb 21, 2017. doi: 10.3748/wjg.v23.i7.1250
Published online Feb 21, 2017. doi: 10.3748/wjg.v23.i7.1250
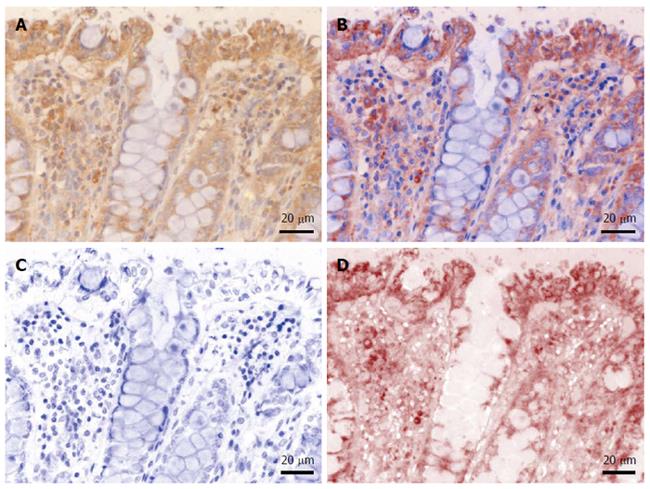
Figure 1 Example of spectral unmixing for the series of slides.
A: Immunostained for beta-2 adrenergic receptors with DAB and counterstained with hematoxylin; B: Pure DAB and hematoxylin signals are shown either overlapping or (C and D), individually.
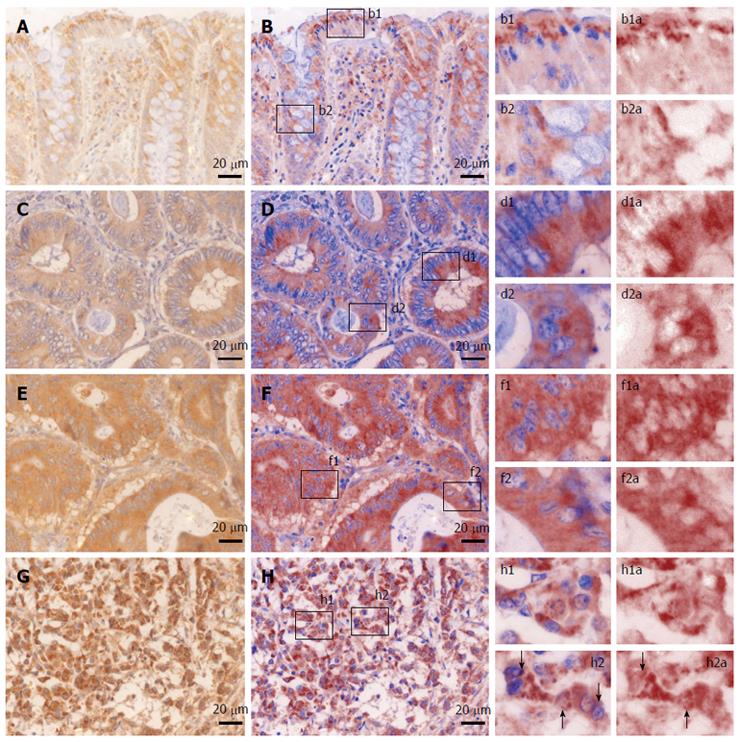
Figure 2 Analysis of the expression of beta-2 adrenergic receptors in the normal and tumor colon tissue.
RGB (A) and unmixed (B; b1, b1a; b2, b2a) images showing receptor presence mostly as dense granules in the supranuclear sector of the superficial layer of enterocytes (b1; b1a), as well as in the sub-nuclear region of the glandular cells of the crypts (b2; b2a). In well differentiated adenocarcinoma, RGB (C) and unmixed images (D; d1, d1a; d2, d2a) revealed a more dense-diffuse like pattern of expression mostly in the apical sector of the cells (d, d1a), but also in the basal pole of the cells (d2, d2a). In moderately differentiated adenocarcinoma, RGB (E) and unmixed images (F; f1, f1a; f2, f2a) revealed an ever denser and more uniform expression pattern in all the cytoplasm of the tumor cells. In poorly differentiated adenocarcinomas, RGB (G) and unmixed images (H; h1, h1a; h2, h2a) reveal an even denser granular expression pattern, with occasional intra(peri) nuclear localization (arrows in h2 and h2a). Small letters represent enlarged insets from the capital lettered images.
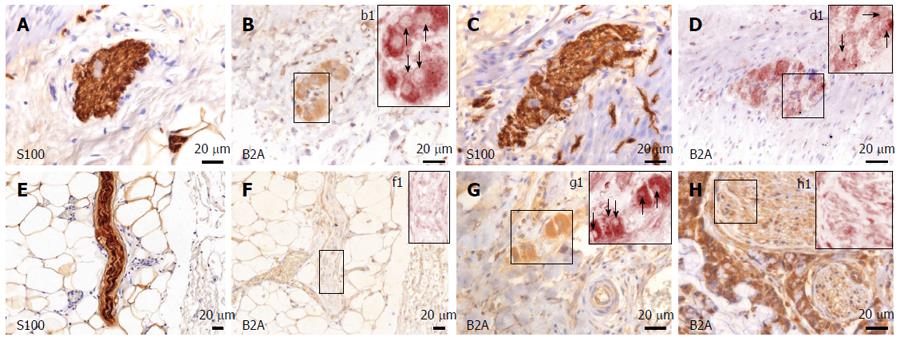
Figure 3 Expression of beta-2 adrenergic receptors in the normal and tumor peripheral nervous tissue on serial sections immunostained for S100 protein (A, C, E, G) and B2A (B, b1; D; d1; F, f1; H, h1).
Spectral unmixing showed that in the normal submucosal (b1) and myenteric (d1) plexuses, B2A was mostly expressed in the cytoplasm of the ganglion cells, being absent in small nerves dissecting the muscularis proper layer (C and D). Even in larger non-invaded nerves B2A showed a faint expression (E-F, f1 spectral unmixing). However, in invaded ganglia (G, g1) and nerves (H, h1) its expression seems to be expressed in both the cytoplasm of the ganglion cells (arrows in g1 - unmixed), as well as in the larger nerve bundles (h1 - unmixed). Small letters represent enlarged insets from the capital lettered images.
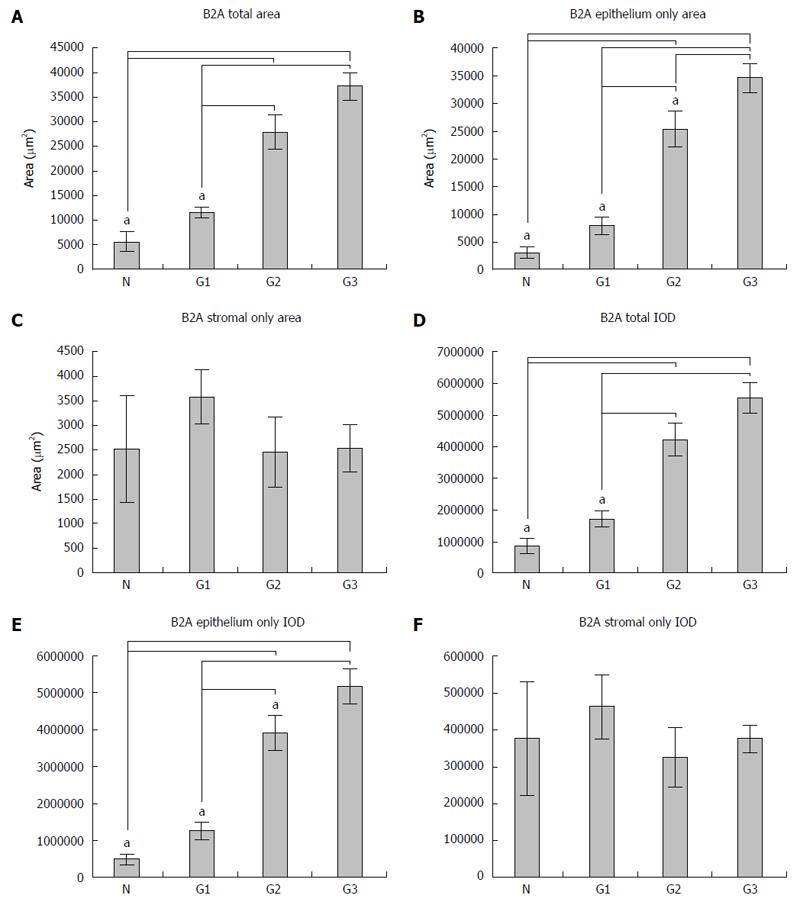
Figure 4 Analysis of the expression of beta-2 adrenergic receptors.
Total expression area increases gradually from normal tissue to G1, G2 and G3 differentiated adenocarcinoma (A), and this differentiation is driven by the expression in the epithelial areas (B), where assessing stromal signal revealed no differences (C). The same scenario is obtained when evaluating the integrated optical density (IOD) of the signal (D-F). aP < 0.05 represents statistical significance on one-way analysis of variance with post hoc comparisons using the Bonferroni’s test. Error bars represent standard errors of the mean. B2A: Beta-2 adrenergic.
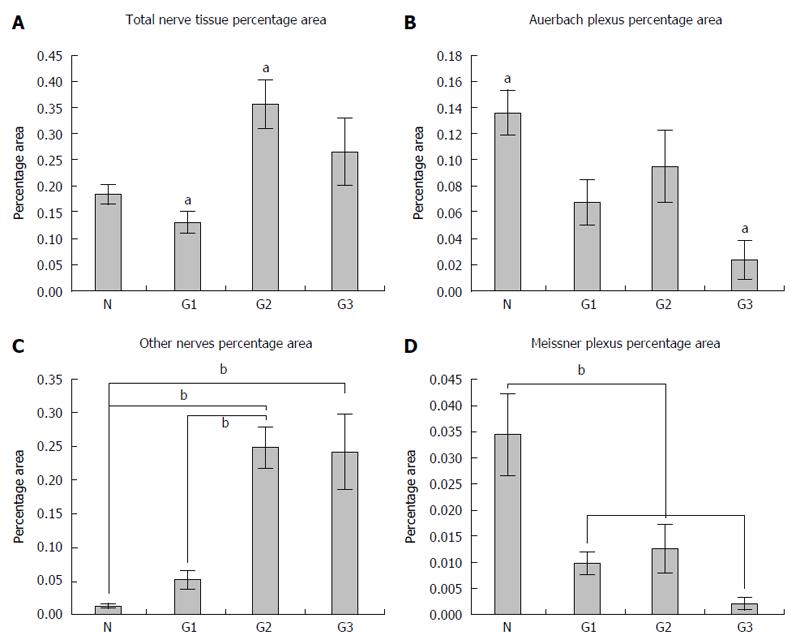
Figure 5 Comparison of the percentage areas of the total analyzed tissue fragments for the submucosal, myenteric plexuses, as well as for the multi-axonal fiber bundles.
For the above peripheral total nerve elements, G1 graded tumors had the smallest percentage areas, followed by normal colon tissue and G2-G3 differentiated tumors (A); Density of the Auerbach plexuses relative areas revealed a clearcut decrease from normal tissue to G1-G2-G3 gradings, with a minimum for G3 grading (B); Larger nervous bundles showed the same pattern as for the total analyzed areas (C), while differences between the relative areas of Meissner plexuses revealed the same pattern as for the Auerbach plexuses (D), revealing that the total and plexus areas variate in opposite directions when considering increasing gradings. aP < 0.05 and bP < 0.01 represent statistical significance on one-way analysis of variance with post hoc comparisons using the Bonferroni’s test. Error bars represent standard errors of the mean.
- Citation: Ciurea RN, Rogoveanu I, Pirici D, Târtea GC, Streba CT, Florescu C, Cătălin B, Puiu I, Târtea EA, Vere CC. B2 adrenergic receptors and morphological changes of the enteric nervous system in colorectal adenocarcinoma. World J Gastroenterol 2017; 23(7): 1250-1261
- URL: https://www.wjgnet.com/1007-9327/full/v23/i7/1250.htm
- DOI: https://dx.doi.org/10.3748/wjg.v23.i7.1250


