Copyright
©The Author(s) 2017.
World J Gastroenterol. Feb 21, 2017; 23(7): 1203-1214
Published online Feb 21, 2017. doi: 10.3748/wjg.v23.i7.1203
Published online Feb 21, 2017. doi: 10.3748/wjg.v23.i7.1203
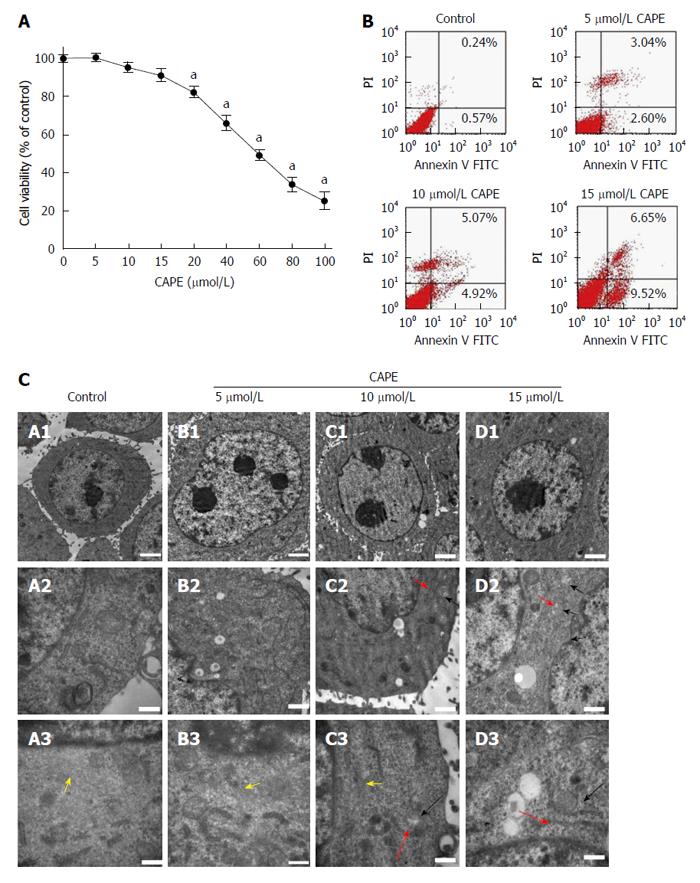
Figure 1 Effect of different concentrations of caffeic acid phenethyl ester on biological characteristics of hepatic stellate cell-T6 cells.
After HSC-T6 cells were treated with CAPE(0, 5, 10, 15, 20, 40, 60, 80 and 100 μmol/L) for 24 h (A) the effect of CAPE on the viability of HSC-6 cells was detected by the MTT assay; B: Cell apoptosis was investigated using annexin V-FITC and PI and the proportion of cell apoptosis increased in a concentration-dependent manner; C: Ultrastructure of the HSC-T6 cells. The normal structure is shown in the control groups (group A). The treatment groups (groups B, C, and D) displayed prominent myofilament disarray and rupture, cytoplasmic vacuolization, and significant mitochondrial swelling (black bar: mitochondria; red bar: Endoplasmic reticulum; yellow bar: myofilament). The upper scale bar = 2 μm, the middle scale bar = 1 μm, and the lower scale bar = 0.5 μm. The data represent averages of the results of four independent experiments. aP < 0.05 vs control. CAPE: Caffeic acid phenethyl ester.
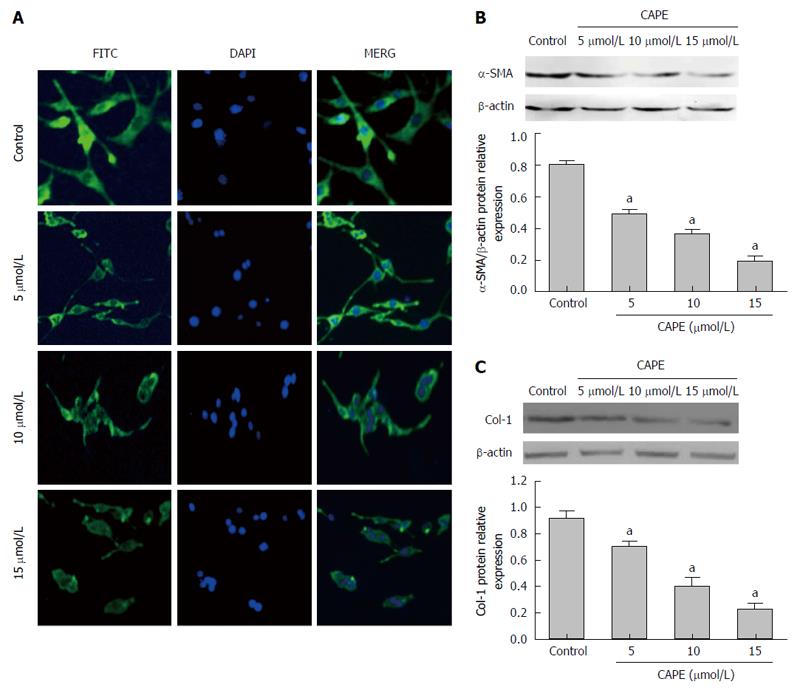
Figure 2 α-SMA and collegen-1 protein expression in hepatic stellate cell-T6 cells.
After HSC-T6 cells were treated with 5 μmol/L, 10 μmol/L and 15 μmol/L CAPE for 24 h, indirect immunofluorescence (× 200) analysis of α-SMA protein expression (A) were undertaken. Western blot analysis of α-SMA and collegen-1 protein expression was also performed. Gray levels were normalized against those of the corresponding β-actin and the results are expressed relative to control (B and C). The data are the mean ± SD of three independent experiments. aP < 0.05 vs control. CAPE: Caffeic acid phenethyl ester.
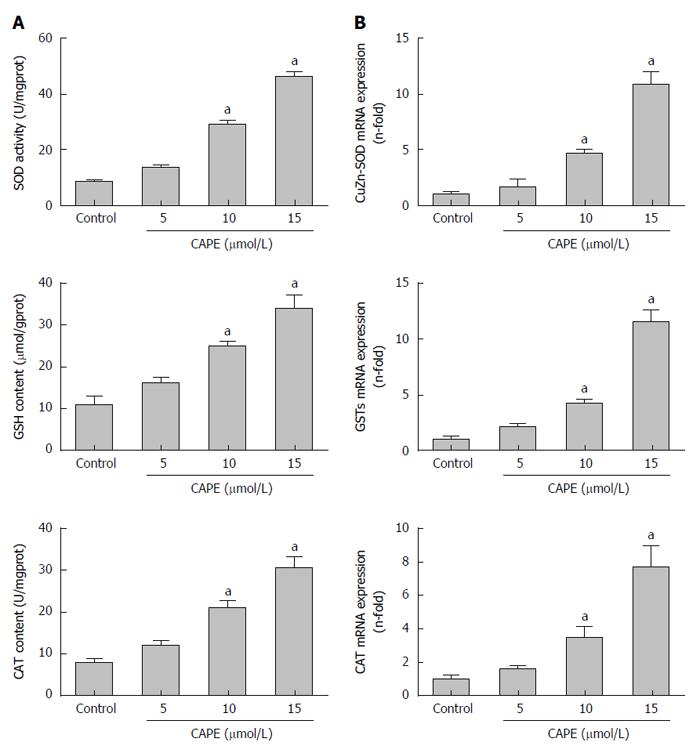
Figure 3 Antioxidant-related indicator protein and mRNA expression in hepatic stellate cell-T6 cells.
After HSC-T6 cells were treated with 5 μmol/L, 10 μmol/L and 15 μmol/L CAPE for 24 h, the SOD activity, GSH and CAT content (A) and the mRNA expression of SOD, GSTs and CAT (B) were assessed. The data represent averages of the results of three independent experiments. aP < 0.05 vs control. CAPE: Caffeic acid phenethyl ester; SOD: Superoxide dismutase; CAT: Catalase; GST: Glutathione-S-transferase.
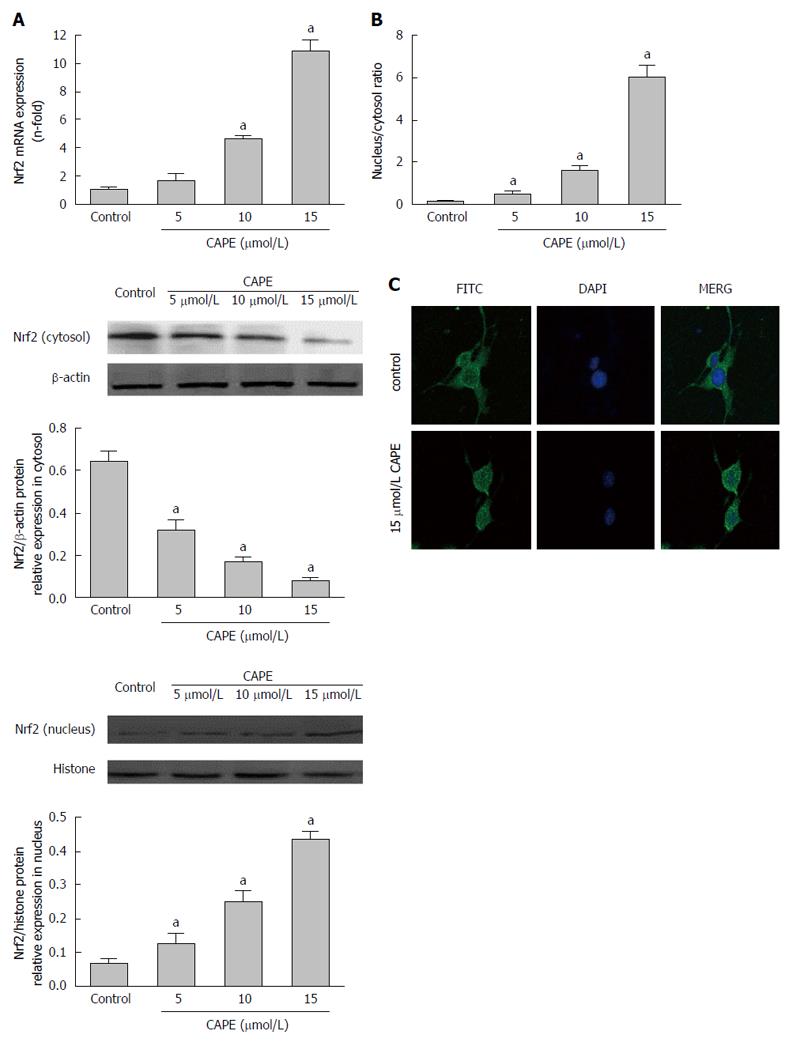
Figure 4 Effect of caffeic acid phenethyl ester on Nrf2 expression in hepatic stellate cell-T6 cells.
A: HSC-T6 cells were treated with 5 μmol/L, 10 μmol/L and 15 μmol/L CAPE for 24 h. Nrf2 mRNA and cytosol and nuclear protein expression levels were investigated using real-time PCR and Western blot, respectively; B: The nucleus/cytosol ratio defines Nrf2 protein expression in the nucleus/Nrf2 protein expression in cytosol; C: Indirect immunofluorescence (× 200) analysis of Nrf2 protein expression in HSC-T6 cells. The upper: control group and the lower: 15 μmol/L CAPE group. The data presented are the mean ± SD (n = 3). aP < 0.05 vs control. CAPE: Caffeic acid phenethyl ester.
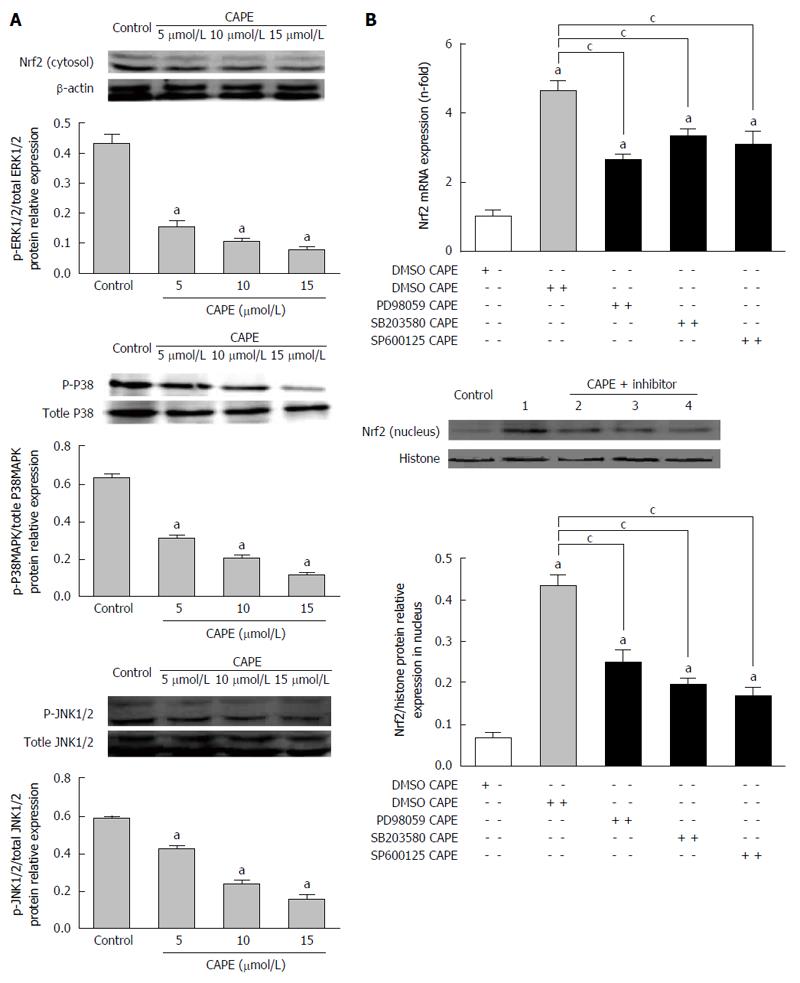
Figure 5 Phosphorylation levels of ERK1/2, p38MARK, and JNK1/2 are significantly increased in a dose-dependent manner in hepatic stellate cell-T6 cells.
A: Effect of caffeic acid phenethyl ester on phosphorylation of ERK1/2, p38MAPK and JNK. Western blot analysis of total and phosphorylated protein levels of ERK1/2, p38MARK and JNK in HSC-T6 cells treated with CAPE (5 μmol/L, 10 μmol/L and 15 μmol/L) was performed. Total MAPKs were used as the internal control. The gray levels were normalized against those of the corresponding total MAPKs and the results are expressed, relative to control; B: Effect of inhibitors of MAPKs on the expression of Nrf2 in HSC-T6 cells. Cells were treated with ERK1/2 inhibitor PD98059 (30 μmol/L), p38 MAPK inhibitor SB203580 (20 μmol/L) or JNK inhibitor SP600125 (25 μmol/L) for 2 h, then incubated with CAPE (15 μmol/L) for 24 h, and protein expression was evaluated by Western blot. Lane 1: Control group; Lane 2: 15 μmol/L CAPE group; Lane 3: CAPE + PD98059 group; Lane 4: CAPE + SB203580 group; Lane 5: CAPE + SP600125 group. Histone was used as the internal control to reflect the expression of nuclear Nrf2. The gray levels were normalized against histone and the results are expressed, relative to control. The data are the mean ± SD of three independent experiments. aP < 0.05 vs control; cP < 0.05 vs CAPE group. CAPE: Caffeic acid phenethyl ester.
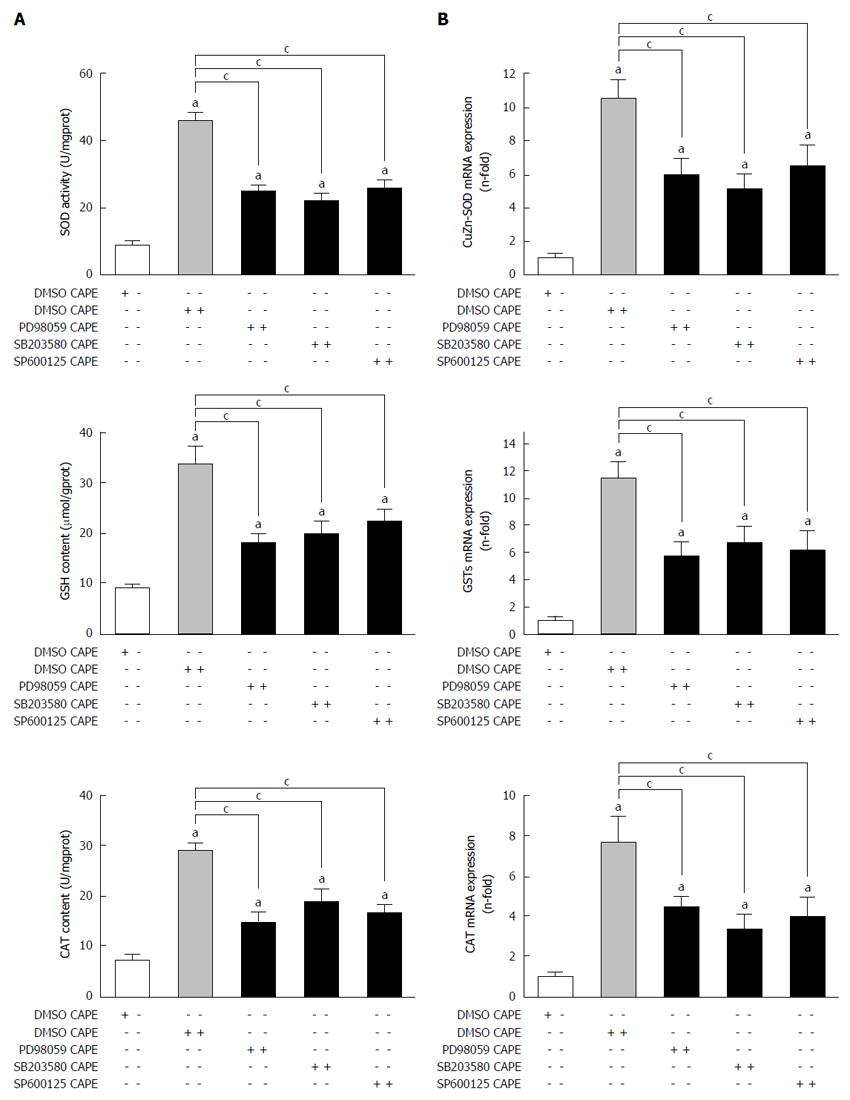
Figure 6 Effect of inhibitors of mitogen activated protein kinases and caffeic acid phenethyl ester on the antioxidant-related indicator protein and mRNA expression.
A: Effect of inhibitors of MAPKs and CAPE on the SOD activity and GSH and CAT content in HSC-T6 cells. Cells were treated with the ERK1/2 inhibitor PD98059 (30 μmol/L), p38MAPK inhibitor SB203580 (20 μmol/L) or JNK inhibitor SP600125 (25 μmol/L) for 2 h, then incubated with CAPE (15 μmol/L) for 24 h; B: Effect of inhibitors of MAPKs and CAPE on antioxidant-related mRNA expression in HSC-T6 cells. The data represent averages of the results of three independent experiments. aP < 0.05 vs control; cP < 0.05 vs CAPE group. CAPE: Caffeic acid phenethyl ester; SOD: Superoxide dismutase; CAT: Catalase; GST: Glutathione-S-transferase.
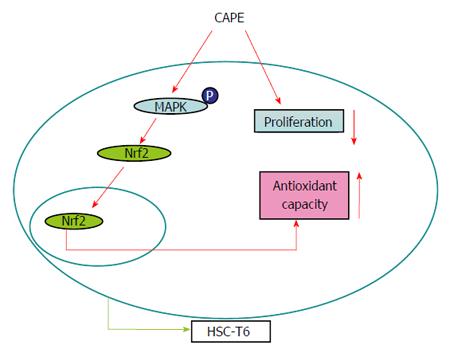
Figure 7 Nrf2-mediated mitogen activated protein kinases signaling pathway contributes to antioxidant capacity of caffeic acid phenethyl ester in hepatic stellate cell-T6 cells.
- Citation: Yang N, Shi JJ, Wu FP, Li M, Zhang X, Li YP, Zhai S, Jia XL, Dang SS. Caffeic acid phenethyl ester up-regulates antioxidant levels in hepatic stellate cell line T6 via an Nrf2-mediated mitogen activated protein kinases pathway. World J Gastroenterol 2017; 23(7): 1203-1214
- URL: https://www.wjgnet.com/1007-9327/full/v23/i7/1203.htm
- DOI: https://dx.doi.org/10.3748/wjg.v23.i7.1203


