Copyright
©The Author(s) 2017.
World J Gastroenterol. Feb 21, 2017; 23(7): 1189-1202
Published online Feb 21, 2017. doi: 10.3748/wjg.v23.i7.1189
Published online Feb 21, 2017. doi: 10.3748/wjg.v23.i7.1189
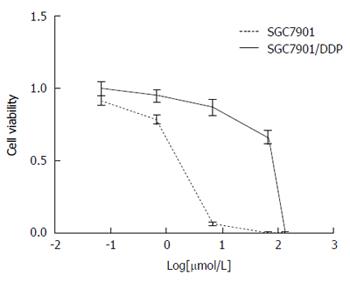
Figure 1 Cell viability treated with different concentrations of cisplatin for 48 h.
MTT assay for SGC7901 cells and SGC7901/DDP cells treated with cisplatin (133.34, 66.67, 6.67, 0.67 and 0.067 μmol/L, respectively).
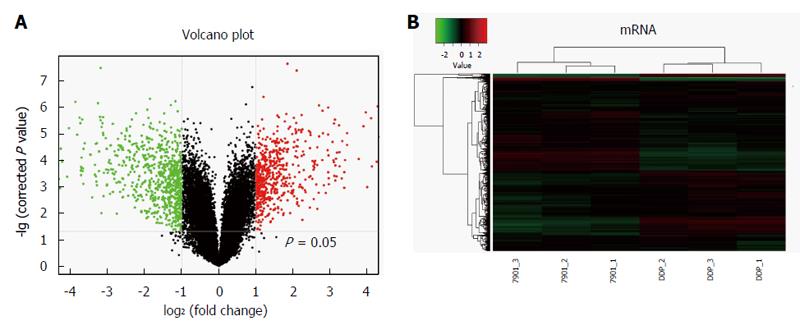
Figure 2 mRNA expression levels from microarray.
A: The volcano plot image showed the mRNA expression levels of microarray in SGC7901/DDP cells compared with SGC7901 cells. Black dots: equally expressed mRNAs between SGC7901/DDP cells and SGC7901 cells (FC ≤ 2); red dots: mRNAs were over-expressed in SGC7901/DDP cells compared with SGC7901 cells (FC ≥ 2); green dots: mRNAs in SGC7901/DDP cells were down-expressed compared to SGC7901 cells (P-values < 0.05, FC ≥ 2). Fold changes of these mRNAs in SGC7901/DDP cells compared with SGC7901 cells are shown as mean ± SD; B: Two-dimensional hierarchical clustering image of the 1308 dysregulated mRNAs in the SGC7901/DDP cells compared with the SGC7901 cells, each row represents an mRNA, each column represents a sample. 7901-1, 7901-2 and 7901-3 represent the three samples of SGC7901 cells, DDP-1, DDP-2 and DDP-3 represent the three samples of SGC7901/DDP cells. Red: Higher expression levels; green: Lower expression levels.
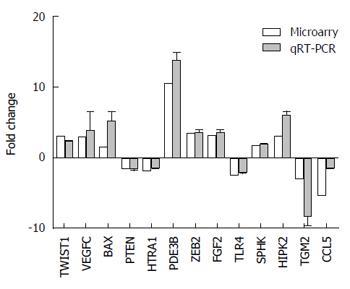
Figure 3 Quantitative real-time polymerase chain reaction validation of the microarray results of the 13 mRNAs.
Relative fold changes in expression between SGC7901/DDP cells and SGC7901 cells were in agreement with microarray.
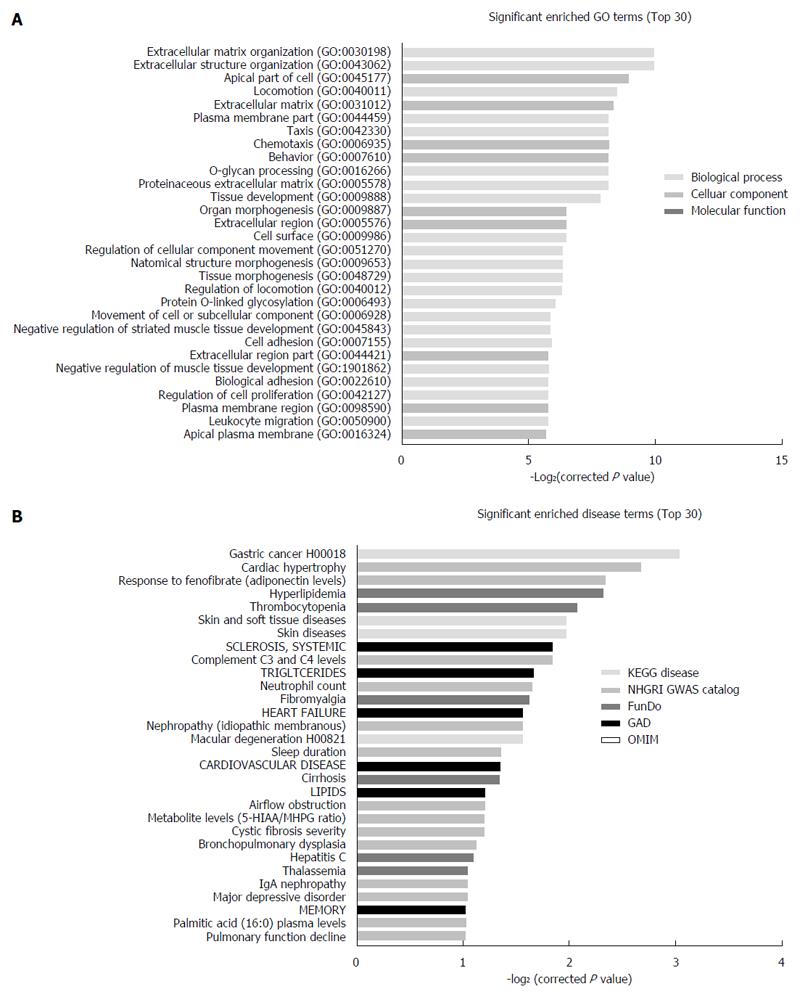
Figure 4 Bioinformatic analysis of differentially expressed mRNAs.
Gene ontology analysis of mRNAs dysregulated in SGC7901/DDP cells compared with SGC7901 cells. A: Top 30 molecular functions of the dysregulated mRNAs may associated with. Gene ontology analysis include biological processes, cellular components and molecular function; B: Gene ontology enriched diseases. Top 30 diseases annotations of dysregulated mRNAs may involve in. The disease enrich system include 5 disease databases: OMIM, KEGG disease, FunDO, GAD and NHGRI GWAS Catalog.
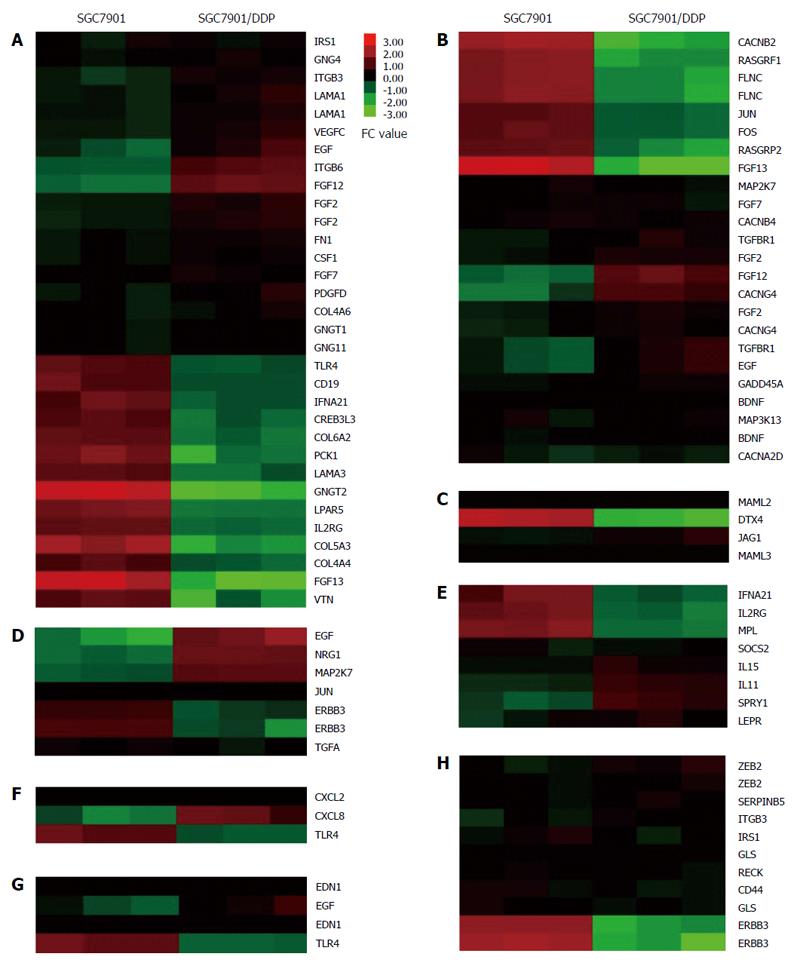
Figure 5 Heat-map of gene ontology enriched cisplatin resistance pathways and input mRNAs which significantly altered in SGC7901/DDP cells compared with SGC7901 cells.
A: PI3K-Akt signaling pathway and input genes; B: MAPK signaling pathway and input genes; C: Notch signaling pathway and input genes; D: ErbB signaling pathway and input genes; E: Jak-STAT signaling pathway and input genes; F: NF-kappa B signaling pathway and input genes; G: HIF-1 signaling pathway and input genes; H: MicroRNAs in cancer and input genes. Each row represents an mRNA, and each column represents a sample. The intensity of the color indicates the relative levels of mRNAs. Red: Higher expression levels; green: Lower expression levels. The name of the input mRNAs which significantly altered (P < 0.05, FC ≥ 2) is present at the right of the figure.
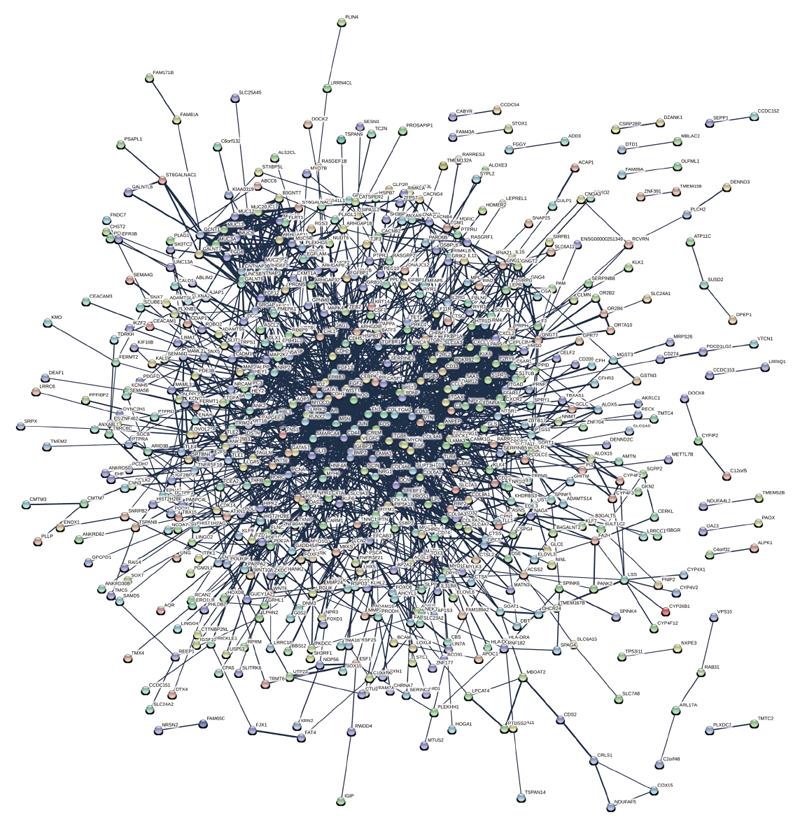
Figure 6 Interaction network analyses of differentially express proteins.
In the network, nodes represents proteins, lines as functional associations between the abnormal expressed proteins and the thickness of the lines indicates the level of confidence in association reported.
- Citation: Xie XQ, Zhao QH, Wang H, Gu KS. Dysregulation of mRNA profile in cisplatin-resistant gastric cancer cell line SGC7901. World J Gastroenterol 2017; 23(7): 1189-1202
- URL: https://www.wjgnet.com/1007-9327/full/v23/i7/1189.htm
- DOI: https://dx.doi.org/10.3748/wjg.v23.i7.1189


