Copyright
©The Author(s) 2017.
World J Gastroenterol. Feb 14, 2017; 23(6): 999-1009
Published online Feb 14, 2017. doi: 10.3748/wjg.v23.i6.999
Published online Feb 14, 2017. doi: 10.3748/wjg.v23.i6.999
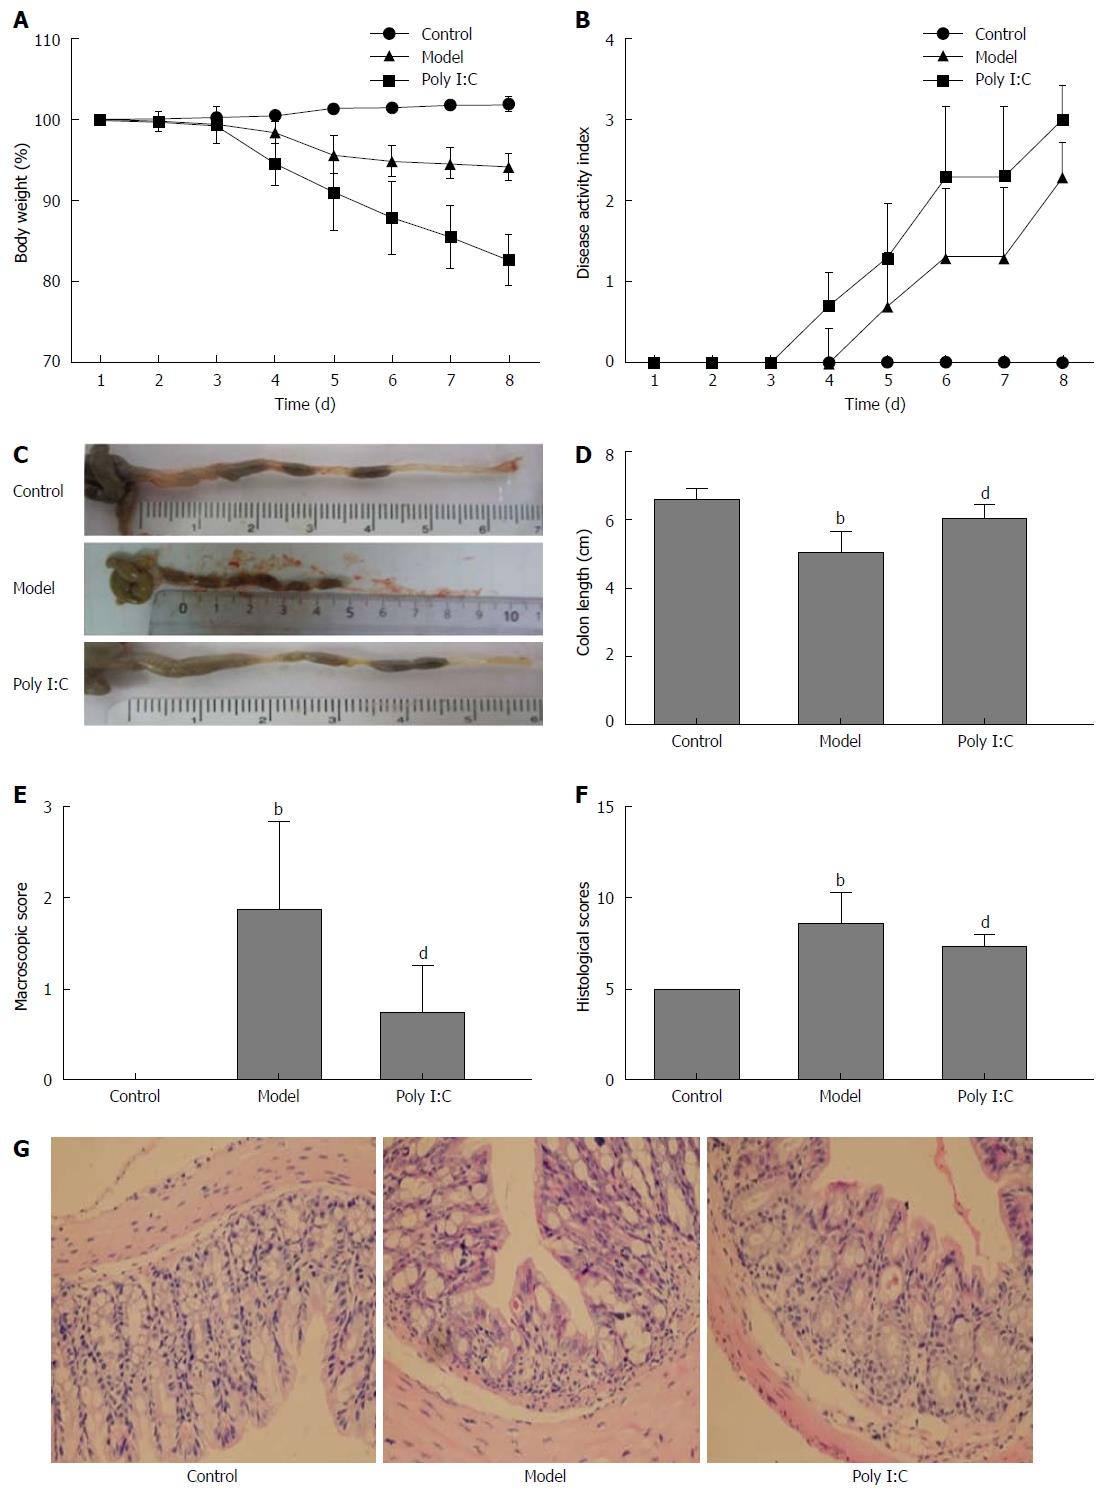
Figure 1 Effect of poly I:C administration on dextran sulfate sodium-induced acute colitis.
A: The percentage of body weight change assessed daily during 1 to 8 d observation; B: Change in the disease activity index that was comprised of body weight loss, stool consistency and occult blood; C: Representative photographs of colon obtained after monitoring clinical development of colitis for 8 d; D: Quantitative analysis of the length of the colon; E: Macroscopic score inflammation assessed; F: Histological scores of the colon tissues; G: Representative photographs of HE staining of colon tissues (Magnifications, × 200). Data are expressed as mean ± SD. bP < 0.01 vs control group; dP < 0.01 vs model group.
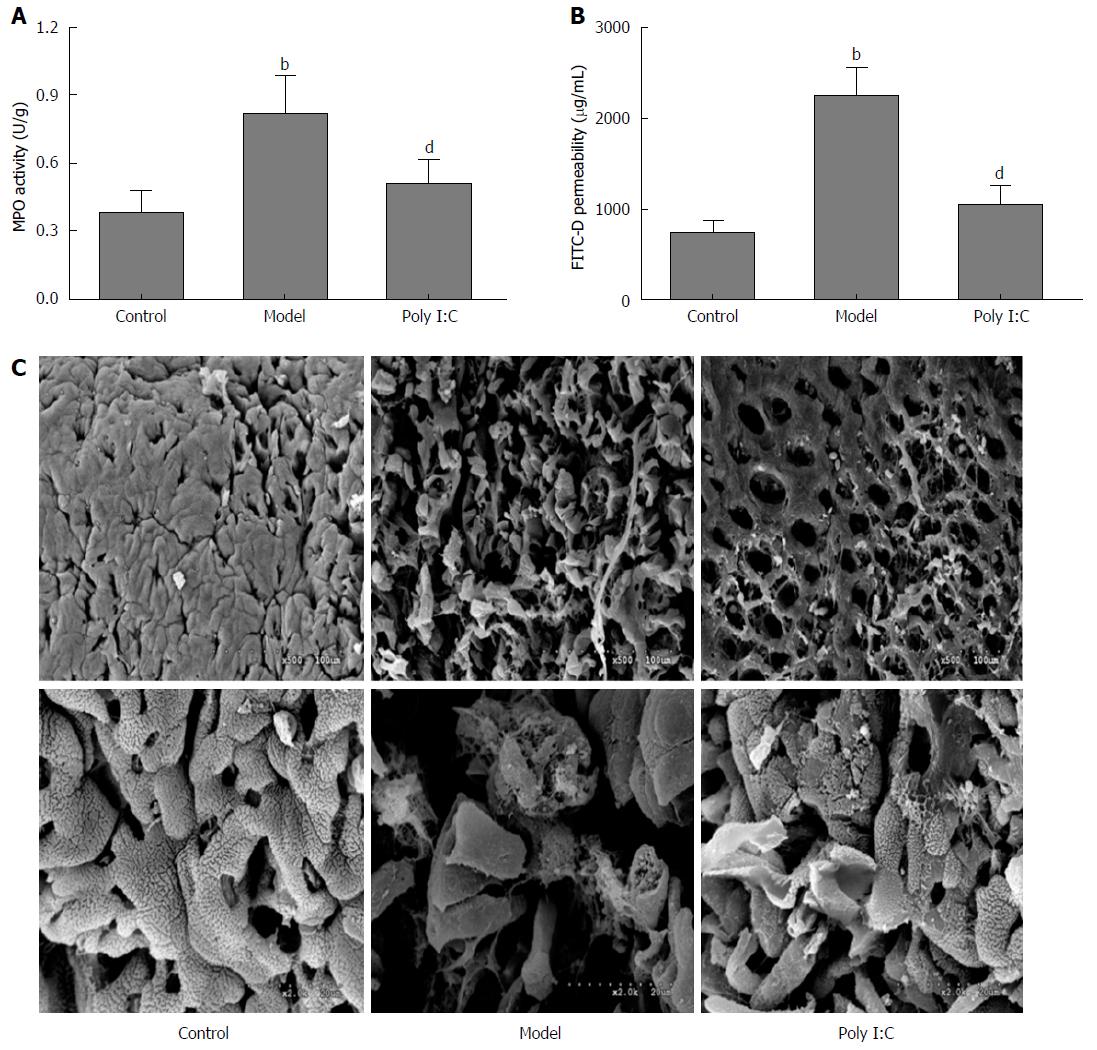
Figure 2 Effect of poly I:C on intestinal barrier in dextran sulfate sodium-induced acute colitis.
A: MPO activity was measured; B: Quantification of serum FITC-D as a measure of intestinal barrier functions; C: The ultrastructural features of colon under scanning electron microscope. The colon mucosa in the control group was regular without histological lesion. In the model group, the mucosa showed severe loss with obvious histological lesions, including crypt distortion and abscesses. The lesions were significantly ameliorated by poly I:C pretreatment (Upper images: × 500; Lower images: × 2000). Data are expressed as mean ± SD. bP < 0.01 vs control group; dP < 0.01 vs model group. FITC-D: Fluorescein isothiocyanate labeled-dextran; MPO: myeloperoxidase.
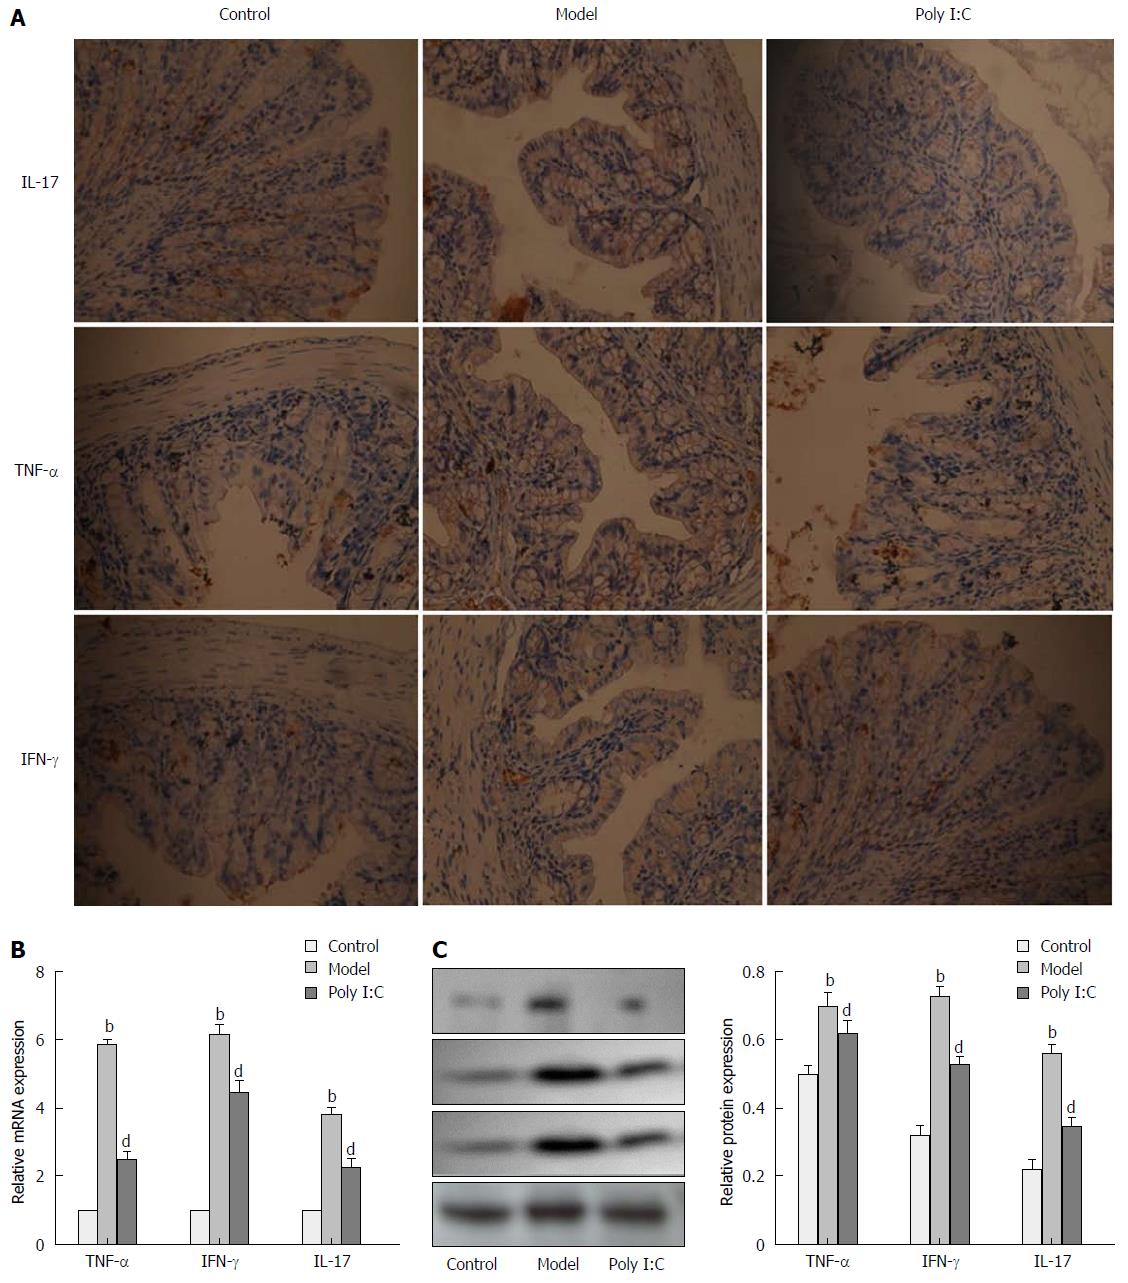
Figure 3 Effect of poly I:C on the expressions of inflammatory markers.
A: Representative photographs of immunohistochemistry staining of IL-17, TNF-α and IFN-γ in colon tissues (Magnifications, × 200); B: Expressions of IL-17, TNF-α and IFN-γ at the mRNA level, as analyzed by RT-qPCR; C: Protein expressions of IL-17, TNF-α and IFN-γ as analyzed by Western Blot. Data are expressed as mean ± SD. bP < 0.01 vs control group; dP < 0.01 vs model group. RT-qPCR: Real-time quantitative polymerase chain reaction; IL-17: Interleukin-17; TNF-α: Tumor necrosis factor-α; IFN-γ: Interferon-γ.
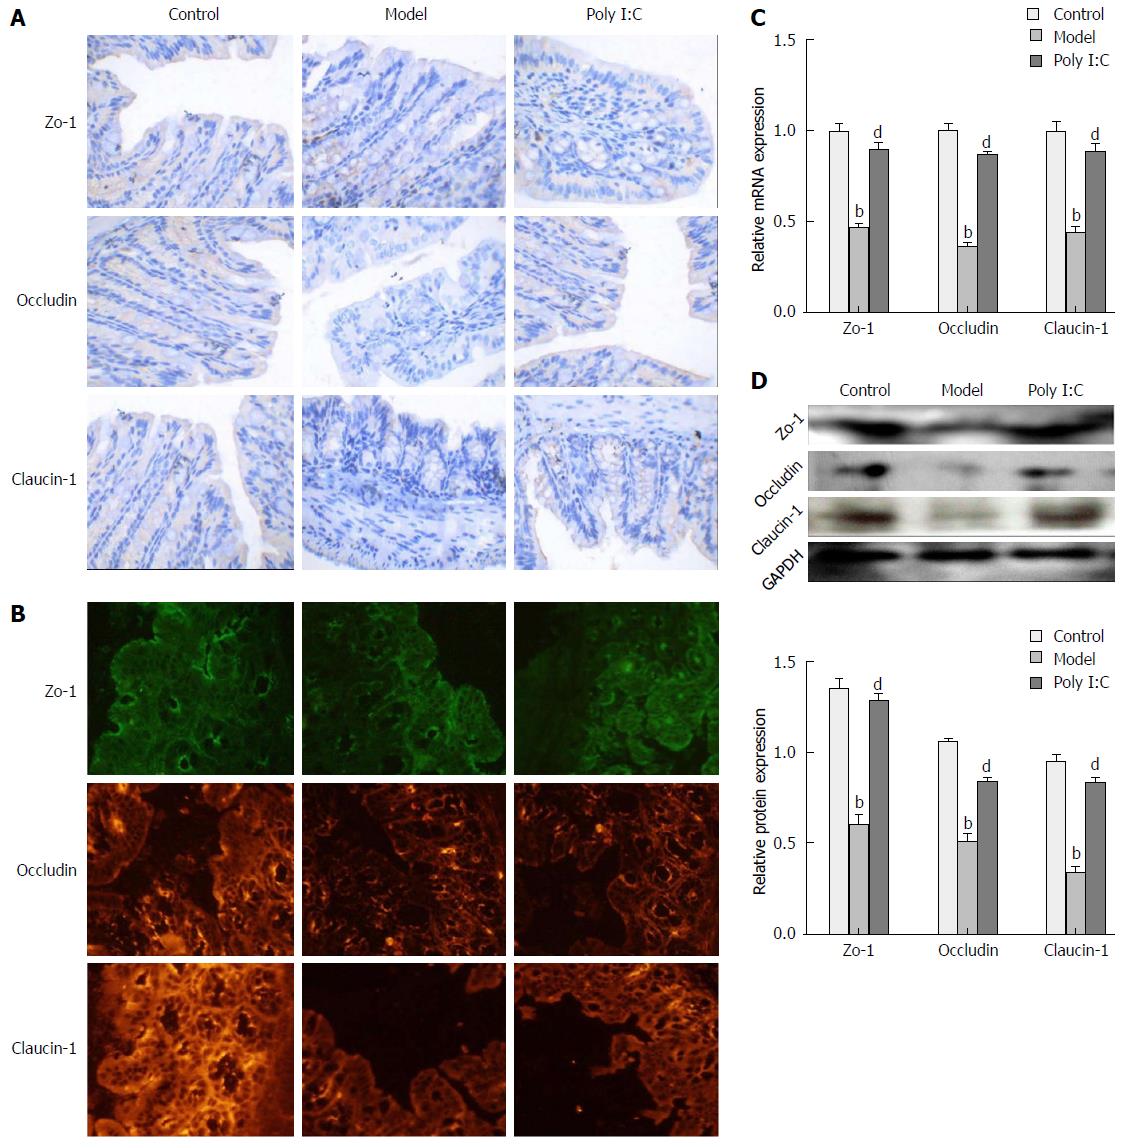
Figure 4 Effect of poly I:C on colonic epithelial junctions.
A: Representative photographs of immunohistochemistry staining for zo-1, occludin and claudin-1 (Magnification: × 200); B: Representative photographs of immunofluorescent staining for zo-1 (green), occludin and claudin-1 (red); C: Expressions of zo-1, occludin and clandin-1 at the mRNA level, as analyzed by RT-qPCR; D: Protein expressions of zo-1, occludin and clandin-1 as analyzed by Western Blot. Data are expressed as mean ± SD. bP < 0.01 vs control group; dP < 0.01 vs model group. RT-qPCR: Real-time quantitative polymerase chain reaction.
- Citation: Zhao HW, Yue YH, Han H, Chen XL, Lu YG, Zheng JM, Hou HT, Lang XM, He LL, Hu QL, Dun ZQ. Effect of toll-like receptor 3 agonist poly I:C on intestinal mucosa and epithelial barrier function in mouse models of acute colitis. World J Gastroenterol 2017; 23(6): 999-1009
- URL: https://www.wjgnet.com/1007-9327/full/v23/i6/999.htm
- DOI: https://dx.doi.org/10.3748/wjg.v23.i6.999


