Copyright
©The Author(s) 2017.
World J Gastroenterol. Feb 14, 2017; 23(6): 986-998
Published online Feb 14, 2017. doi: 10.3748/wjg.v23.i6.986
Published online Feb 14, 2017. doi: 10.3748/wjg.v23.i6.986
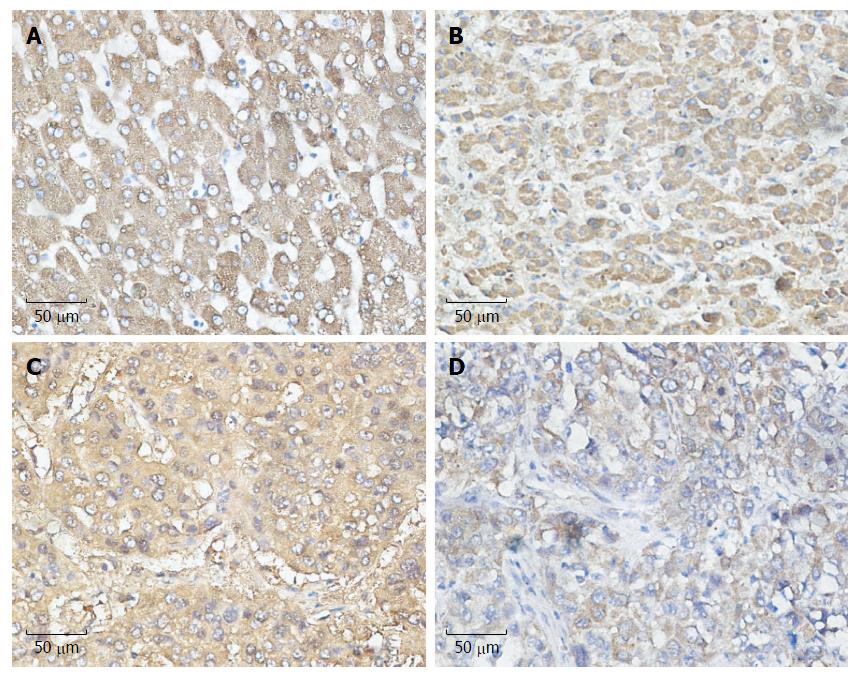
Figure 1 Relationship between cyclooxygenase-2 and unfolded protein response pathways.
Expression of unfolded protein response (UPR) pathways and COX-2 in hepatocellular carcinoma (HCC) (streptavidin-peroxidase × 400). A: Expression of COX-2 in HCC; B: Expression of ATF-6 in HCC; C: Expression of IRE-1 in HCC; D: Expression of PERK in HCC. COX-2: Cyclooxygenase-2.
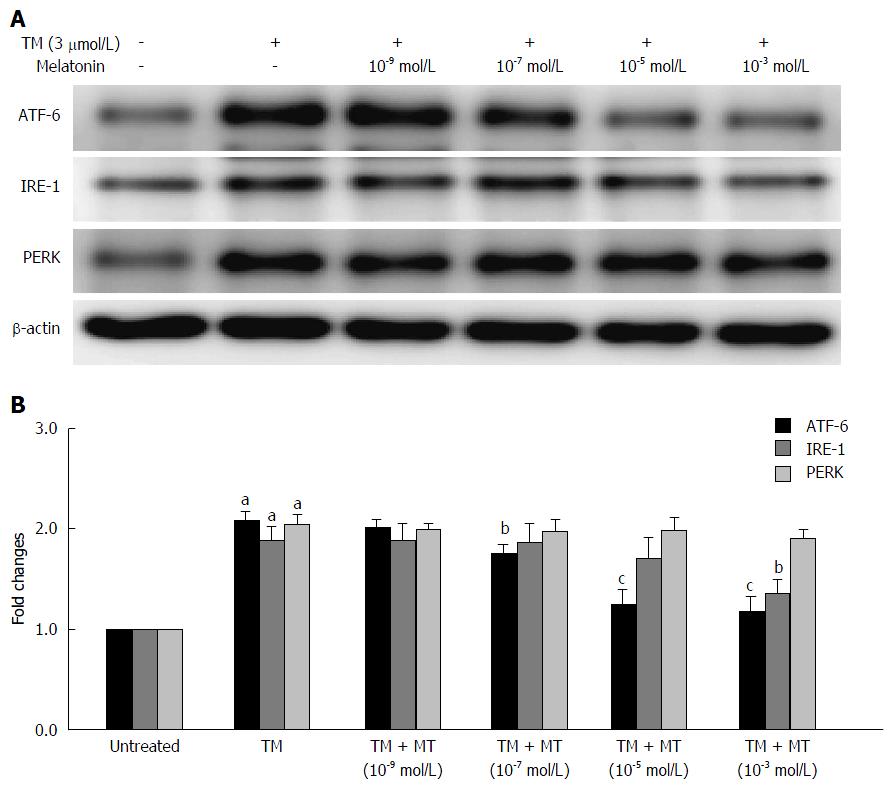
Figure 2 Selection of the proper melatonin concentration.
The effects of melatonin (MT) on the three unfolded protein response (UPR) pathways of HepG2 cells induced by tunicamycin (TM). HepG2 cells were exposed to different concentrations of melatonin (10-9, 10-7, 10-5 and 10-3 mol/L) for 24 h. A: Equal protein amounts of cell lysates were subjected to western blot assay using anti-ATF-6, anti-IRE-1 and anti-PERK. β-actin in the same HepG2 cells extract was used as an internal reference; B: Optical density reading values of specific proteins are represented as fold differences relative to the loading control protein, β-actin. aP < 0.01 vs negative control (NC); bP < 0.05 vs positive control (TM); cP < 0.01 vs positive control (TM). ATF-6: Activating transcription factor 6; IRE: Inositol-requiring enzyme; PERK: Protein kinase RNA-like endoplasmic reticulum kinase.
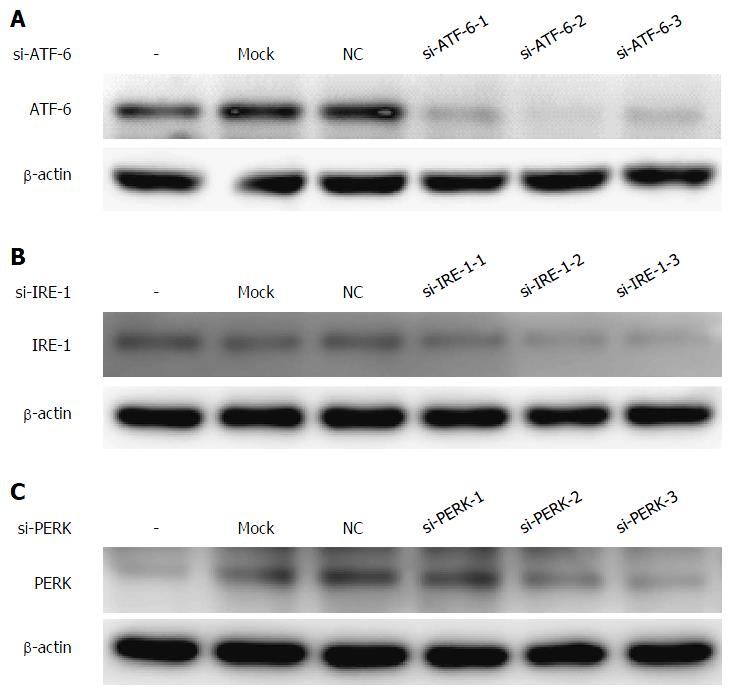
Figure 3 Selection of the most effective sequences of each unfolded protein response pathways siRNA (A-C).
All of the candidate sequences of the three unfolded protein response (UPR) pathways were examined by RNA interference, and the expression of UPR proteins was evaluated by western blotting to select the most effective one to interfere with the UPR pathway. ATF-6: Activating transcription factor 6; NC: Negative control; IRE: Inositol-requiring enzyme; PERK: Protein kinase RNA-like endoplasmic reticulum kinases.
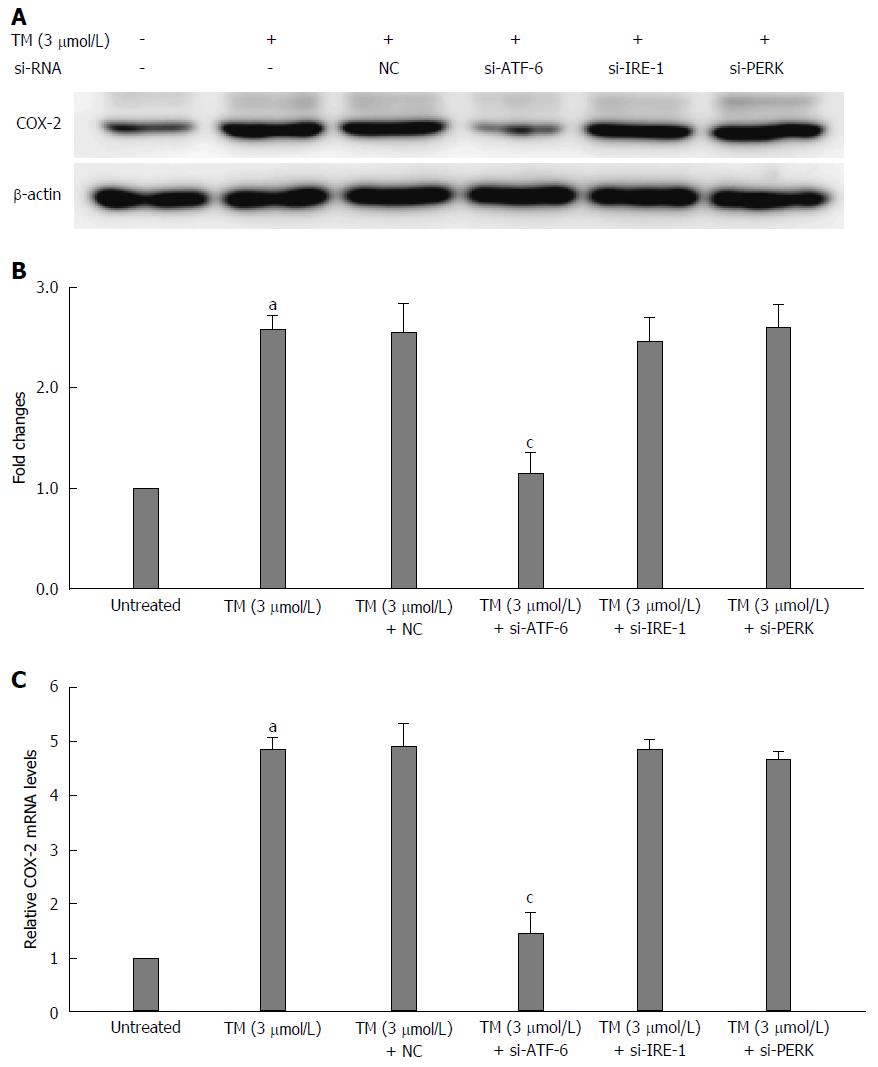
Figure 4 Relationship between activating transcription factor 6 and cyclooxygenase-2 under endoplasmic reticulum stress.
The mRNA of the unfolded protein response (UPR) pathways was interfered by ATF-6, IRE-1 and PERK siRNA after pretreatment by tunicamycin (TM) for 8 h. A: Equal protein amounts of cell lysates were subjected to western blot assay using anti-COX-2. β-actin in the same HepG2 cell extract was used as an internal reference. B: Optical density reading values of specific proteins are represented as fold-differences relative to the loading control protein, β-actin. aP < 0.01 vs the negative control. RNA was harvested and gene expression examined by qRT-PCR in the same condition above. C: The qRT-PCR fold-changes were normalized using the expression of housekeeping gene (GAPDH) and vs those obtained from untreated HepG2 cells. aP < 0.01 vs the negative control; cP < 0.01 vs the untreated HepG2 cells. ATF-6: Activating transcription factor 6; NC: Negative control; COX-2: Cyclooxygenase-2; IRE: Inositol-requiring enzyme; PERK: Protein kinase RNA-like endoplasmic reticulum kinase.
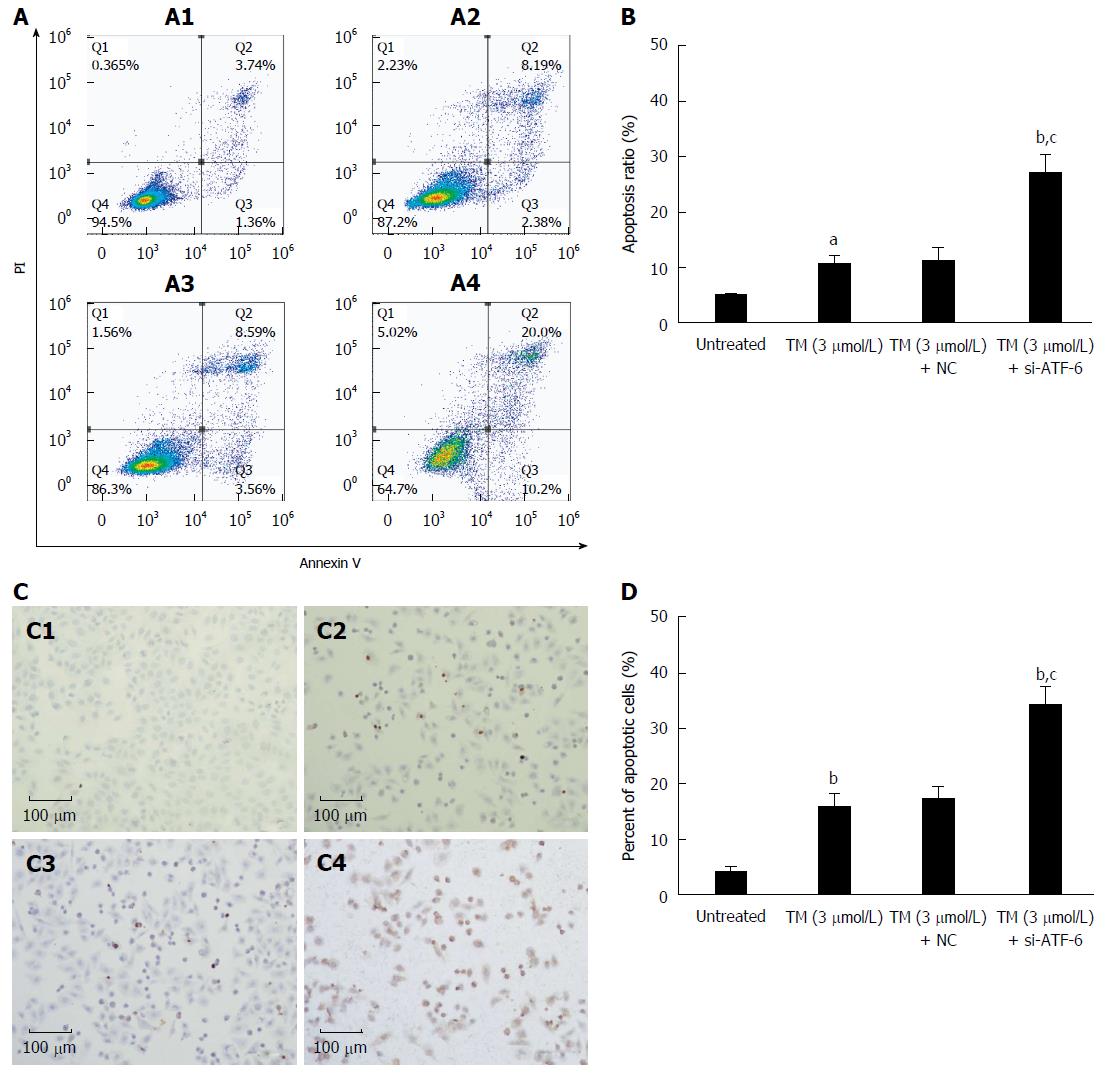
Figure 5 Effects of activating transcription factor 6 siRNA on cell apoptosis in HepG2 cells under endoplasmic reticulum stress.
A: HepG2 cells were transfected with ATF-6 siRNA for 24 h after pretreatment by tunicamycin (TM) for 8 h. Apoptotic cells were determined by FACS, and the data are expressed as the mean ± SD. A1, Untreated HepG2 cells; A2, HepG2 cells treated by TM only; A3, HepG2 cells treated by combination of TM and ATF-6 siRNA negative control; A4, HepG2 cells treated by ATF-6 siRNA and melatonin; B: Data are presented as the mean ± SD for the independent experiments (aP < 0.05 vs untreated HepG2 cells; bP < 0.01 vs untreated HepG2 cells; cP < 0.01 vs HepG2 cells treated with TM and ATF-6 siRNA negative control); C: Cell morphology and percentage of apoptotic cells was examined by TUNEL staining. C1, Untreated HepG2 cells; C2, HepG2 cells treated by TM only; C3, HepG2 cells treated by combination of TM and ATF-6 siRNA negative control; C4, HepG2 cells treated by ATF-6 siRNA and melatonin; D: Data are presented as the mean ± SD for the independent experiments (bP < 0.01 vs untreated HepG2 cells; cP < 0.01 vs HepG2 cells treated with TM and ATF-6 siRNA negative control). ATF-6: Activating transcription factor 6; NC: Negative control.
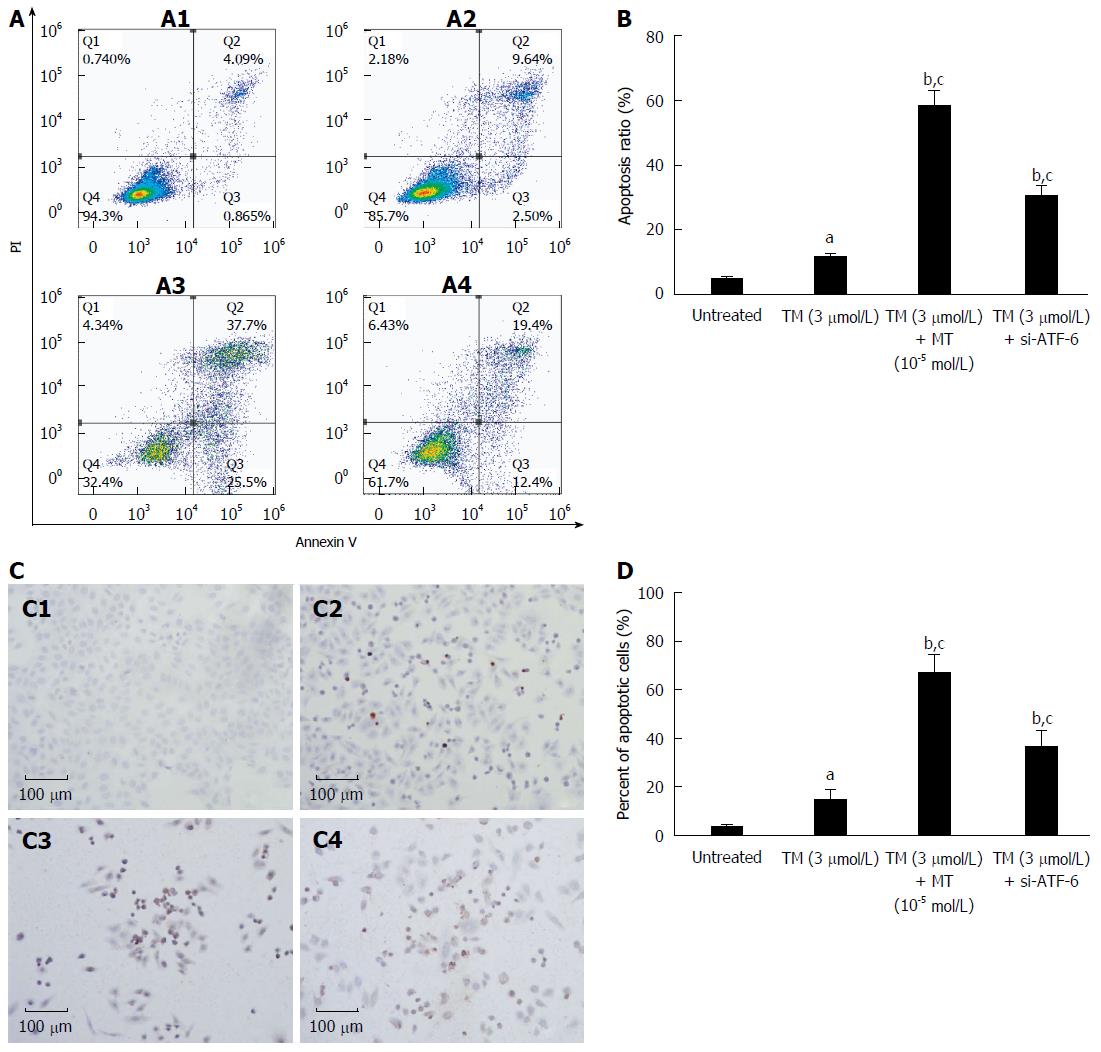
Figure 6 Comparison between melatonin and activating transcription factor 6 siRNA transfection on cell apoptosis in HepG2 cells under endoplasmic reticulum stress.
A: HepG2 cells were exposed to melatonin (10-5 mmol/L) for 24 h after pretreatment by tunicamycin (TM) for 8 h or were transfected with ATF-6 siRNA for 6 h after pretreatment by tunicamycin TM for 8 h. Apoptotic cells were determined by FACS, and the data are expressed as the mean ± SD. A1, Untreated HepG2 cells; A2, HepG2 cells treated by TM only; A3, HepG2 cells treated by combination of TM and melatonin (10-5 mmol/L); A4, HepG2 cells treated by ATF-6 siRNA and melatonin; B: Data are presented as the mean ± SD for the independent experiments (aP < 0.05 vs untreated HepG2 cells; bP < 0.01 vs untreated HepG2 cells; cP < 0.01 HepG2 cells treated by TM and melatonin vs HepG2 cells treated with TM and ATF-6 siRNA negative control); C: Cell morphology and percentage of apoptotic cells were examined by TUNEL staining. C1, Untreated HepG2 cells; C2, HepG2 cells treated by TM only; C3, HepG2 cells treated by combination of TM and melatonin (10-5 mmol/L); C4, HepG2 cells treated by ATF-6 siRNA and melatonin; D: Data are presented as the mean ± SD for the independent experiments (aP < 0.05 vs untreated HepG2 cells; bP < 0.01 vs untreated HepG2 cells; cP < 0.01 HepG2 cells treated by TM and melatonin vs HepG2 cells treated with TM and ATF-6 siRNA negative control). ATF-6: Activating transcription factor 6; MT: Melatonin.
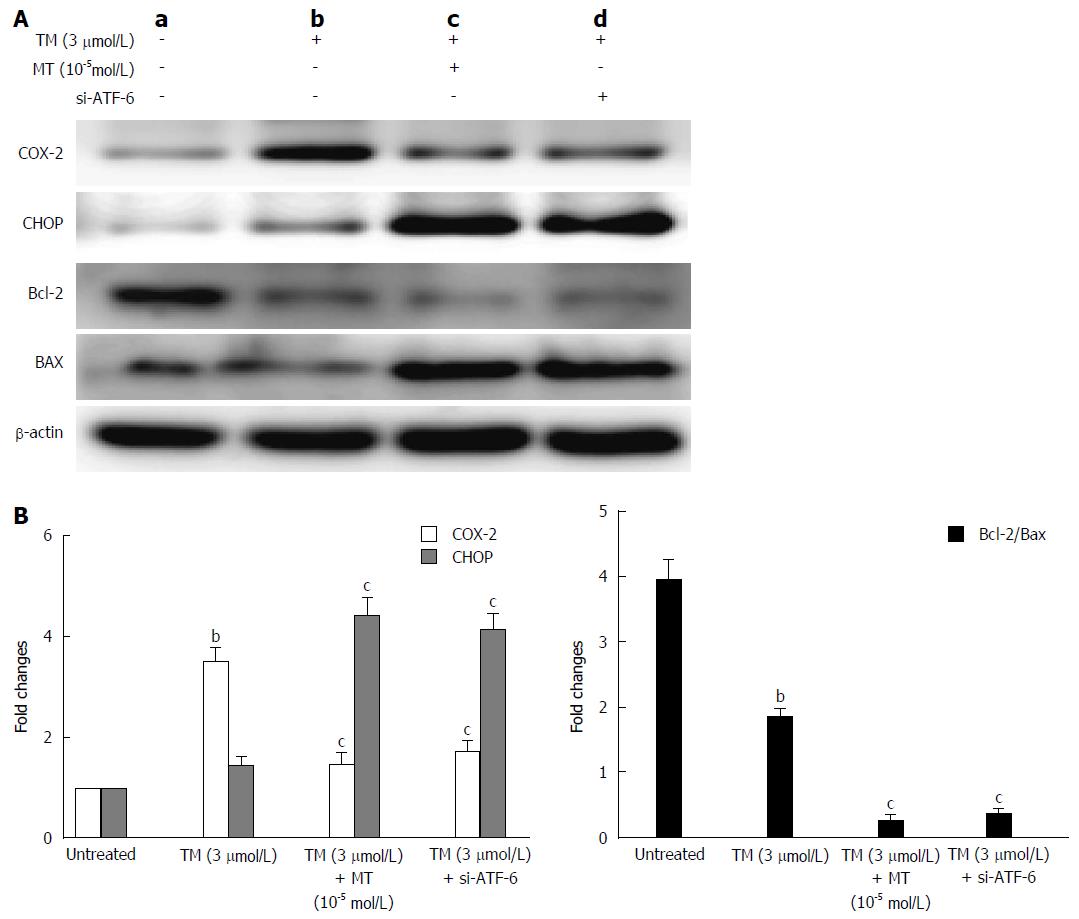
Figure 7 Pathway by which melatonin sensitized HepG2 to endoplasmic reticulum stress-induced apoptosis.
A: a, Untreated HepG2 cells; b, HepG2 cells treated by tunicamycin (TM) only; c, HepG2 cells treated by TM, melatonin (10-5 mmol/L); d: HepG2 cells treated by TM and ATF-6 siRNA. Equal protein amounts of cell lysates were subjected to western blot assay using anti-COX-2, anti-CHOP, anti-Bcl-2, and anti-Bax. β-actin in the same HepG2 cell extract was used as an internal reference; B: Optical density reading values of specific proteins are represented as fold-differences relative to the loading control protein, β-actin. cP < 0.01, CHOP vs the Bcl-2 and Bax expression, bP < 0.01, vs the untreated HepG2 cells. ATF-6: Activating transcription factor 6; COX-2: Cyclooxygenase-2; CHOP: CCAAT-enhancer-binding protein homologous protein; MT: Melatonin.
- Citation: Bu LJ, Yu HQ, Fan LL, Li XQ, Wang F, Liu JT, Zhong F, Zhang CJ, Wei W, Wang H, Sun GP. Melatonin, a novel selective ATF-6 inhibitor, induces human hepatoma cell apoptosis through COX-2 downregulation. World J Gastroenterol 2017; 23(6): 986-998
- URL: https://www.wjgnet.com/1007-9327/full/v23/i6/986.htm
- DOI: https://dx.doi.org/10.3748/wjg.v23.i6.986


