Copyright
©The Author(s) 2017.
World J Gastroenterol. Feb 14, 2017; 23(6): 976-985
Published online Feb 14, 2017. doi: 10.3748/wjg.v23.i6.976
Published online Feb 14, 2017. doi: 10.3748/wjg.v23.i6.976
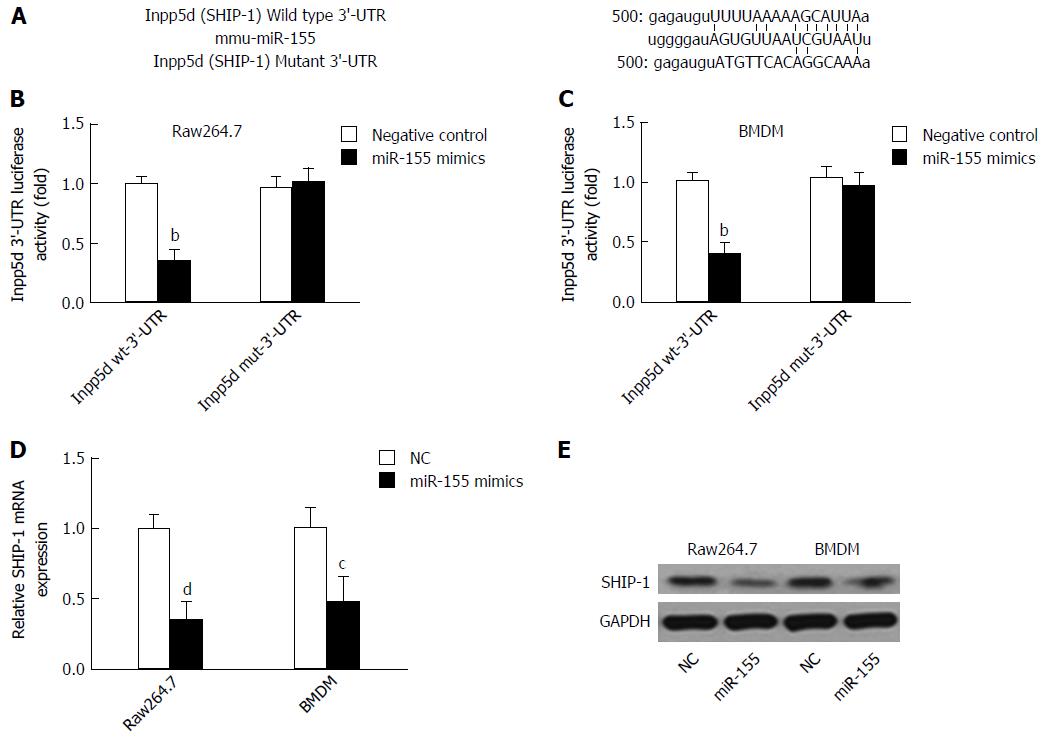
Figure 1 SHIP-1 is targeted by microRNA-155 in mouse macrophages.
A: A mouse Inpp5d 3’-UTR fragment containing the wild-type or mutant miR-155-binding sequence was cloned downstream to the luciferase reporter gene; B and C: The luciferase activity of Inpp5d 3’-UTR in raw264.7 cells (B) or primary mouse bone marrow-derived macrophages (BMDMs) (C) after transfection with miR-155 mimics or negative controls. aP < 0.05, bP < 0.01 vs the wild-type Inpp5d 3’-UTR luciferase activity in cells transfected with NCs; D: The mRNA level of SHIP-1 was significantly down-regulated in raw 254.7 cells and BMDMs after cells were transfected with miR-155 mimics. cP < 0.05, dP < 0.01 vs controls. B: The protein level of SHIP-1 also reduced after miR-155 mimics transfection.
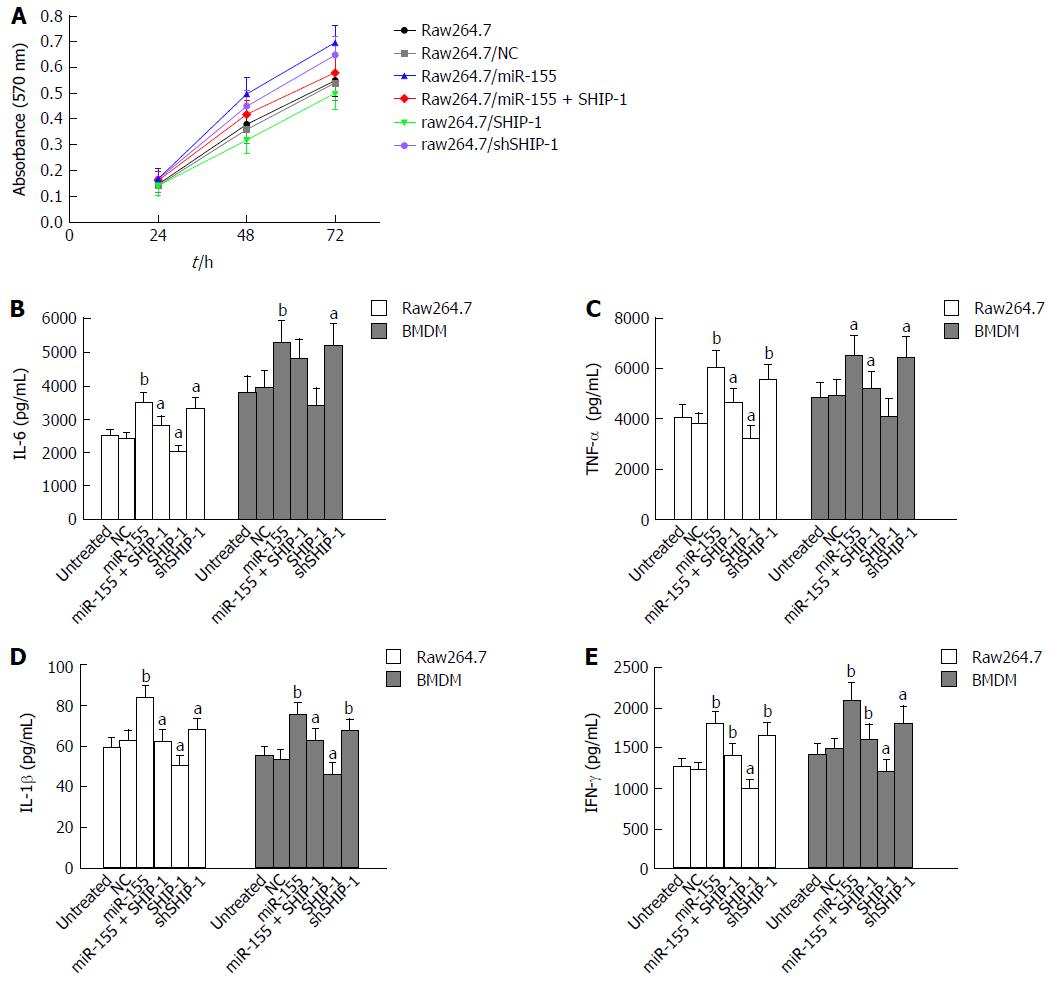
Figure 2 Effects of microRNA-155 and its target SHIP-1 on cell proliferation and pro-inflammatory capabilities.
A: The proliferation rate of raw264.7 cells transfected with miR-155 mimics, the negative controls, miR-155 mimics + SHIP-1 vectors, SHIP-1 expression vectors, or SHIP-1 knockdown vectors was detected by MTT assay. aP < 0.05 indicated there was significant difference between groups. B-E: ELISA analyses of the secretion of IL-6 (B), TNF-α (C), IL-1β (D), and IFN-γ (E) in both the raw264.7 cells and mouse bone marrow-derived macrophages (BMDMs) and the respective cells transfected with miR-155 mimics, the negative controls, miR-155 mimics + SHIP-1 vectors, SHIP-1 expression vectors, or SHIP-1 knockdown vectors. Comparison was conducted between groups: Raw264.7/miR-155, raw264.7/SHIP-1, raw264.7/shSHIP-1 vs Raw264.7, Raw264.7/NC; Raw264.7/miR-155+SHIP-1 vs Raw264.7/miR-155. aP < 0.05, bP < 0.01.
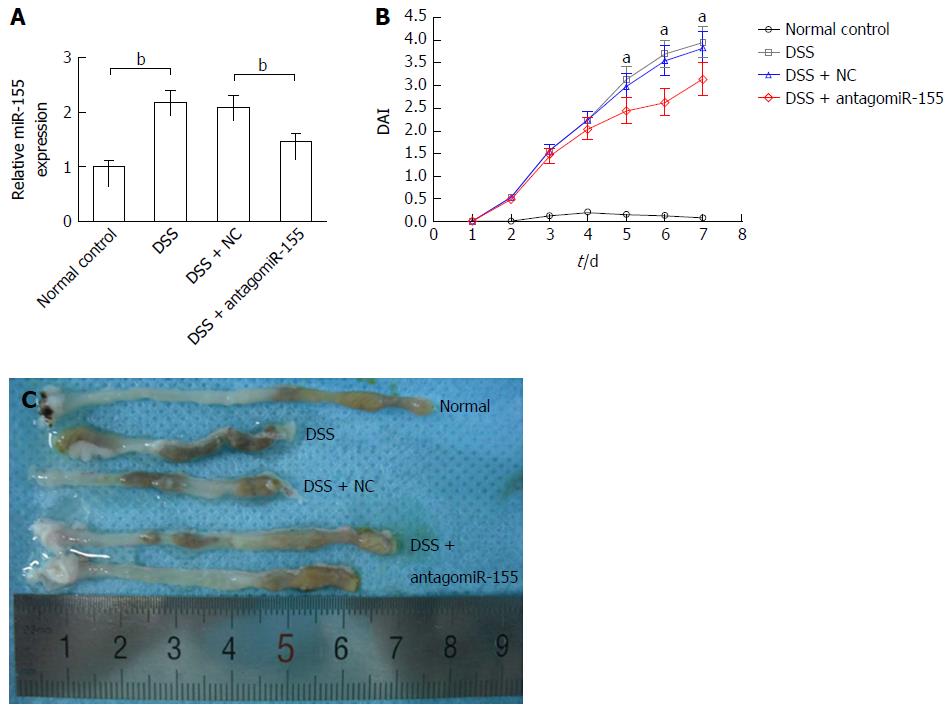
Figure 3 Inhibition of microRNA-155 alleviated mouse experimental colitis.
A: AntagomiR-155 treatment significantly reduced the expression level of miR-155 in colon tissues. bP < 0.01, dextran sulfate sodium (DSS) vs control, DSS + antagomiR-155 vs DSS + NC; B: Inhibition of miR-155 markedly decreased the disease activity index of experimental colitis. aP < 0.05, DSS + antagomiR-155 vs DSS + NC, DSS; C: AntagomiR-155 treatment alleviated the shortening of colon induced by DSS.
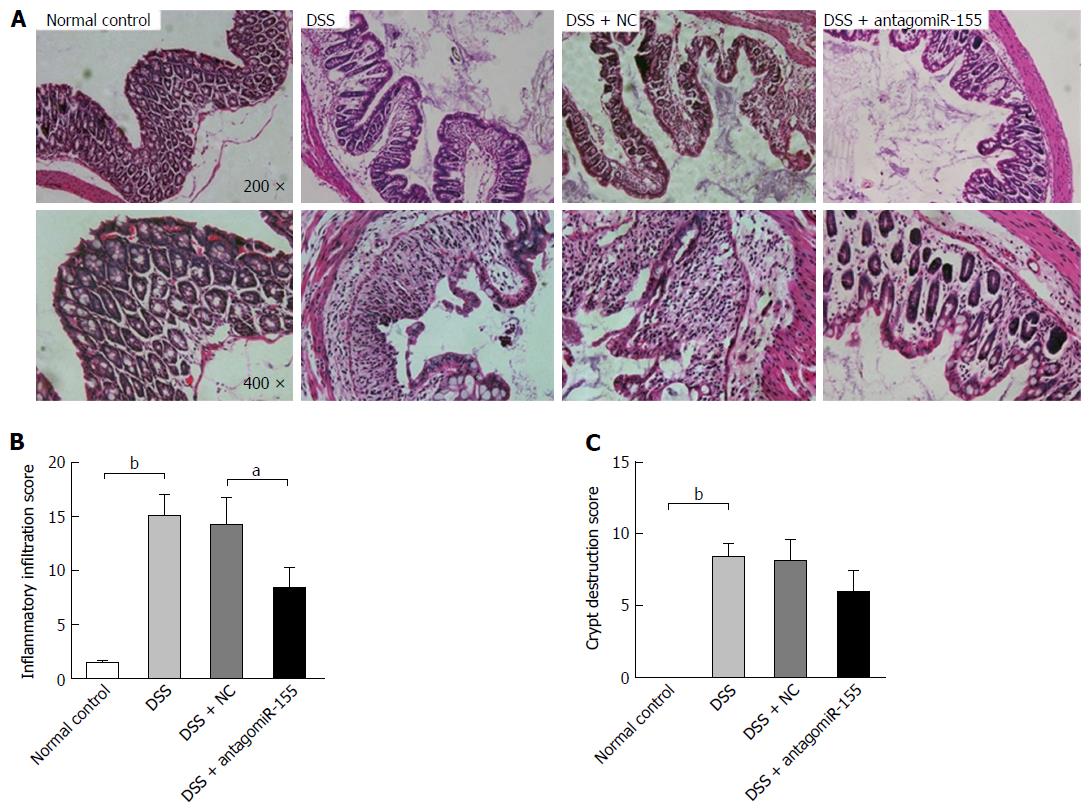
Figure 4 Effects of antagomiR-155 on dextran sulfate sodium-induced histological changes in intestinal mucosa.
A: Representative histological images of colon tissues from mice in differently treated groups (original magnification, upper panel, × 200; lower panel, × 400); B: Microscopic inflammatory infiltration score. bP < 0.01, DSS vs control; aP < 0.05, DSS + antagomiR-155 vs DSS + NC; C: Microscopic crypt destruction score. bP < 0.01, DSS vs control. DSS: Dextran sulfate sodium.
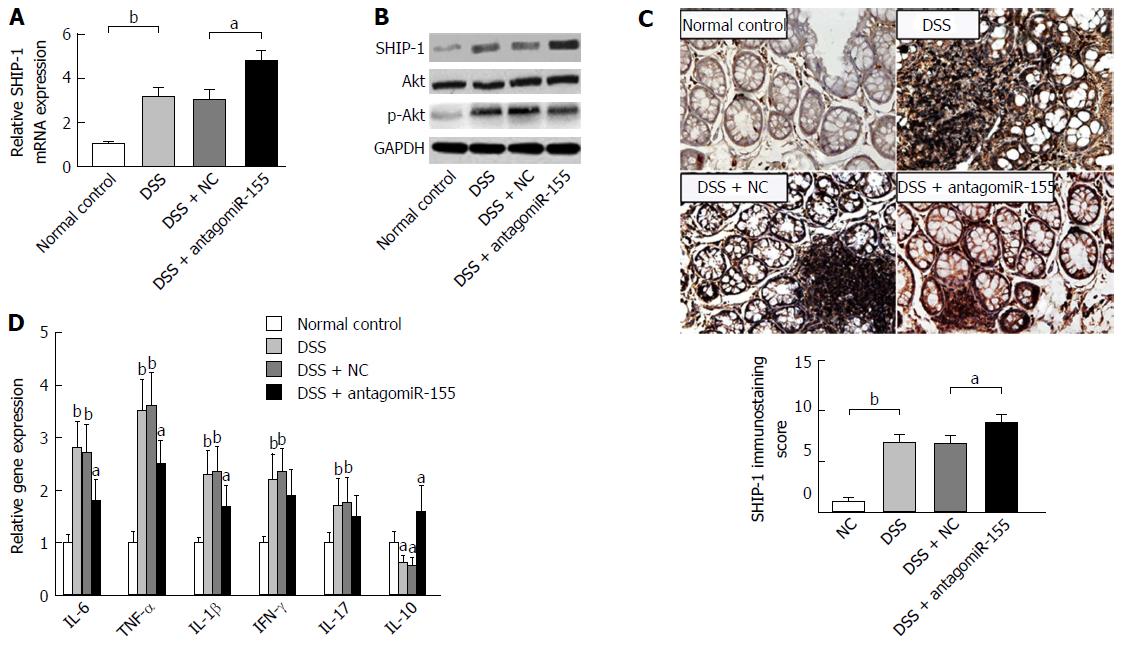
Figure 5 Inhibition of microRNA-155 alleviates colitis by regulating the SHIP-1/Akt signaling pathway.
A: AntagomiR-155 treatment elevated the mRNA expression of SHIP-1. bP < 0.01, DSS vs control; aP < 0.05, DSS + antagomiR-155 vs DSS + NC; B: Western blot analysis of the protein levels of SHIP-1, Akt, and p-Akt after antagomiR-155 treatment, with normalized to GAPDH; C: Immunohistochemistry staining and semi-quantification for SHIP-1 in mice colon tissues. bP < 0.01, DSS vs control; aP < 0.05, DSS + antagomiR-155 vs DSS + NC. D: The mRNA expression levels of key factors involved in colitis-related inflammatory response. Comparison was conducted between groups: DSS, DSS + NC vs control; and DSS + antagomiR-155 vs DSS, DSS + NC. aP < 0.05, bP < 0.01. DSS: Dextran sulfate sodium.
- Citation: Lu ZJ, Wu JJ, Jiang WL, Xiao JH, Tao KZ, Ma L, Zheng P, Wan R, Wang XP. MicroRNA-155 promotes the pathogenesis of experimental colitis by repressing SHIP-1 expression. World J Gastroenterol 2017; 23(6): 976-985
- URL: https://www.wjgnet.com/1007-9327/full/v23/i6/976.htm
- DOI: https://dx.doi.org/10.3748/wjg.v23.i6.976


