Copyright
©The Author(s) 2017.
World J Gastroenterol. Feb 7, 2017; 23(5): 751-762
Published online Feb 7, 2017. doi: 10.3748/wjg.v23.i5.751
Published online Feb 7, 2017. doi: 10.3748/wjg.v23.i5.751
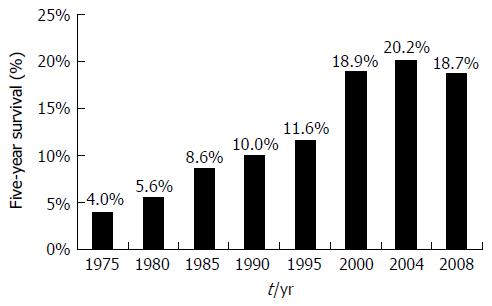
Figure 1 Five-year survival trends in esophageal cancer.
Data from Surveillance, Epidemiology, and End Results Cancer Statistics Factsheets: Esophageal Cancer. National Cancer Institute. Bethesda, MD[9].
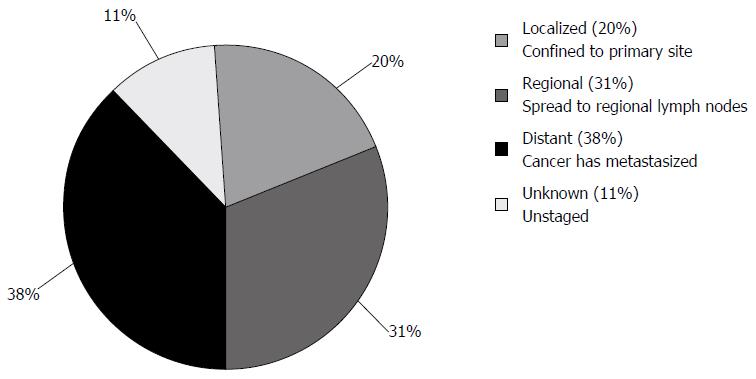
Figure 2 Esophageal cancer stages at diagnosis.
Surveillance, Epidemiology, and End Results Cancer Statistics Factsheets: Esophageal Cancer. National Cancer Institute. Bethesda, MD[9].
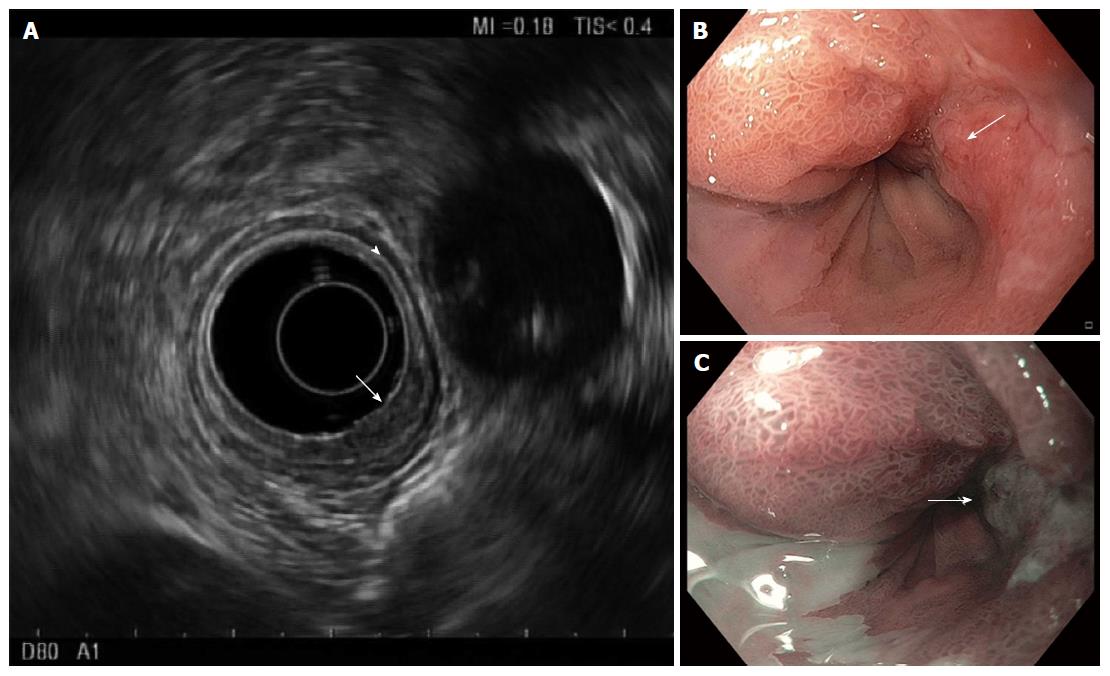
Figure 3 Endosonography of distal esophageal adenocarcinoma.
A: Five layers of the esophagus are visible with standard frequency (7.5 MHz) endoscopic ultrasound. From innermost to outermost: the hyperechoic (bright) superficial mucosa, hypoechoic (dark) deep mucosa, the submucosa (arrowhead), followed by the muscularis propria (hypoechoic, very dark), and adventitia (outer echogenic layer). The T1b adenocarcinoma (arrow) causes thickening and distortion of the mucosal layers and submucosa, without invasion of the muscularis propria; B: White-light; and C: Narrow band images are presented for comparison, with arrows to mark the cancer.
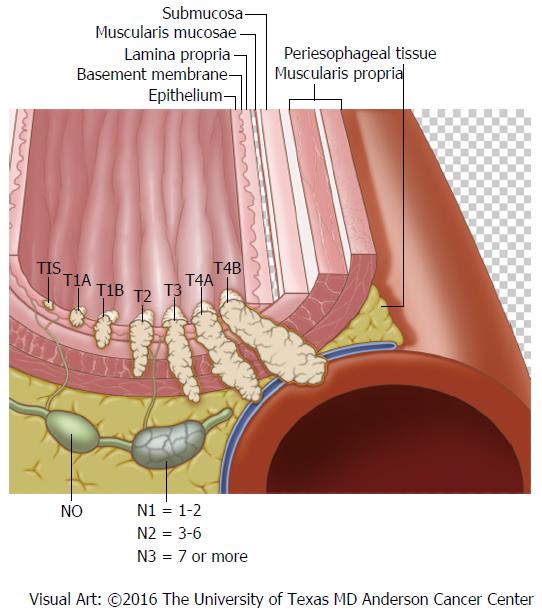
Figure 4 Locoregional esophageal cancer staging.
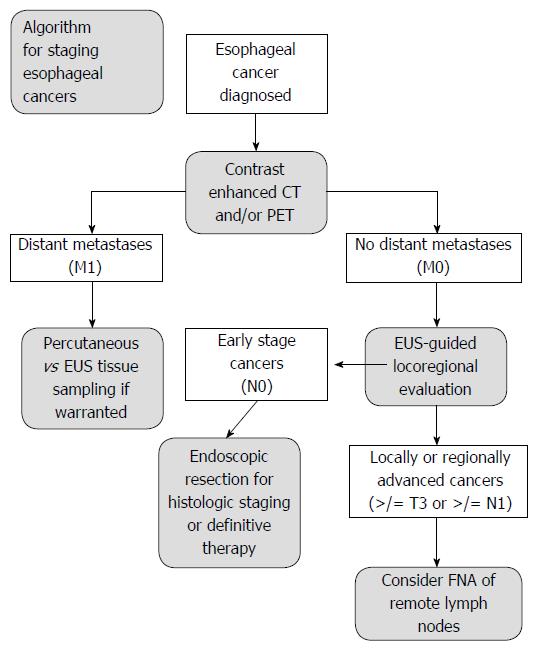
Figure 5 Algorithm for staging esophageal cancers proposed by DaVee and Lee.
Esophagogastric junction cancers excluded. EUS: Endoscopic ultrasound with selective fine-needle aspiration; T, N, M: Tumor, node, and metastasis stages; CT: Computed tomography; PET: Positron emission tomography; FNA: Fine-needle aspiration.
- Citation: DaVee T, Ajani JA, Lee JH. Is endoscopic ultrasound examination necessary in the management of esophageal cancer? World J Gastroenterol 2017; 23(5): 751-762
- URL: https://www.wjgnet.com/1007-9327/full/v23/i5/751.htm
- DOI: https://dx.doi.org/10.3748/wjg.v23.i5.751


