Copyright
©The Author(s) 2017.
World J Gastroenterol. Dec 28, 2017; 23(48): 8562-8569
Published online Dec 28, 2017. doi: 10.3748/wjg.v23.i48.8562
Published online Dec 28, 2017. doi: 10.3748/wjg.v23.i48.8562
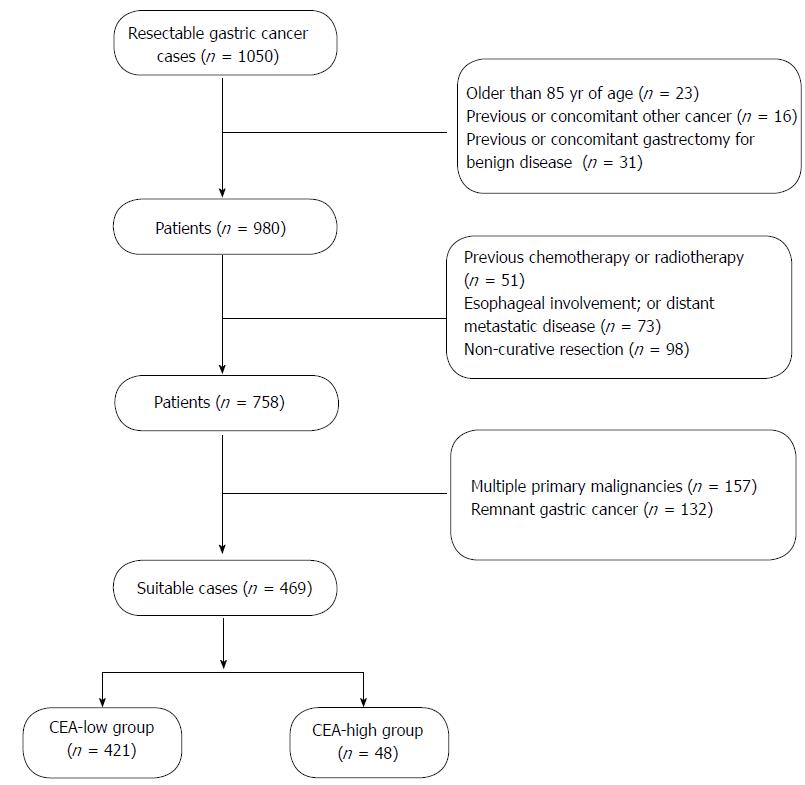
Figure 1 Inclusion and exclusion criteria.
CEA: Carcinoembryonic antigen.
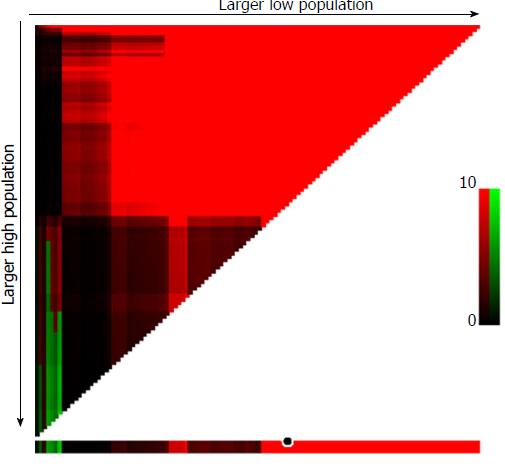
Figure 2 Division of patients by the cut-off points produced by X-tile plot.
X-tile plots for CEA. The produced log-rank χ2 value stratifies the pTxN0M0 GC patients into two groups by a cut-off value 30.02 ng/mL, showing a strong discriminatory capacity, with a χ2 value of 85.15 and a relative risk ratio of 1:2.15. CEA: Carcinoembryonic antigen.
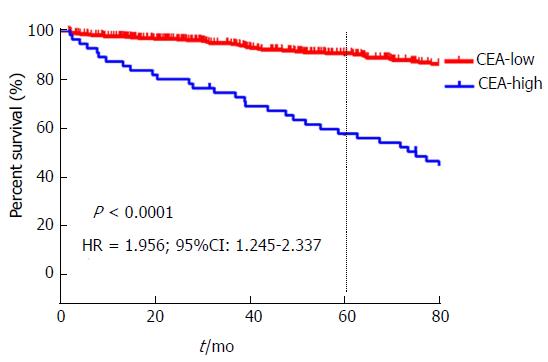
Figure 3 Survival analysis of pN0 patients with gastric cancer undergoing curative intent surgery.
The P values for the survival comparison was determined by the log-rank test. CEA: Carcinoembryonic antigen.
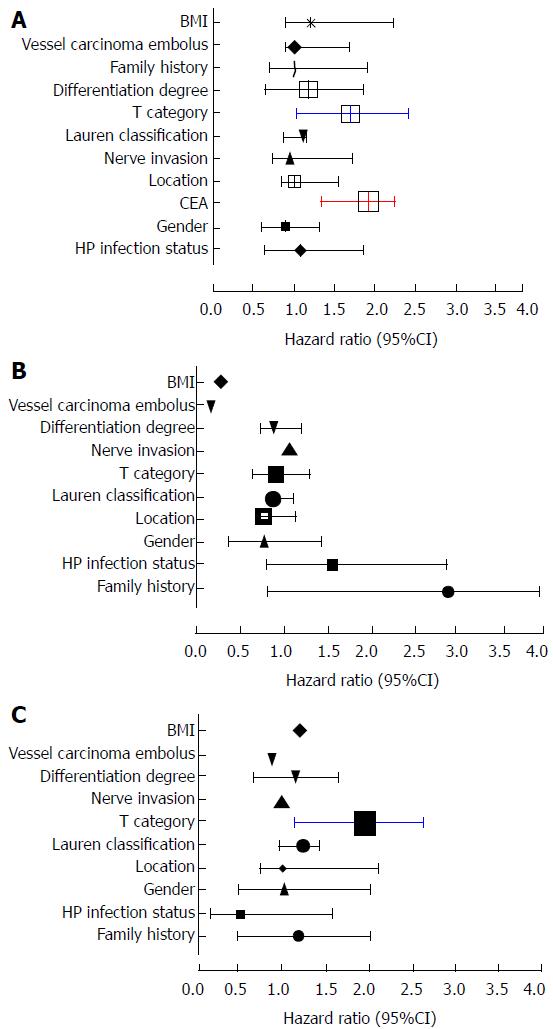
Figure 4 Univariate and multivariate analyses for pN0 gastric cancer patients using the Cox regression model.
A: HR was calculated in multivariate analyses; B: HR was calculated in CEA-low group; C: HR was calculated for CEA-high group. CEA: Carcinoembryonic antigen; HR: Hazard ratio.
- Citation: Xiao J, Ye ZS, Wei SH, Zeng Y, Lin ZM, Wang Y, Teng WH, Chen LC. Prognostic significance of pretreatment serum carcinoembryonic antigen levels in gastric cancer with pathological lymph node-negative: A large sample single-center retrospective study. World J Gastroenterol 2017; 23(48): 8562-8569
- URL: https://www.wjgnet.com/1007-9327/full/v23/i48/8562.htm
- DOI: https://dx.doi.org/10.3748/wjg.v23.i48.8562


