Copyright
©The Author(s) 2017.
World J Gastroenterol. Dec 14, 2017; 23(46): 8248-8255
Published online Dec 14, 2017. doi: 10.3748/wjg.v23.i46.8248
Published online Dec 14, 2017. doi: 10.3748/wjg.v23.i46.8248
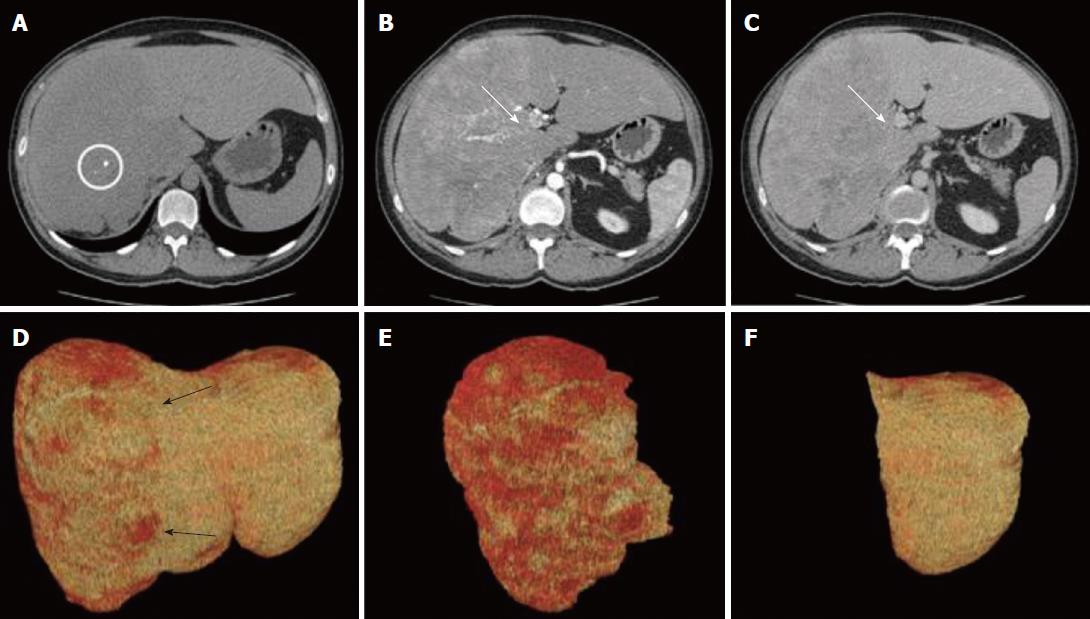
Figure 1 Computer tomography examination and virtual resection.
A: Pre-contrast acquisition, axial image cranial to the hilar plane showing a large, hypo-attenuating lobulated lesion involving the right hemi-liver and part of the segment 4 (white circle: calcification within the neoplastic lesion); B and C: Axial images across the hilar plane during arterial (B) and portal (C) phase. Then neoplastic, lobulated lesion shows early arterial enhancement resulting in hypo-attenuation during the portal phase. The right portal branch is not visible due to neoplastic infiltration (white arrows); D-F: Virtual resection, volume renderings of CT images; D: Total liver volume; the non-homogenous red color of the right hemi-liver corresponds to the lesion (black arrows); E: Tumor lesion; F: Future remnant liver corresponding to segments 2 and 3.
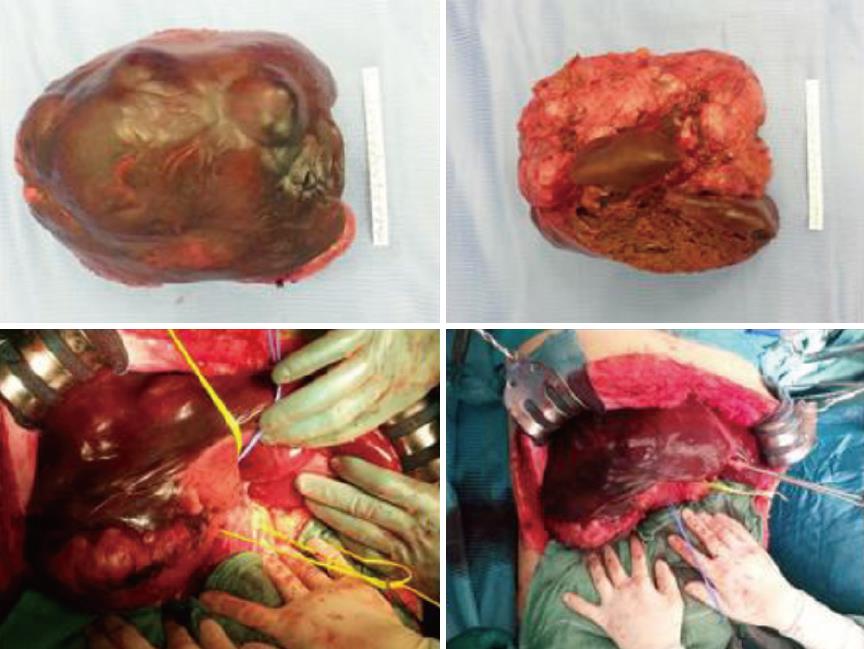
Figure 2 Intra-operatory images and tumoral tissue.
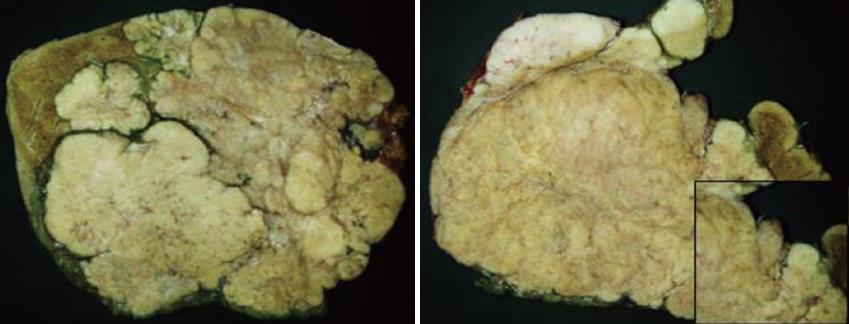
Figure 3 Grossly, right hepatic lobe was almost entirely occupied by a well-circumscribed multinodular mass with homogeneous, whitish cut surface and with calcification areas.
In detail, macroscopic neoplastic vascular invasion of a portal vein branch.
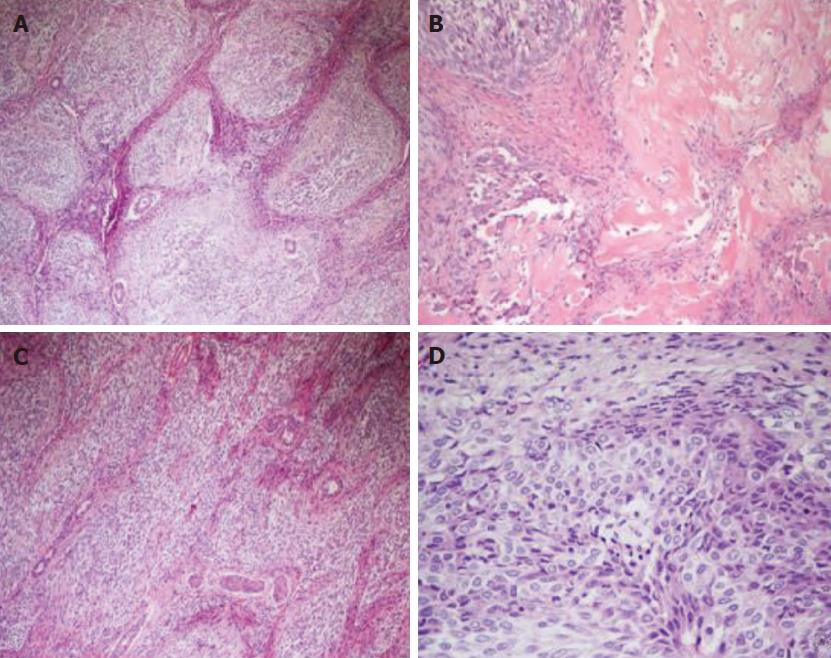
Figure 4 Tumor showing organoid appearance with well-demarcated nests in a myofibroblastic stroma (A).
B: Areas of osseous metaplasia and calcifications; C: Epithelioid and spindle cellular nests with bile ducts entrapped in fibrous stroma; D: Epithelioid and spindle-shape cells with eosinophilic and clear cytoplasm.
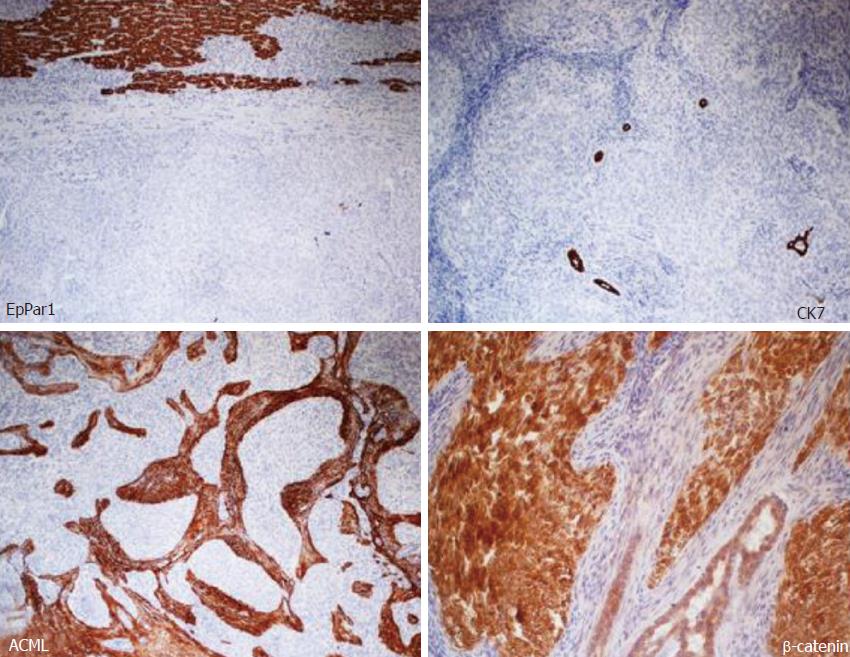
Figure 5 Immunohistochemical stains showing neoplasm negativity for hepatocyte paraffin 1 (EpPar1) (counterstained normal liver parenchyma), negativity for CK7 (highlighted entrapped bile ducts between the tumor cell), stromal positivity for ACML and positivity for β-catenin (both membrane and nuclear).
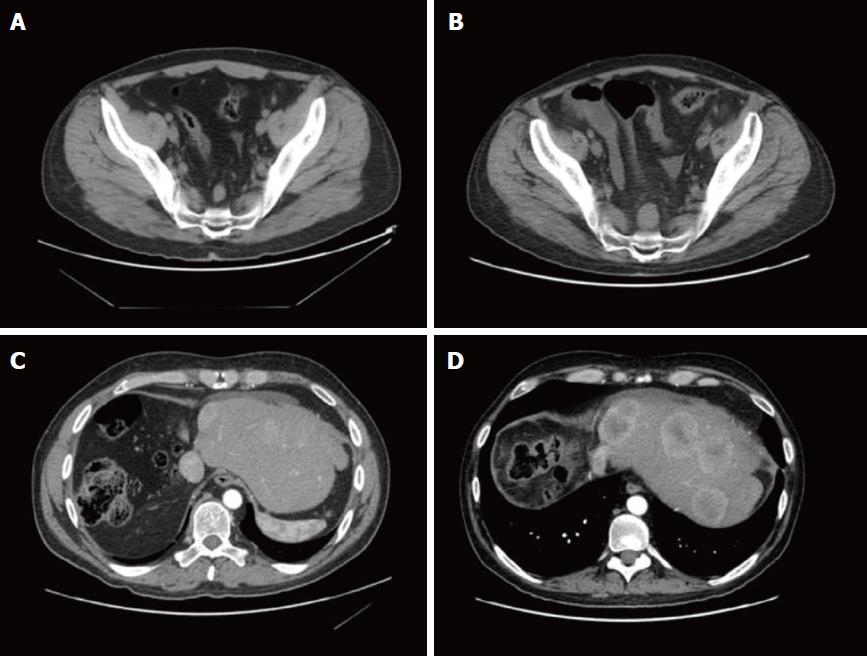
Figure 6 Computer tomography scan.
A: CT scan performed in November 2015 showing the sacral lesion; B: CT scan performed in April 2016 showing increase of the sacral lesion; C: CT scan performed in November 2015 showing liver lesions; D: CT scan performed in April 2016 showing increase of liver lesions. CT: Computer tomography.
- Citation: Meletani T, Cantini L, Lanese A, Nicolini D, Cimadamore A, Agostini A, Ricci G, Antognoli S, Mandolesi A, Guido M, Alaggio R, Giuseppetti GM, Scarpelli M, Vivarelli M, Berardi R. Are liver nested stromal epithelial tumors always low aggressive? World J Gastroenterol 2017; 23(46): 8248-8255
- URL: https://www.wjgnet.com/1007-9327/full/v23/i46/8248.htm
- DOI: https://dx.doi.org/10.3748/wjg.v23.i46.8248


