Copyright
©The Author(s) 2017.
World J Gastroenterol. Dec 14, 2017; 23(46): 8169-8181
Published online Dec 14, 2017. doi: 10.3748/wjg.v23.i46.8169
Published online Dec 14, 2017. doi: 10.3748/wjg.v23.i46.8169
Figure 1 Chemical structure of the major components of Shengjiang decoction detected in the serum and pancreas.
A: Emodin; B: Aloe-emodin; C: Rhein; D: Chrysophano; E: Curcumin; F: Demethoxycurcumin; G: Bisdemethoxycurcumin.
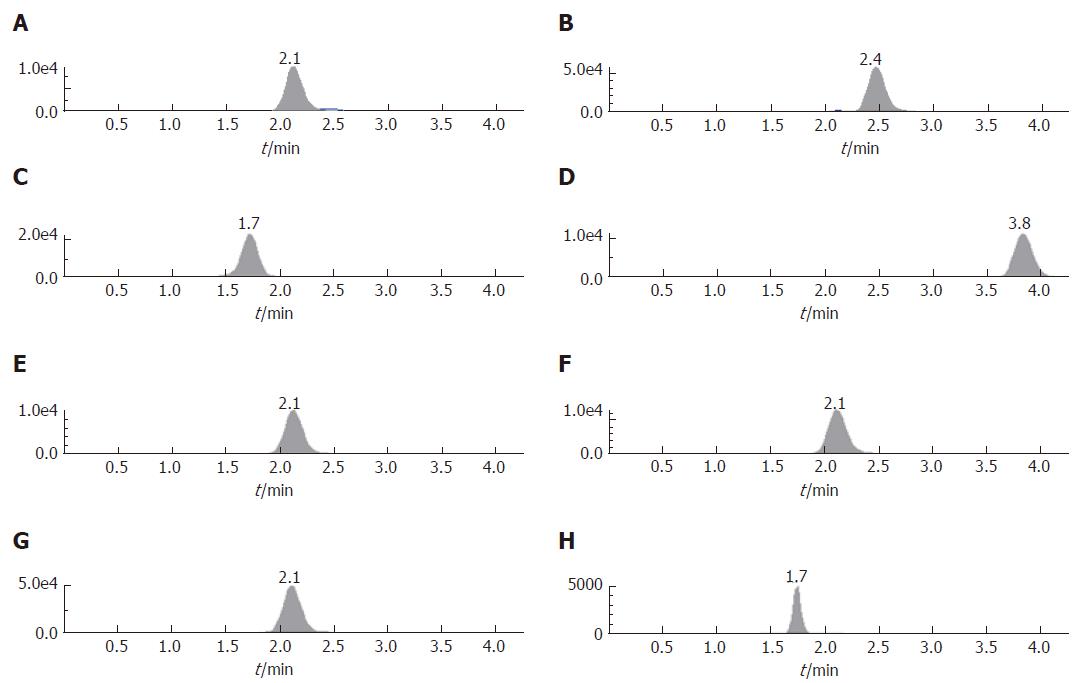
Figure 2 HPLC chromatograms of the major components of Shengjiang decoction detected in the serum and pancreas.
A: Emodin; B: Aloe-emodin; C: Rhein; D: Chrysophanol; E: Curcumin; F: Demethoxycurcumin; G: Bisdemethoxycurcumin; H: Internal standard (I.S.).
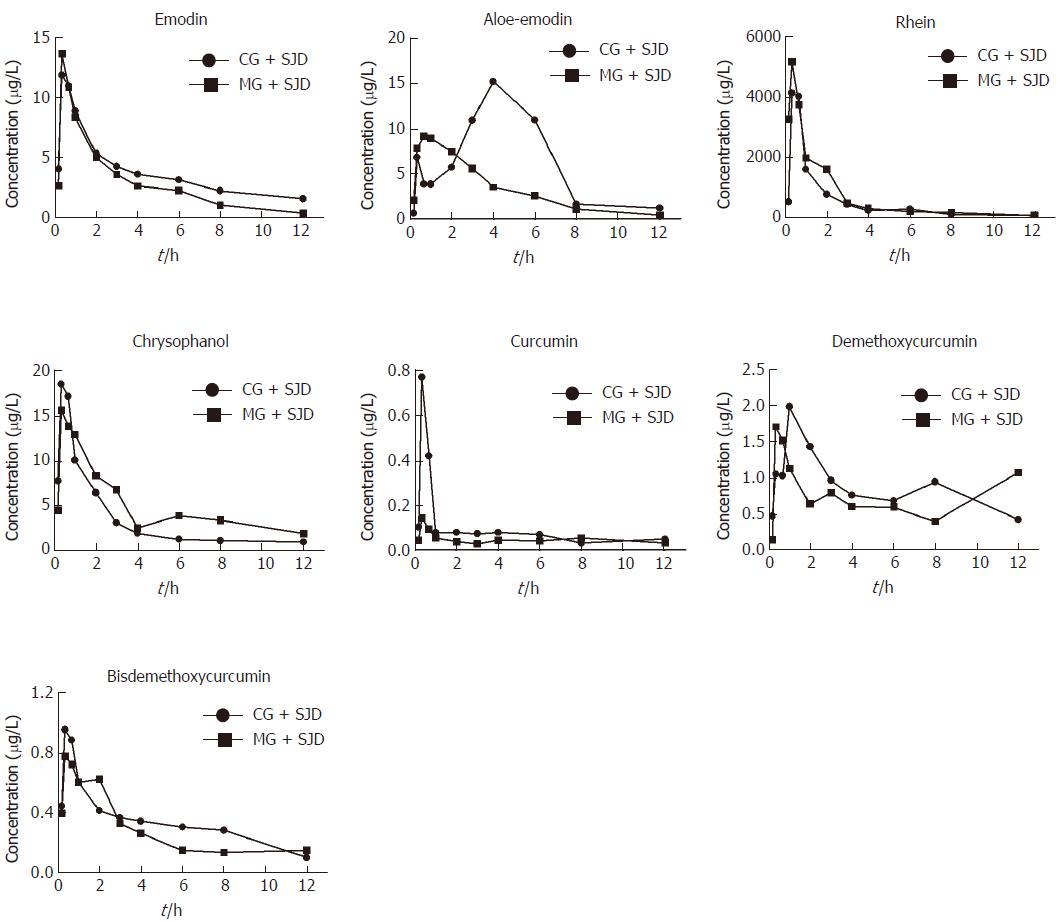
Figure 3 Estimated concentration-time curves of seven components in the two groups.
Twelve male Sprague-Dawley rats were randomly divided into a control group treated with SJD (CG + SJD) and a model group treated with SJD (MG + SJD), both of which were orally administered with SJD (5 g/kg) 2 h after surgery. Blood samples were collected via the tail vein at 10, 20, and 40 min and 1, 2, 3, 4, 6, 8, and 12 h after a single dose of SJD to detect its main components.
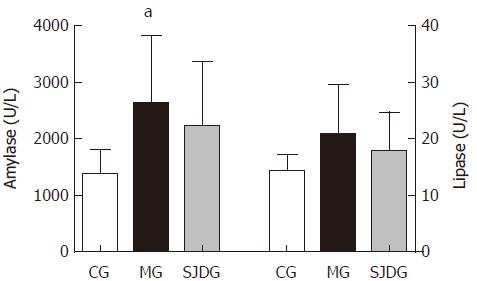
Figure 4 Amylase and lipase concentrations of the control group, model group, and Shengjiang decoction group.
Rats were randomly divided into a control group (CG), an AP model group (MG), and an SJD treated AP group (SJDG) (n = 6 per group). The rats were sacrificed 12 h after administration of SJD. Blood samples were collected to obtain serum samples to measure amylase and lipase. Data are expressed as mean ± SD. aP < 0.05 vs CG.
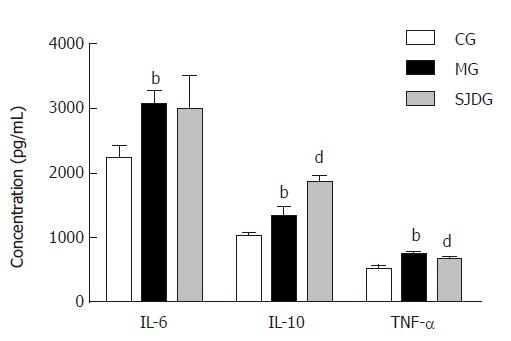
Figure 5 Serum concentrations of IL-6, IL-10, and TNF-α in the control group, model group, and Shengjiang decoction group.
Rats were randomly divided into a control group (CG), an AP model group (MG), and an SJD treated AP group (SJDG) (n = 6 per group). The rats were sacrificed 12 h after administration of SJD. Blood samples were collected to obtain serum samples to measure IL-6, IL-10, and TNF-α. Data are expressed as mean ± SD. bP < 0.01 vs CG; dP < 0.01 vs MG.
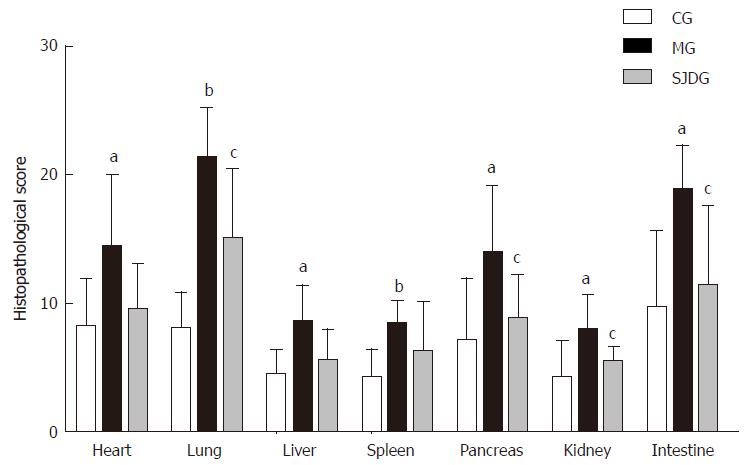
Figure 6 Pathological scores of multiple organs in the control group, model group, and Shengjiang decoction group.
Rats were randomly divided into a control group (CG), an AP model group (MG), and an SJD treated AP group (SJDG) (n = 6 per group). The rats were sacrificed 12 h after administration of SJD. Tissue samples were collected for pathological examination. Data are expressed as mean ± SD. aP < 0.05 vs CG; bP < 0.01 vs CG; cP < 0.05 vs MG; dP < 0.01 vs MG.
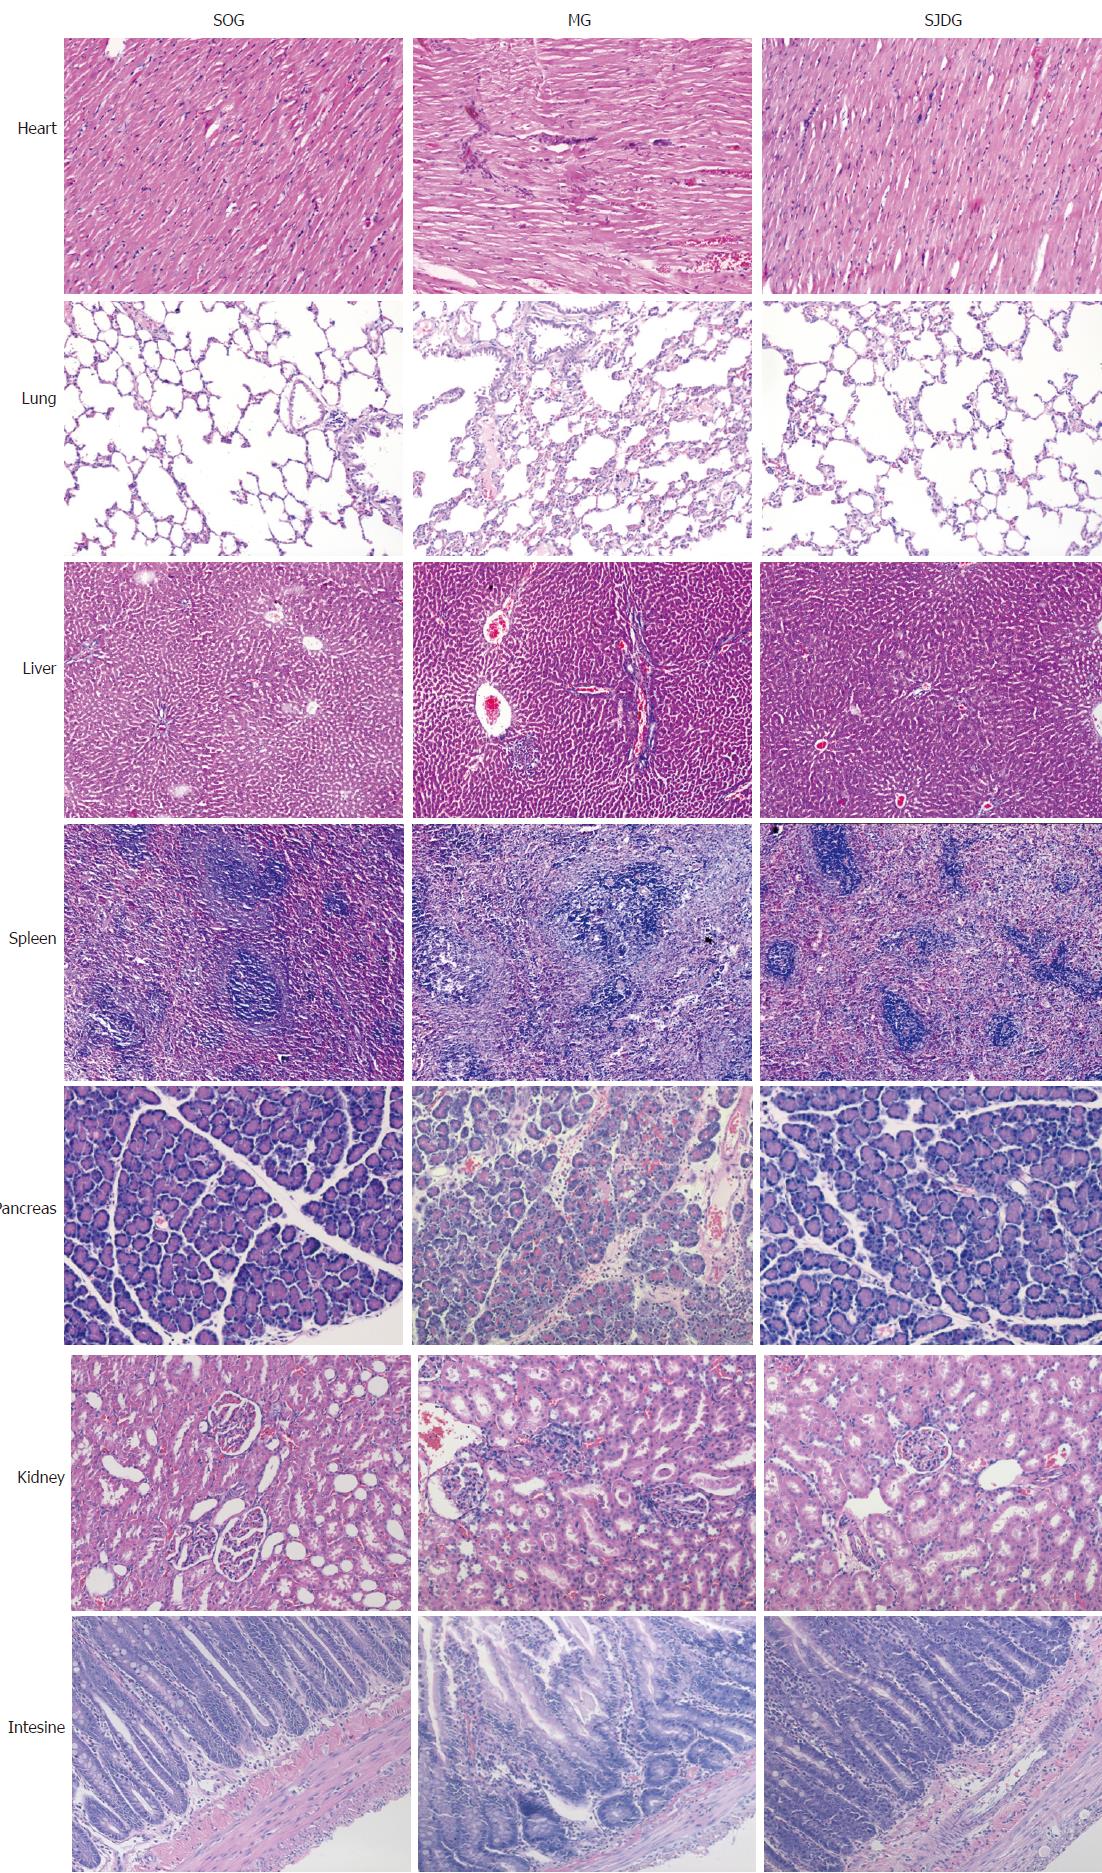
Figure 7 Pathological images of multiple organs from the control group, model group, and Shengjiang decoction group.
Pathological images of the heart (HE, × 200), lung (HE, × 200), liver (HE, × 100), spleen (HE, × 100), pancreas (HE, × 200), kidney (HE, × 200), and intestine (HE, × 100) in the CG, MG, and SJDG. CG: Control group; MG: AP model group; SJDG: SJD treated AP group.
- Citation: Zhu L, Li JY, Zhang YM, Kang HX, Chen H, Su H, Li J, Tang WF. Pharmacokinetics and pharmacodynamics of Shengjiang decoction in rats with acute pancreatitis for protecting against multiple organ injury. World J Gastroenterol 2017; 23(46): 8169-8181
- URL: https://www.wjgnet.com/1007-9327/full/v23/i46/8169.htm
- DOI: https://dx.doi.org/10.3748/wjg.v23.i46.8169


