Copyright
©The Author(s) 2017.
World J Gastroenterol. Dec 7, 2017; 23(45): 7965-7977
Published online Dec 7, 2017. doi: 10.3748/wjg.v23.i45.7965
Published online Dec 7, 2017. doi: 10.3748/wjg.v23.i45.7965
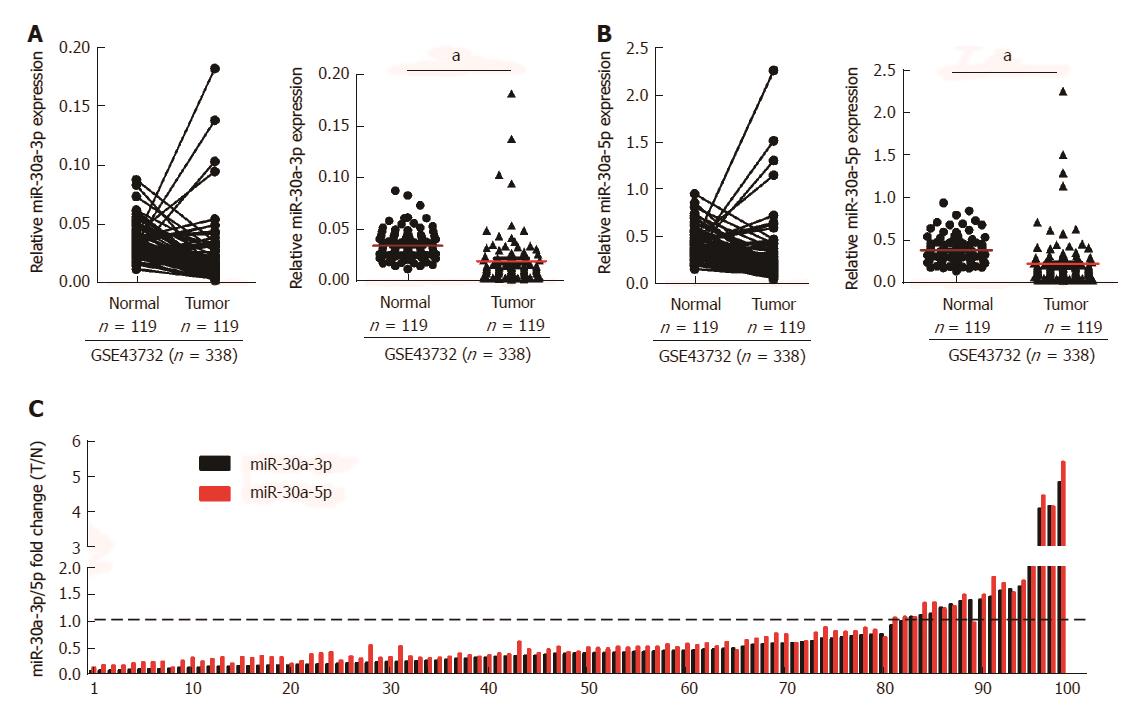
Figure 1 Expression of miR-30a-3p and miR-30a-5p in esophageal squamous cell carcinoma tissues and matched adjacent normal tissues.
A and B: Analyses of miR-30a-3p and miR-30a-5p expression in ESCC tissues (n = 119) and matched adjacent normal tissues (n = 119). Accession number of the public microarray data from GEO database is GSE43732; C: Validation through qPCR of miR-30a-3p and miR-30a-5p expression patterns in 99 cases of fresh ESCC biopsies and their paired adjacent normal tissues. The expression levels of mRNA were normalized with U6. Fold changes of miR-30a-3p/5p were calculated by the ratio of miR-30a-3p/5p expression in ESCC tissues (T) and matched to adjacent normal tissues (N); aP < 0.05.
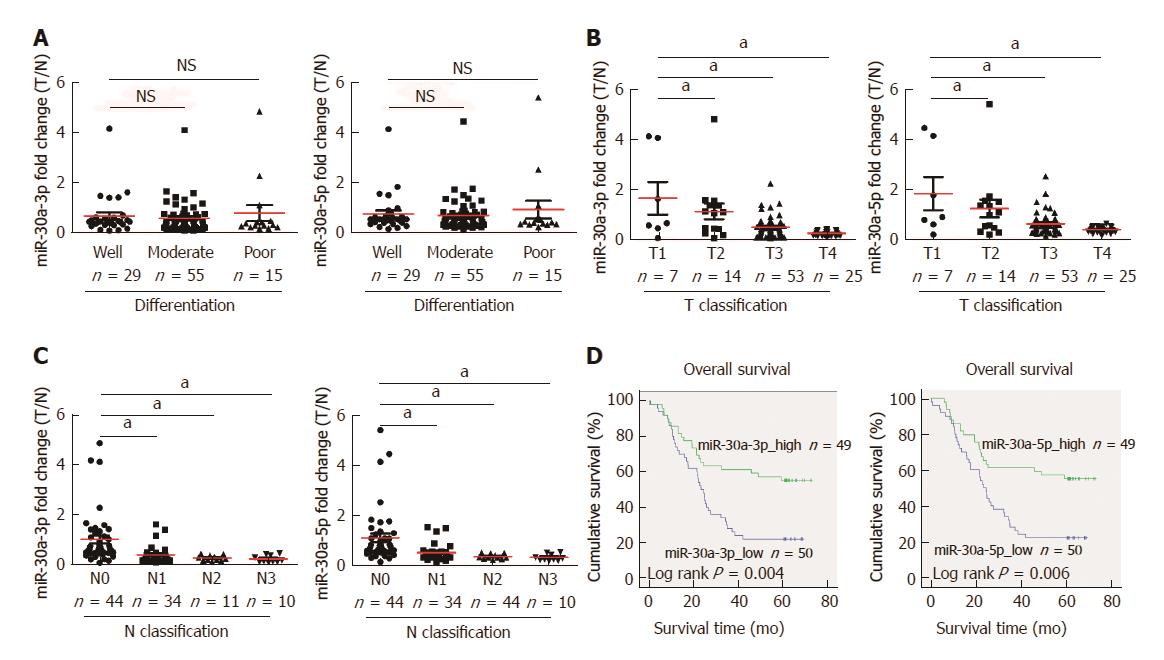
Figure 2 Down-regulation of miR-30a-3p/5p correlates with esophageal squamous cell carcinoma progression and clinical prognosis.
Analyses of miR-30a-3p and miR-30a-5p expression were performed in 99 cases of esophageal squamous cell carcinoma tissues, which was normalized by U6 expression. Red lines within figures indicate the mean values of miR-30a-3p and miR-30a-5p expression fold changes. A: Expression fold changes of miR-30a-3p (left) and miR-30a-5p (right) in different statuses of differentiation of ESCC, with no significant difference found between different groups; B: Expression fold changes of miR-30a-3p (left) and miR-30a-5p (right) in different T classifications of ESCC, aP < 0.05; C: Expression fold changes of miR-30a-3p (left) and miR-30a-5p (right) in different N classifications of ESCC, aP < 0.05; D: Overall survival time was analyzed by the Kaplan-Meier method in ESCC patients with relatively high (n = 49) or low (n = 50) expression of miR-30a-3p (left, P = 0.004) and miR-30a-5p (right, P = 0.006), respectively.
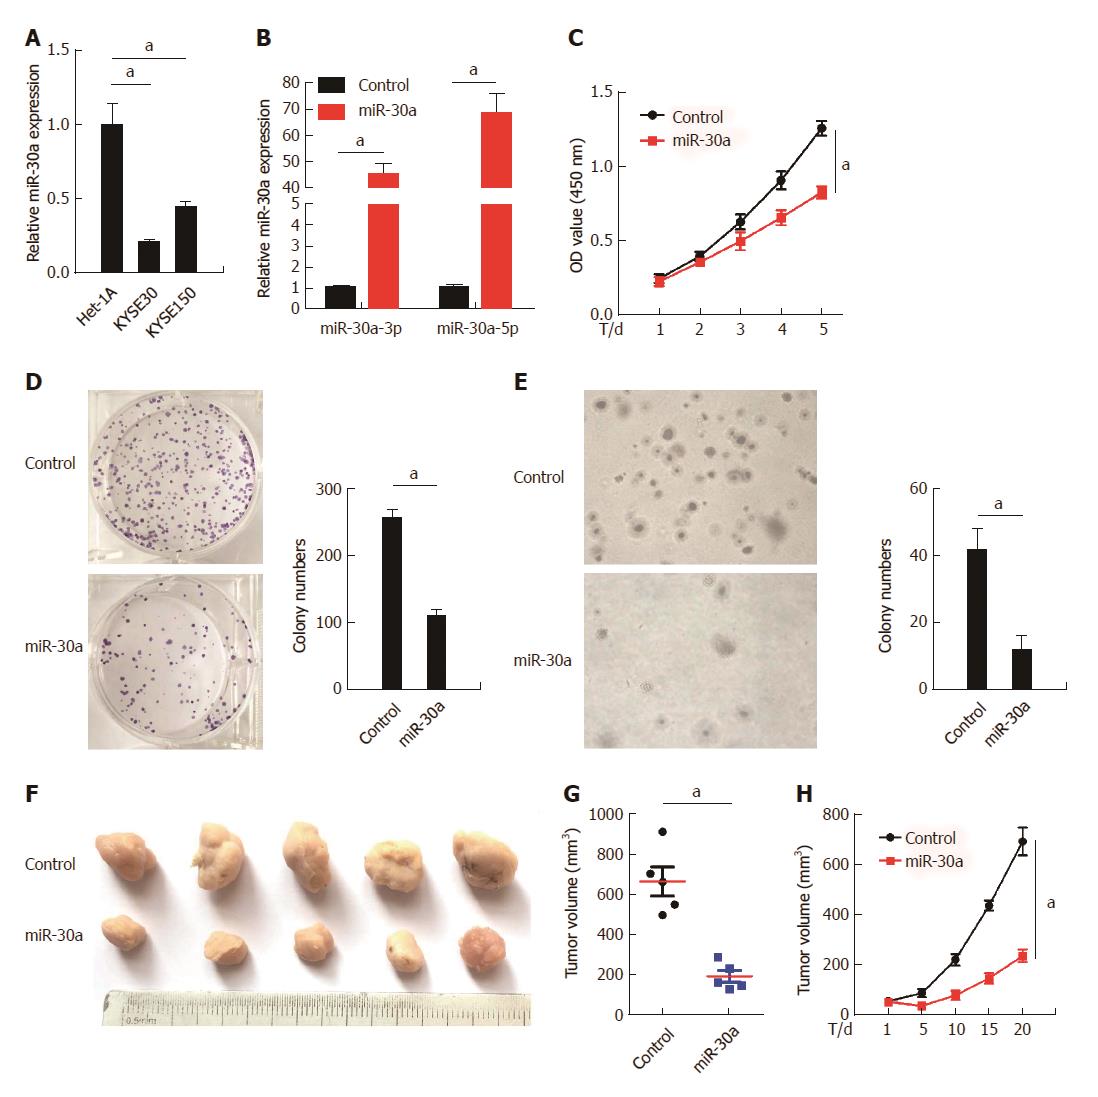
Figure 3 Over-expression of miR-30a-3p/5p represses esophageal squamous cell carcinoma cell proliferation.
A: miR-30a expression in human esophageal epithelial cell line Het-1A and ESCC cell lines KYSE30 and KYSE150; B: miR-30a-3p (left) and miR-30a-5p (right) were, respectively, over-expressed in KYSE30 cells; C: Over-expression of miR-30a suppressed KYSE30 cells proliferation, as indicated by the MTT assay; D: Over-expression of miR-30a suppressed KYSE30 cell proliferation, as indicated by the colony formation assay. Colonies containing more than 50 cells were counted. E: Over-expression of miR-30a suppressed anchorage-independent growth ability of KYSE30 cells, as indicated by the soft-agar assay. Colonies containing more than 50 cells were counted. F: Subcutaneous tumorigenesis assay performed in nude mice (n = 6/group) indicated that over-expression of miR-30a inhibited ESCC growth in vivo. Tumor volumes were measured on the 1st, 5th, 10th, 15th, and 20th d; G and H: Statistical analyses of tumor volumes in the negative control and miR-30a over-expression groups. Error bars represent the mean ± SD of three independent experiments; aP < 0.05.
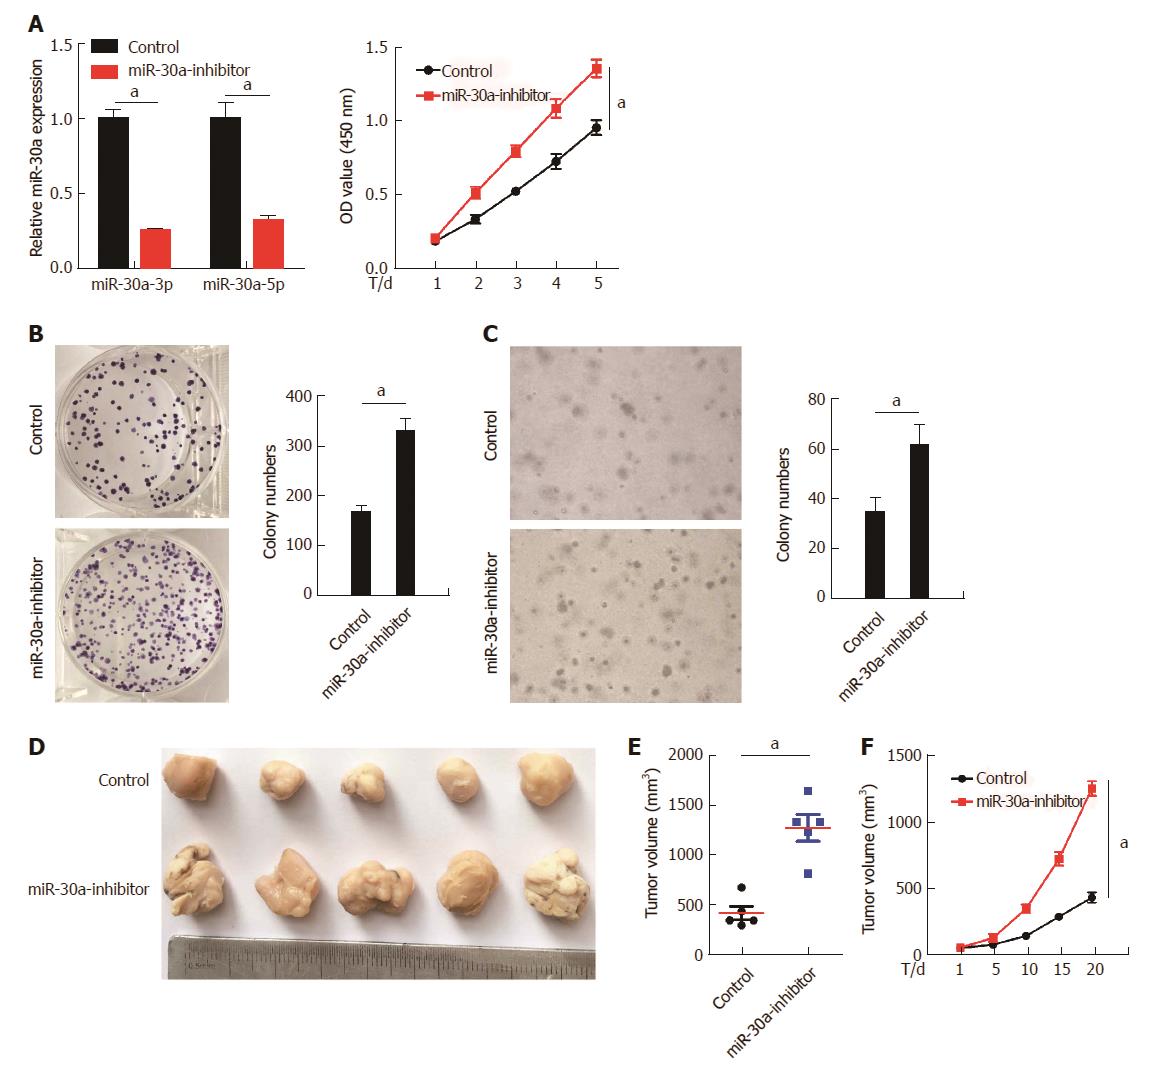
Figure 4 Inhibition of miR-30a-3p/5p expression promotes esophageal squamous cell carcinoma cell proliferation.
A: miR-30a-3p and miR-30a-5p were knocked down using miR-30a inhibitor in KYSE150 cells (top), and inhibition of miR-30a expression promoted KYSE150 cell proliferation, as indicated by the MTT assay (bottom); B: Inhibition of miR-30a expression promoted KYSE150 cells proliferation, as indicated by the colony formation assay. Colonies containing more than 50 cells were counted; C: Inhibition of miR-30a expression promoted anchorage-independent growth ability of KYSE150 cells, as indicated by the soft-agar assay. Colonies containing more than 50 cells were counted; D: Subcutaneous tumorigenesis assay performed in nude mice (n = 6/group) indicated that inhibition of miR-30a expression promoted ESCC growth in vivo. Tumor volumes were measured on the 1st, 5th, 10th, 15th, and 20th d; E and F: Statistical analyses of tumor volumes in the negative control and miR-30a over-expression groups. Error bars represent the mean ± SD of three independent experiments; aP < 0.05.
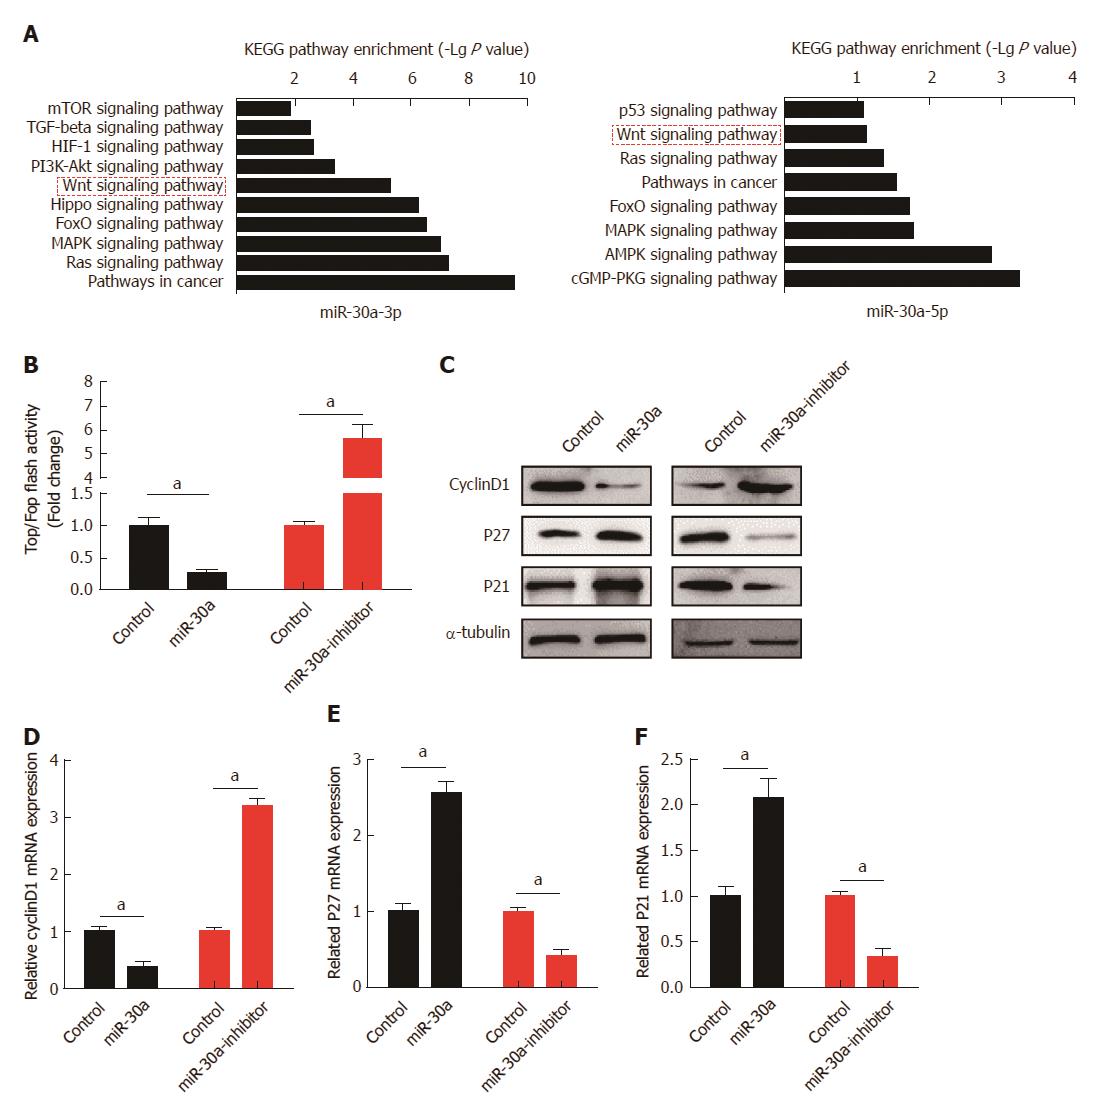
Figure 5 Down-regulation of miR-30a-3p/5p expression enhances the activity of Wnt signaling pathway.
A: Respective KEGG pathway enrichment analyses of miR-30a-3p (top) and miR-30a-5p (bottom) target genes; B: Luciferase reporter assay suggested that down-regulation of miR-30a expression enhanced the activity of Wnt signaling pathway, while over-expression of miR-30a attenuated it; C: Western blot assay indicated that miR-30a negatively regulated the protein expression of downstream genes of the Wnt signaling pathway, including Cyclin D1, p27, and p21. α-tubulin was used as a loading control; D, E and F: qPCR assay revealed that miR-30a negatively regulated the mRNA expression of Cyclin D1, p27, and p21. Error bars represent the mean ± SD of three independent experiments; aP < 0.05.
Figure 6 miR-30a-3p/5p directly target the 3'-UTRs of Wnt2 and Fzd2, respectively.
A: Target gene screening of miR-30a-3p (left) and miR-30a-5p (right) by qPCR suggested that miR-30a-3p targeted Wnt2 and miR-30a-5p targeted Fzd2 in the Wnt signaling pathway; B: Predicted target sequences of miR-30a-3p (top) and miR-30a-5p (bottom) in the 3’-UTRs of WNT2 and FZD2, respectively; C: qPCR (top) and Western blot (bottom), respectively, confirmed the inhibitory effects of miR-30a-3p and miR-30a-5p on Wnt2 and Fzd2 at both mRNA and protein levels. GAPDH and α-tubulin were, respectively, used as loading controls for qPCR and Western blot; D: Luciferase reporter assay indicated that miR-30-3p and miR-30a-5p directly targeted the wild-type 3’-UTRs of Wnt2 and Fzd2, respectively, but had no effect on the mutant ones. Two concentrations of miR-30a-3p- and miR-30a-5p-mimics (10 nmol/L and 20 nmol/L) plus wild-type or mutant 3’-UTRs of target genes were applied. Error bars represent the mean ± SD of three independent experiments; aP < 0.05.
- Citation: Qi B, Wang Y, Chen ZJ, Li XN, Qi Y, Yang Y, Cui GH, Guo HZ, Li WH, Zhao S. Down-regulation of miR-30a-3p/5p promotes esophageal squamous cell carcinoma cell proliferation by activating the Wnt signaling pathway. World J Gastroenterol 2017; 23(45): 7965-7977
- URL: https://www.wjgnet.com/1007-9327/full/v23/i45/7965.htm
- DOI: https://dx.doi.org/10.3748/wjg.v23.i45.7965


