Copyright
©The Author(s) 2017.
World J Gastroenterol. Nov 28, 2017; 23(44): 7917-7929
Published online Nov 28, 2017. doi: 10.3748/wjg.v23.i44.7917
Published online Nov 28, 2017. doi: 10.3748/wjg.v23.i44.7917
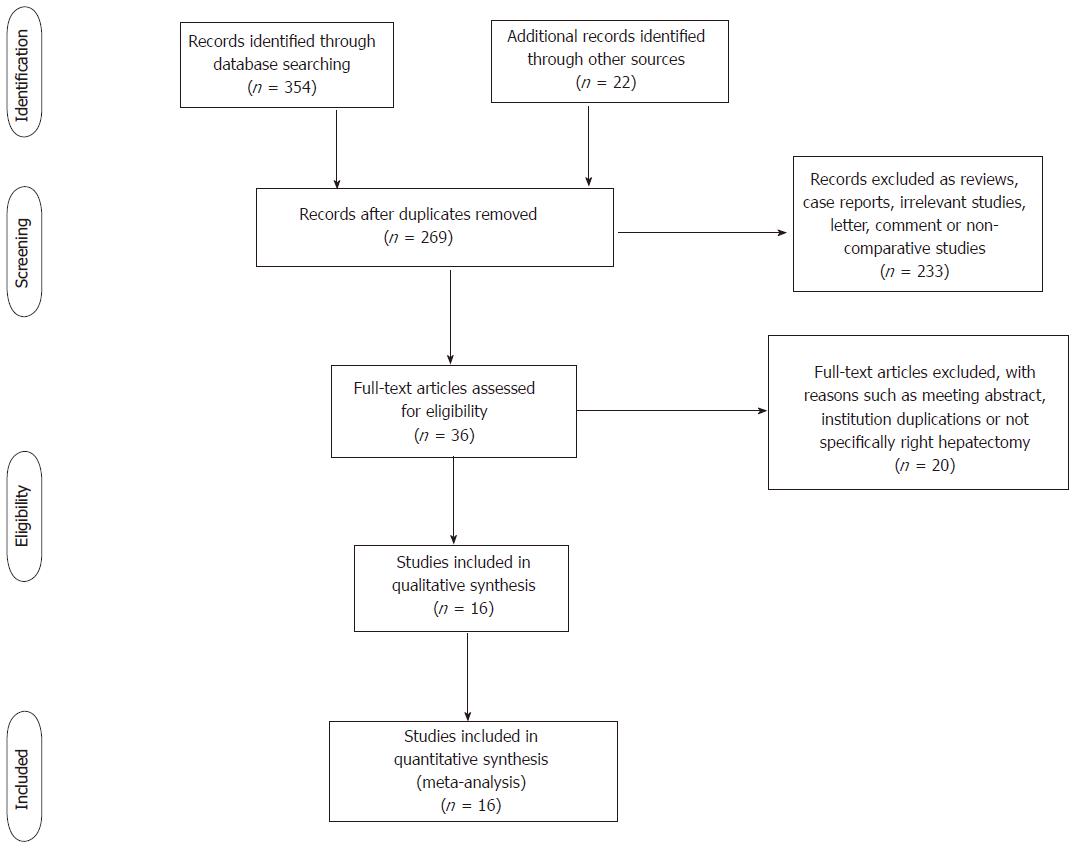
Figure 1 Flow diagram of study identification, inclusion, and exclusion.
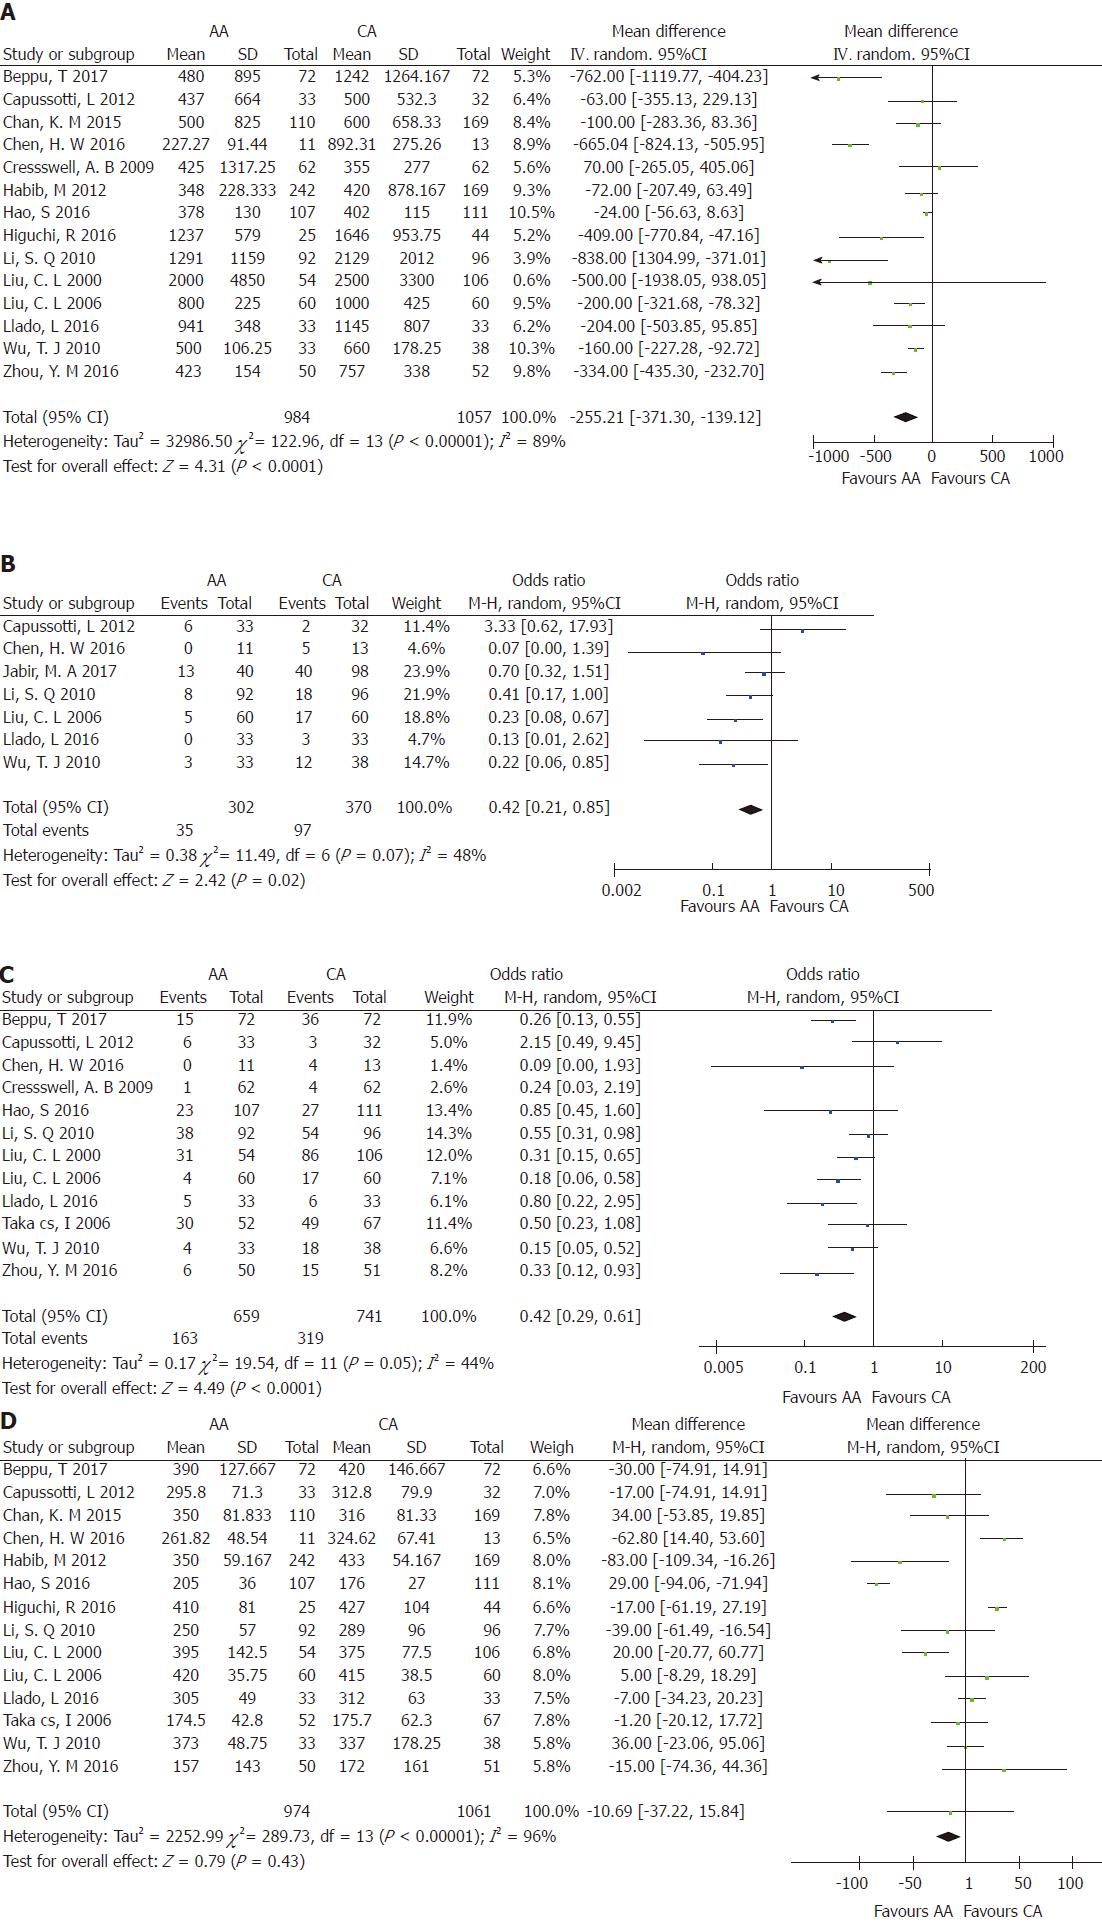
Figure 2 Forest plot and meta-analysis of clinical outcomes.
A: Forest plot and meta-analysis of intraoperative blood loss; B: Forest plot and meta-analysis of massive blood loss; C: Forest plot and meta-analysis of intraoperative blood transfusion; D: Forest plot and meta-analysis of operative time. AA: Anterior approach; CA: Conventional approach.
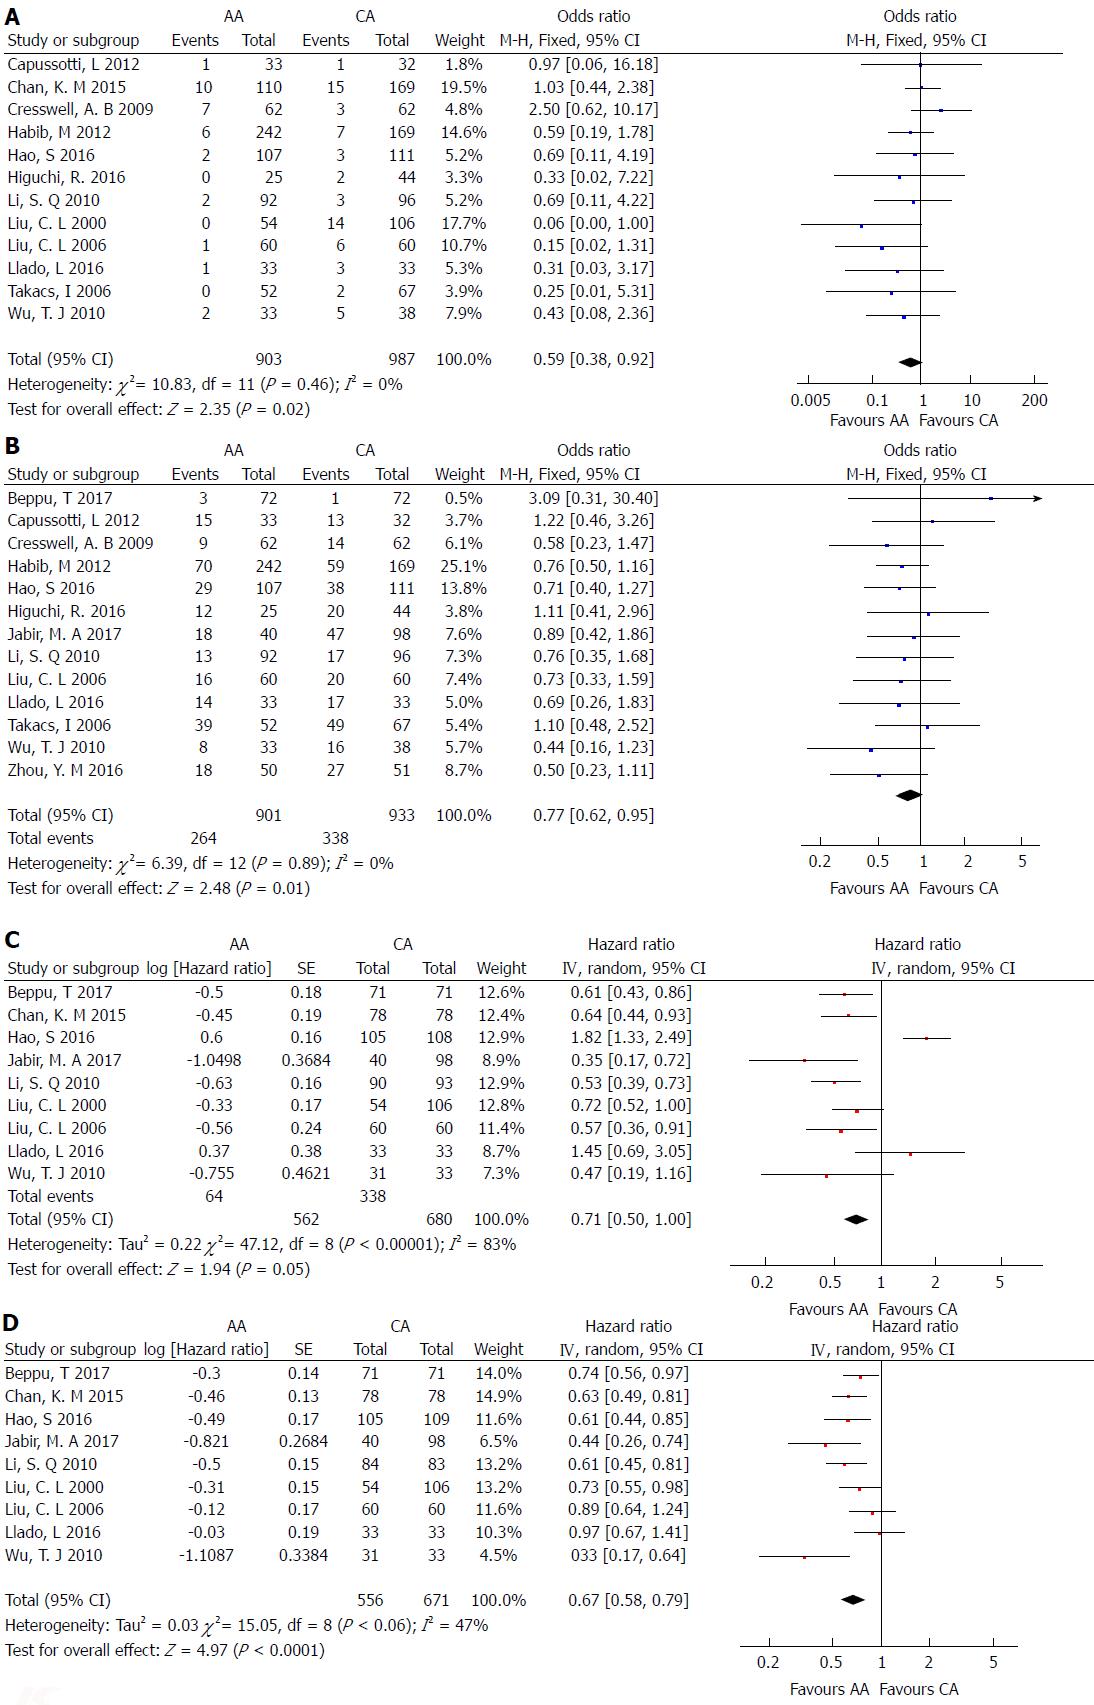
Figure 3 Forest plot and meta-analysis of postoperative outcomes.
A: Forest plot and meta-analysis of mortality; B: Forest plot and meta-analysis of morbidity; C: Forest plot and meta-analysis of overall survival; D: Forest plot and meta-analysis of disease-free survival. AA: Anterior approach; CA: Conventional approach.
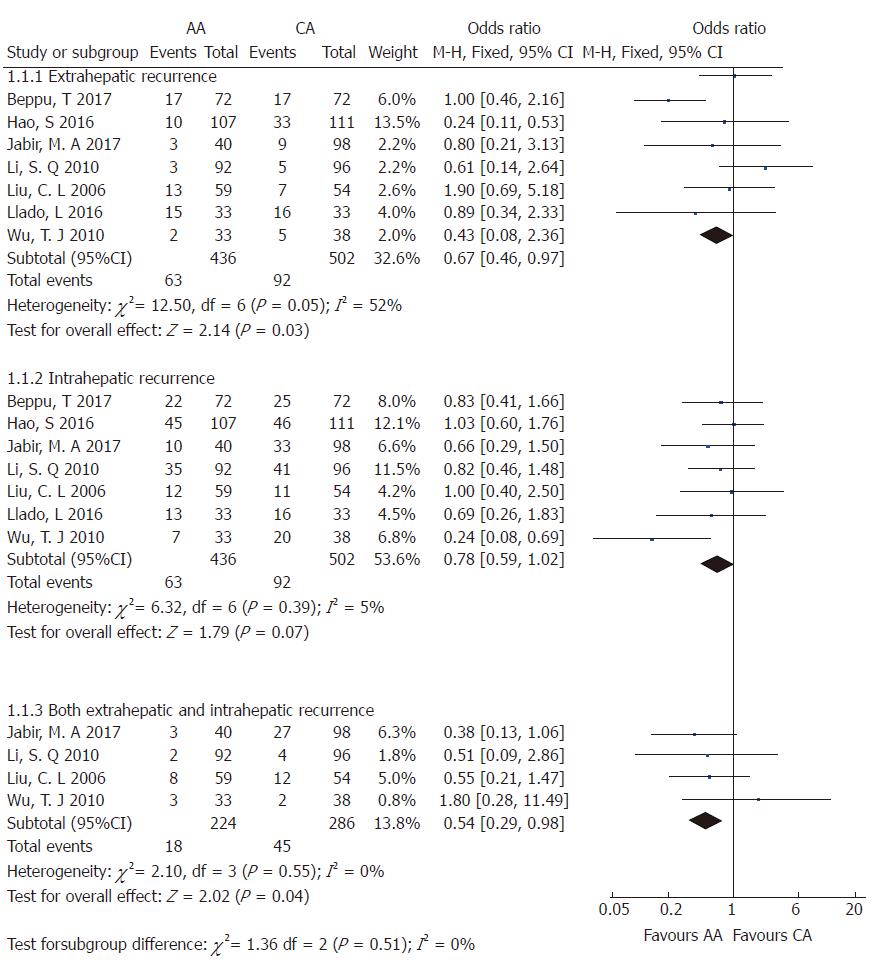
Figure 4 Forest plot and meta-analysis of tumor recurrence.
AA: Anterior approach; CA: Conventional approach.
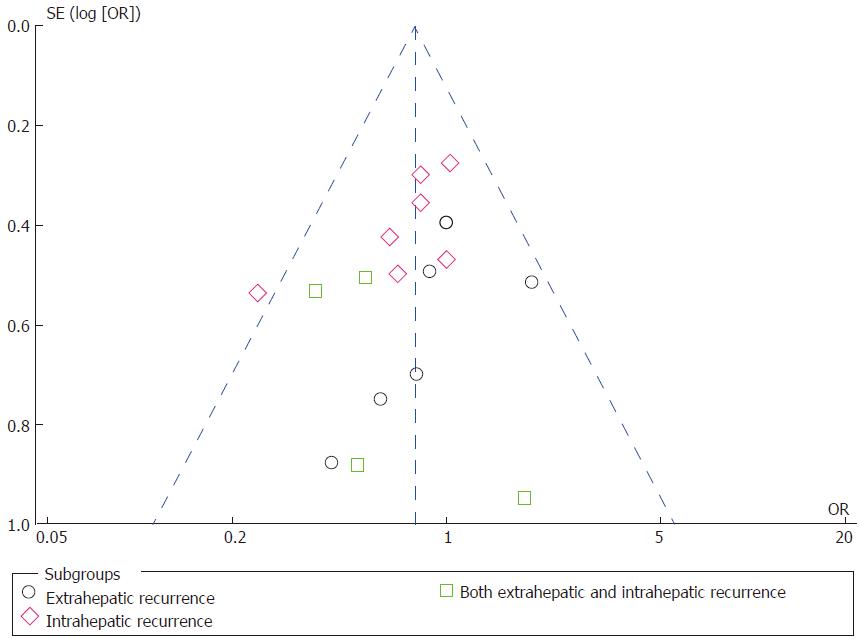
Figure 5 Funnel plots illustrating meta-analysis of tumor recurrence rates.
SE: Standard error; OR: Odds ratio.
- Citation: Tang JX, Li JJ, Weng RH, Liang ZM, Jiang N. Anterior vs conventional approach right hepatic resection for large hepatocellular carcinoma: A systematic review and meta-analysis. World J Gastroenterol 2017; 23(44): 7917-7929
- URL: https://www.wjgnet.com/1007-9327/full/v23/i44/7917.htm
- DOI: https://dx.doi.org/10.3748/wjg.v23.i44.7917


