Copyright
©The Author(s) 2017.
World J Gastroenterol. Nov 28, 2017; 23(44): 7818-7829
Published online Nov 28, 2017. doi: 10.3748/wjg.v23.i44.7818
Published online Nov 28, 2017. doi: 10.3748/wjg.v23.i44.7818
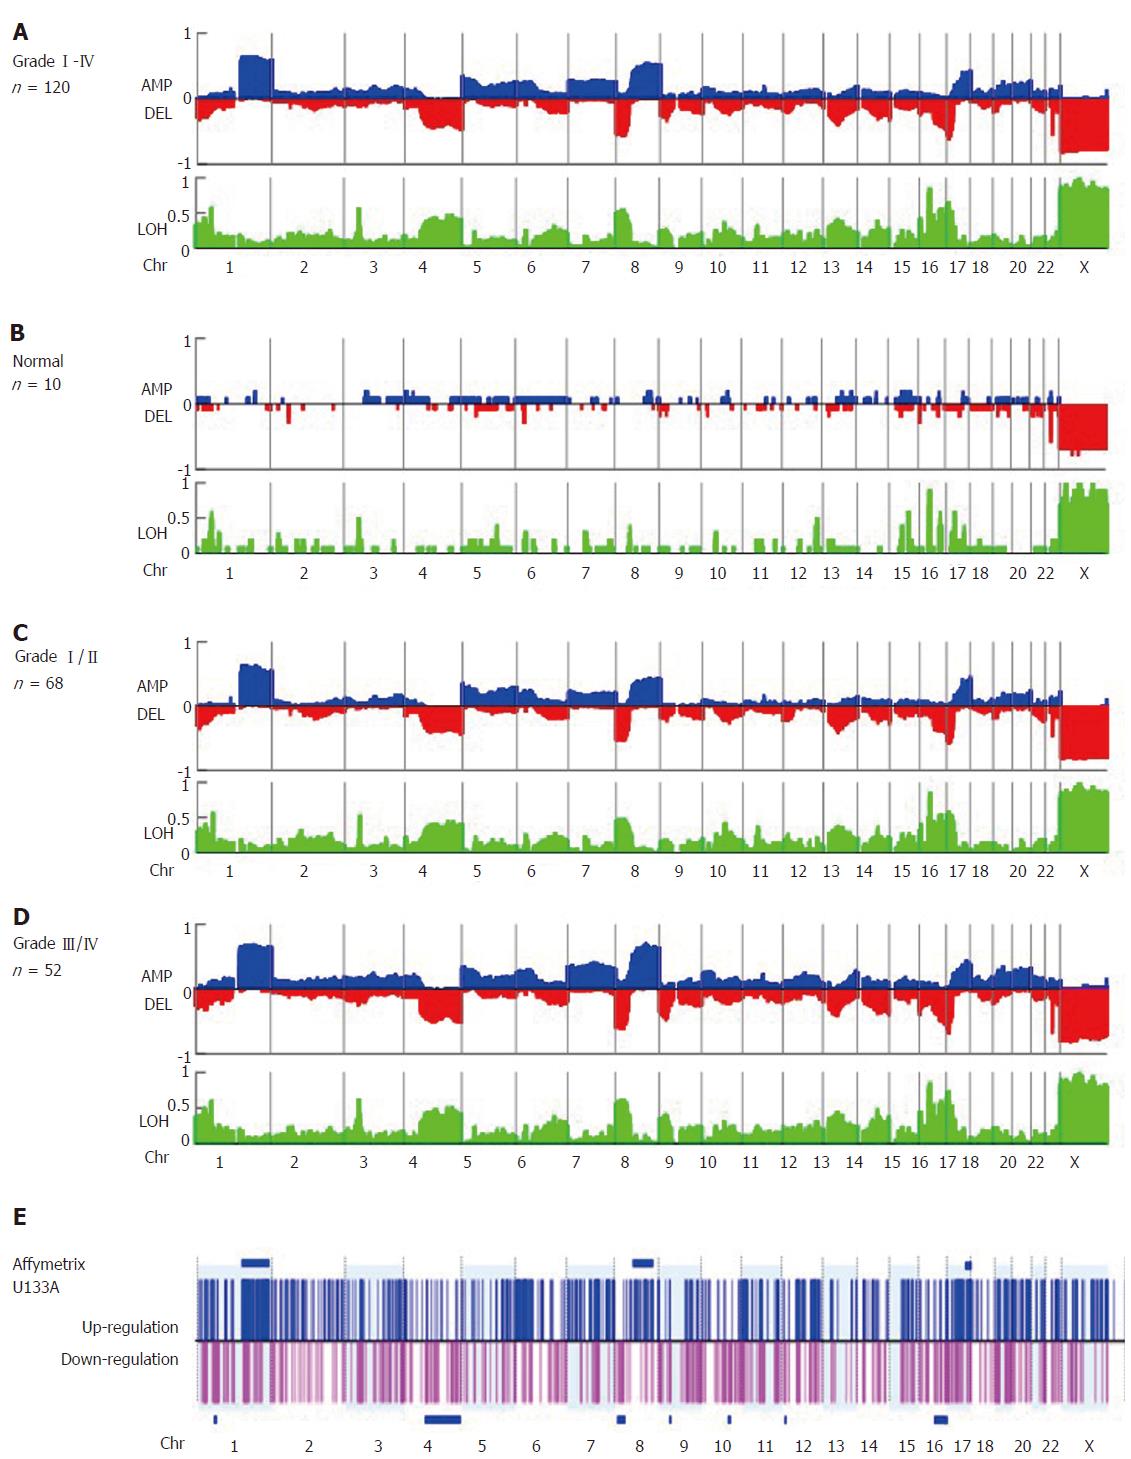
Figure 1 Virtual karyotyping analysis of amplification, deletion, and loss of heterozygosity in 120 formalin fixed, paraffin-embedded specimens of early-stage hepatocellular carcinoma.
The frequency of copy number amplification (AMP), deletion (DEL), and loss of heterozygosity (LOH) in (A) specimens from all 120 patients with hepatocellular carcinoma (HCC), (B) patients with benign liver lesions (n = 10), (C) Edmonson grade I/II HCC specimens (n = 68), and (D) Edmonson grade III/IV HCC specimens (n = 52) are shown on the Y-axis of each panel. Relative chromosomal position is shown on the X-axis. Blue and red plots represent the frequency of copy number amplification and deletion, respectively (upper panel), and LOH (shown in green, lower panel). Note that +1, 0, and -1 represent a frequency of 100% amplification, no alteration, and 100% deletion, respectively. (E) The gene expression profiles of another set of early-stage HCC tumors (n = 40). The log ratio of each probe set was normalized by the normal counterpart of each HCC tumor [log(T-N)] and fold changes > 2 or ≤ 2 were considered up- (shown in blue) or down-regulated (shown in pink), respectively. The P-value for differential gene expression in tumor versus normal tissue was calculated and considered significant with P < 0.05. Clustered chromosome regions associated with genome change are shown as horizontal blue bars (P < 0.05).
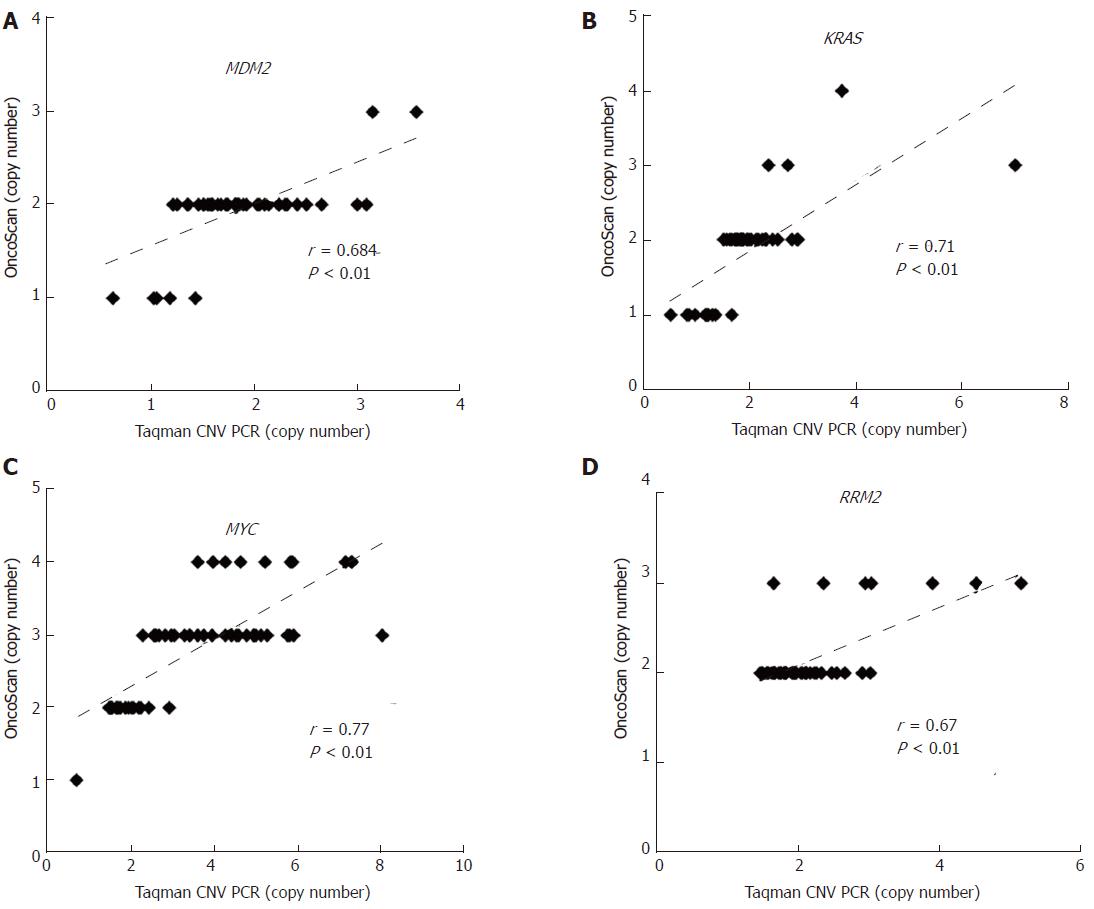
Figure 2 Validation of OncoScan copy number aberration data.
The CNAs of (A) MDM2, (B) KRAS, (C) MYC, and (D) RRM2 in early-stage HCC were validated by TaqMan copy number assay. Correlations between OncoScan CNAs and TaqMan PCR-determined CNAs were calculated via Pearson’s correlation r and P-value. The X-axis shows the CNA results from TaqMan PCR and the Y-axis shows that of the OncoScan data. CNA: Copy number aberration.
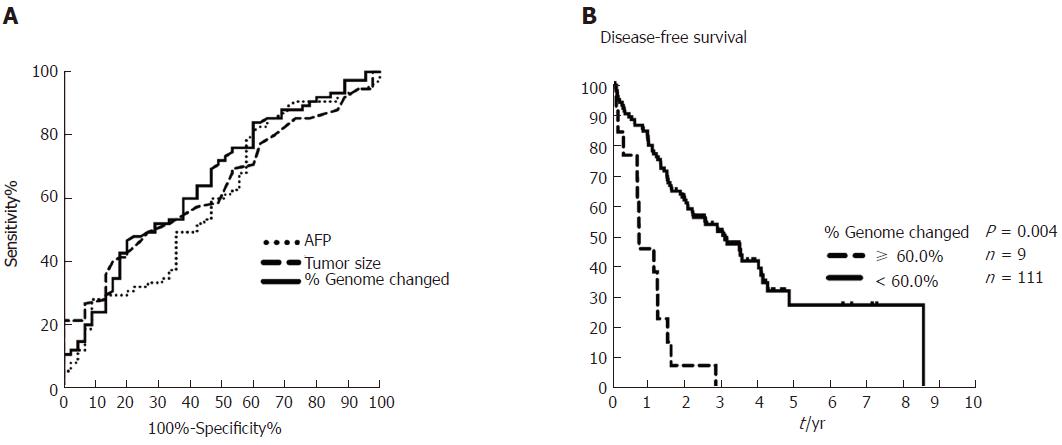
Figure 3 Comparisons of area under the receiver operating characteristic curve (AUROC) for percent genome change, α-fetoprotein, and tumor size in early-stage hepatocellular carcinoma, and Kaplan-Meier plot for 10-yr disease-free survival in patients with hepatocellular carcinoma with or without ≥ 60% genome change.
A: AUROC analysis of AFP (dotted line, 0.598), tumor size (dashed line, 0.633), and percent genome change (solid line, 0.657) shows predictive ability for early-stage HCC recurrence. Cutoffs for AFP, tumor size, and percent genome change are 5.2 ng/mL, 4.25 cm, and 30%, respectively (Supplementary Table 3). B: The Kaplan-Meier plot for 10-yr disease-free survival in patients with HCC with ≥ 60% (dashed line) or < 60% (solid line) genome change as determined from Affymetrix OncoScan CNA data. AFP: α-fetoprotein; HCC: Hepatocellular carcinoma.
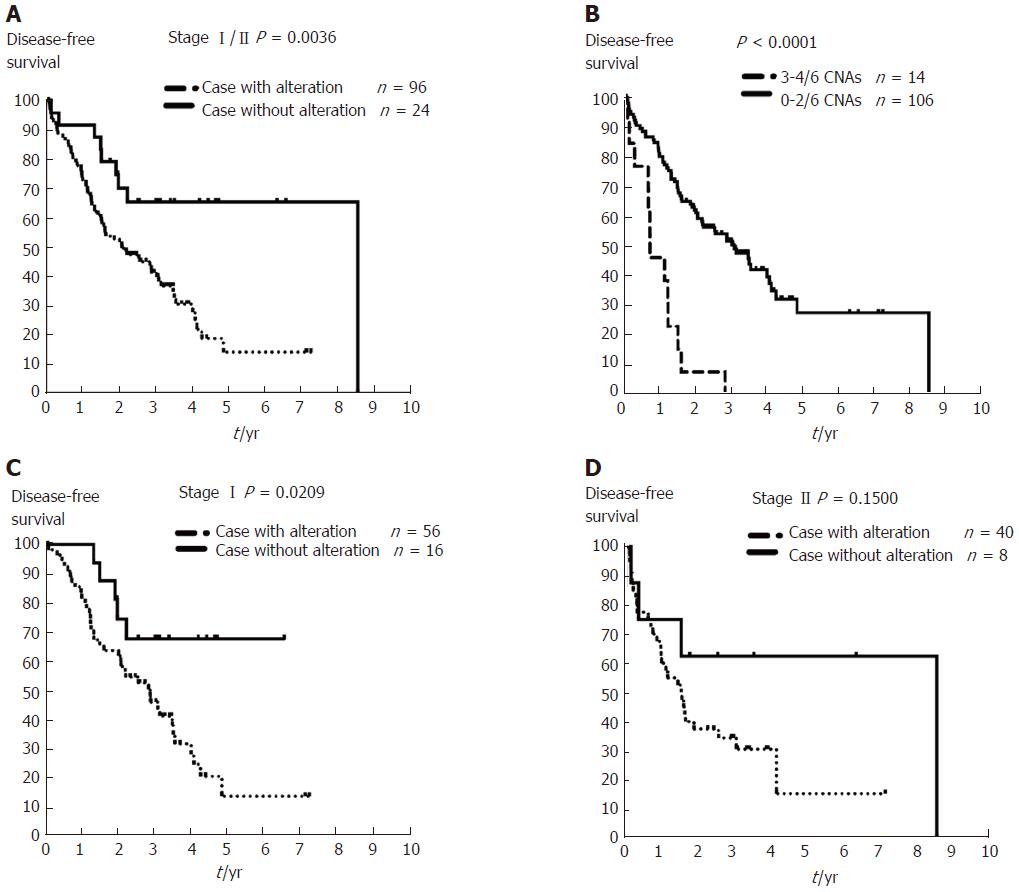
Figure 4 Disease-free survival analysis in patients with early-stage hepatocellular carcinoma with or without copy number aberrations involving six important genes identified using OncoScan data.
A: Patients with stage I/II hepatocellular carcinoma (HCC) (n = 120) and copy number aberrations (CNAs) involving critical genes (dashed line) exhibited worse outcome compared to those without the predictive gene-containing CNAs (solid line) (P = 0.0036). B: Patients with early-stage HCC with three or more CNAs affecting these six identified genes had worse outcome (≥ 3 CNAs affecting these genes, dashed line, n = 14 vs < 3 CNAs affecting these genes, solid line, n = 106; P < 0.0001). C: Patients with stage I HCC (n = 72) and CNAs affecting any of the six identified genes (MYC, WRN, ELAC2, GAK, SYK, or MECOM) were associated with worse outcome after resection (dashed line, P = 0.0209). D: Patients with stage II HCC (n = 48) with/without any of the CNAs affecting these six genes (MYC, WRN, ELAC2, GAK, SYK, or ) showed no difference in DFS (P = 0.15). DFS: Disease-free survival.
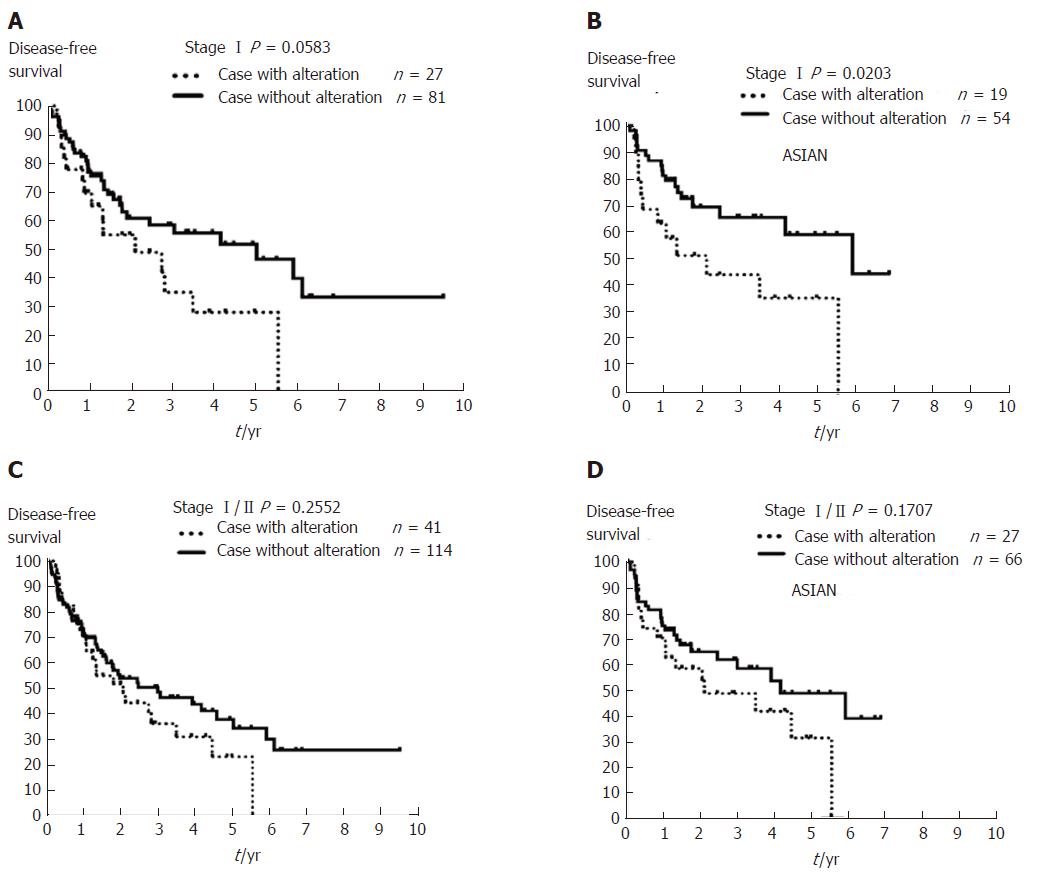
Figure 5 The Kaplan-Meier plot for 10-year disease-free survival in patients with stage I/II hepatocellular carcinoma with or without copy number aberrations involving MYC, WRN, ELAC2, GAK, SYK, or MECOM using The Cancer Genome Atlas Liver Hepatocellular Carcinoma data.
A: Patients with stage I hepatocellular carcinoma (HCC) (n = 108) with any copy number aberrations (CNAs) affecting one of the six genes identified in this study (MYC, WRN, ELAC2, GAK, SYK, or MECOM) had a trend for worse outcome after resection (dashed line, P = 0.0583). B: Asian patients with stage I HCC (n = 73) and CNAs affecting these six genes (dashed line) exhibited poorer outcome compared to those cases without such CNAs (solid line, P = 0.0203). C: Patients with stage I/IIHCC (n = 155), and D: Asian patients with stage I/II HCC (n = 93) with/without any of these CNAs affecting MYC, WRN, ELAC2, GAK, SYK, or MECOM showed no change in DFS (P = 0.2552 and P= 0.1707, respectively). DFS: Disease-free survival.
- Citation: Yu MC, Lee CW, Lee YS, Lian JH, Tsai CL, Liu YP, Wu CH, Tsai CN. Prediction of early-stage hepatocellular carcinoma using OncoScan chromosomal copy number aberration data. World J Gastroenterol 2017; 23(44): 7818-7829
- URL: https://www.wjgnet.com/1007-9327/full/v23/i44/7818.htm
- DOI: https://dx.doi.org/10.3748/wjg.v23.i44.7818


