Copyright
©The Author(s) 2017.
World J Gastroenterol. Nov 21, 2017; 23(43): 7666-7677
Published online Nov 21, 2017. doi: 10.3748/wjg.v23.i43.7666
Published online Nov 21, 2017. doi: 10.3748/wjg.v23.i43.7666
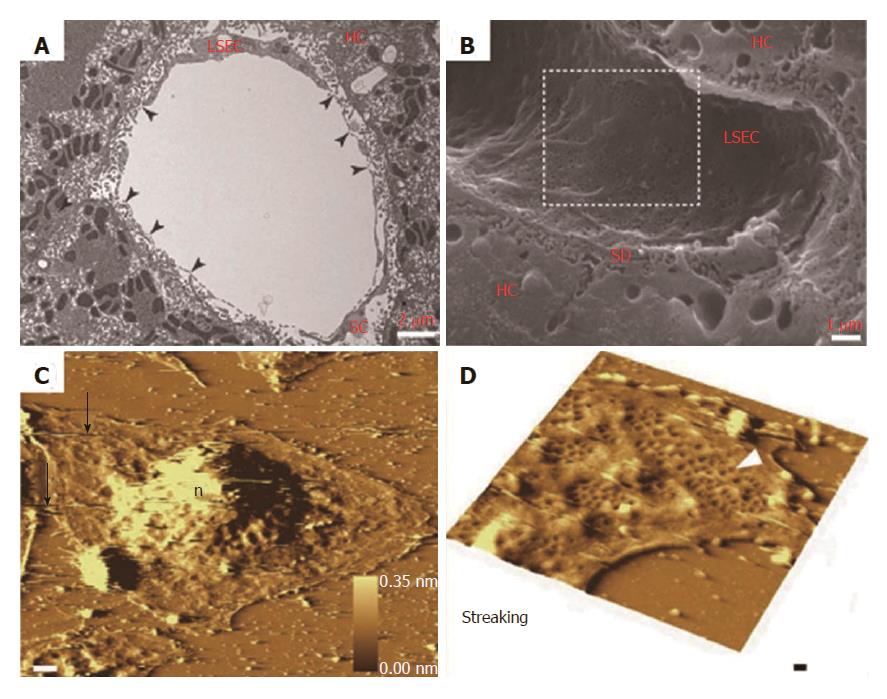
Figure 1 Morphological changes of liver sinusoidal endothelial cells.
A: TEM image of rat liver sinusoid after transversal cut; B: SEM image of rat liver sinusoid; C: AFM image of LSECs with a 10 nm gold layer; D: A high scan range of AFM image of LSECs. A-B: ref 21 Copyright @1985 by the American Association for the Study of Liver Diseases; C-D: ref 22 Copyright @ 2012 Elsevier Ltd. AFM: Atomic force microscopy; LSECs: Liver sinusoidal endothelial cells; SEM: Scanning electron microscopy; TEM: Transmission electron microscopy.
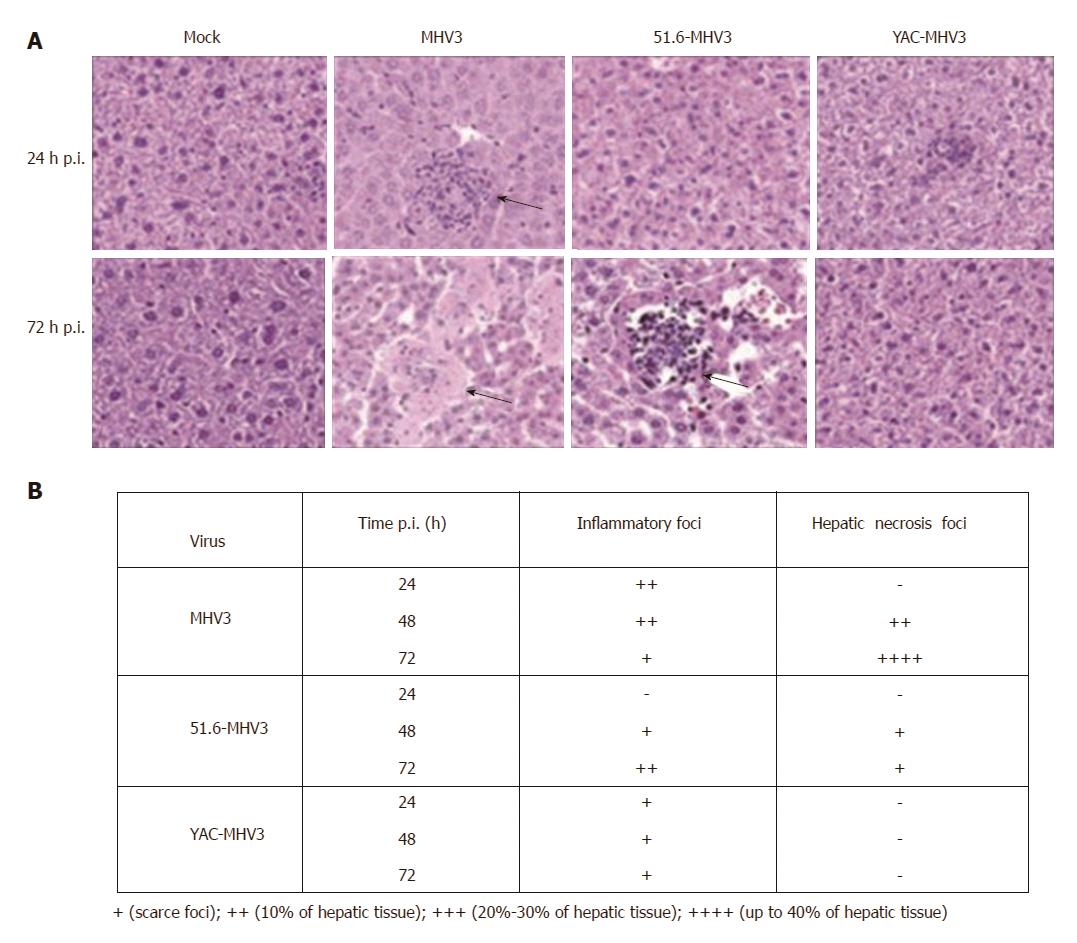
Figure 2 Pathological changes of hepatocytes after infection.
A: Histopathological analysis was conducted on livers from mock-infected and virus-infected mice from each group at 24 and 72 h after infection; B: Summary of occurrence of necrotic and virus-infected mice at 24, 48 and 72 h after infection. A-B: ref 41 Copyright @ 2016 American Society for Microbiology.
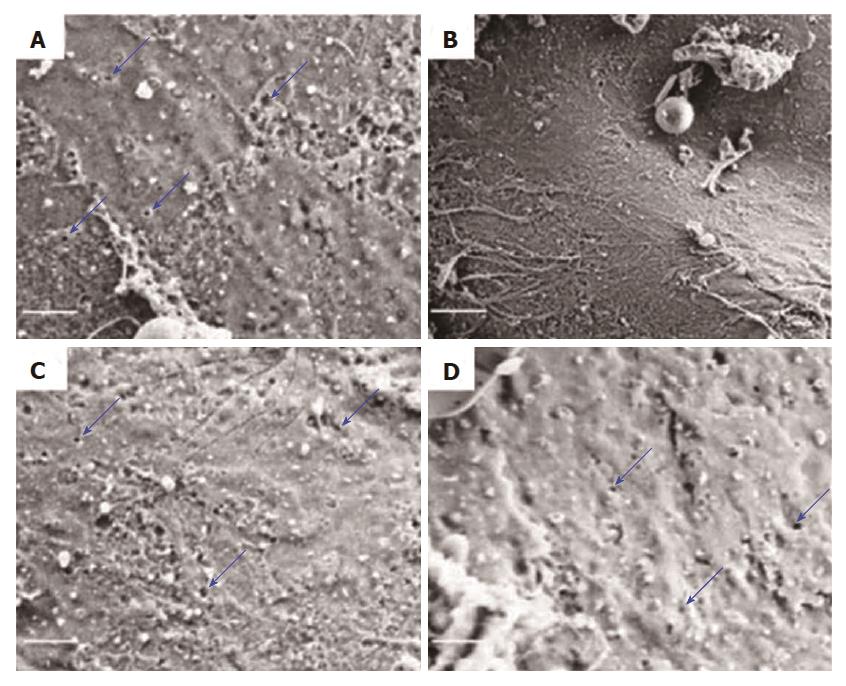
Figure 3 Scanning electron microscopy of liver sinusoidal endothelial cells sieve plates in CCl4-induced liver fibrosis.
A: Control group; B: CCl4 group; C: TMP- (100 mg/kg) and CCl4-treated group; D: Imatinib- (10 mg/kg) and CCl4-treated group. Scale bar = 1 μm. A-D: Ref 54 Copyright @ 2017 International Union of Biochemistry and Molecular Biology. CCl4: Carbon tetrachloride; TMP: Tetramethylpyrazine.
Figure 4 Relationship between liver sinusoidal endothelial cells and liver regeneration.
A: Strategy to test liver regeneration in mice lacking HDL-S1P; B: Ultrastructure of LSECs in control and test groups after PH (dashed line represents increased LSEC-hepatocyte distance; inset shows higher level of perivascular matrix protein, black arrows and red arrowheads indicate the borders of LSECs and hepatocytes). Scale bar = 5 μm. A-B: ref 60 Copyright @ 2016 American Society for Clinical Investigation. HDL: High-density lipoprotein; LSECs: Liver sinusoidal endothelial cells; PH: Partial hepatectomy.
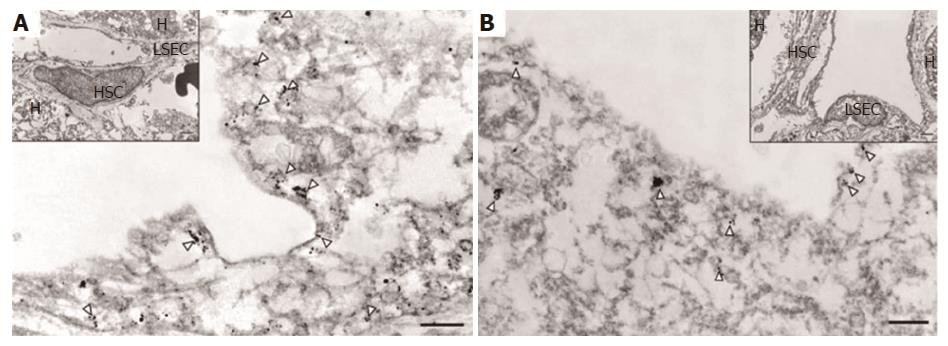
Figure 5 Ultrastructural localization of PTRF and SDPR in cirrhotic tissue.
A: Immunogold particles suggesting PTRF expression was observed on caveola-like structures in capillarized, longitudinally cut LSECs; B: Immunogold particles suggesting SDPR expression on caveola-like structures in longitudinally cut LSECs (inset shows lower magnification; white arrowheads indicate caveola-like structures). A-B: ref 66 Copyright @ 2015 Elsevier Ltd. LSECs: Liver sinusoidal endothelial cells; PTRF: Polymerase 1 and transcript release factor; SDPR: Serum deprivation protein response.
- Citation: Ni Y, Li JM, Liu MK, Zhang TT, Wang DP, Zhou WH, Hu LZ, Lv WL. Pathological process of liver sinusoidal endothelial cells in liver diseases. World J Gastroenterol 2017; 23(43): 7666-7677
- URL: https://www.wjgnet.com/1007-9327/full/v23/i43/7666.htm
- DOI: https://dx.doi.org/10.3748/wjg.v23.i43.7666


