Copyright
©The Author(s) 2017.
World J Gastroenterol. Nov 7, 2017; 23(41): 7397-7406
Published online Nov 7, 2017. doi: 10.3748/wjg.v23.i41.7397
Published online Nov 7, 2017. doi: 10.3748/wjg.v23.i41.7397
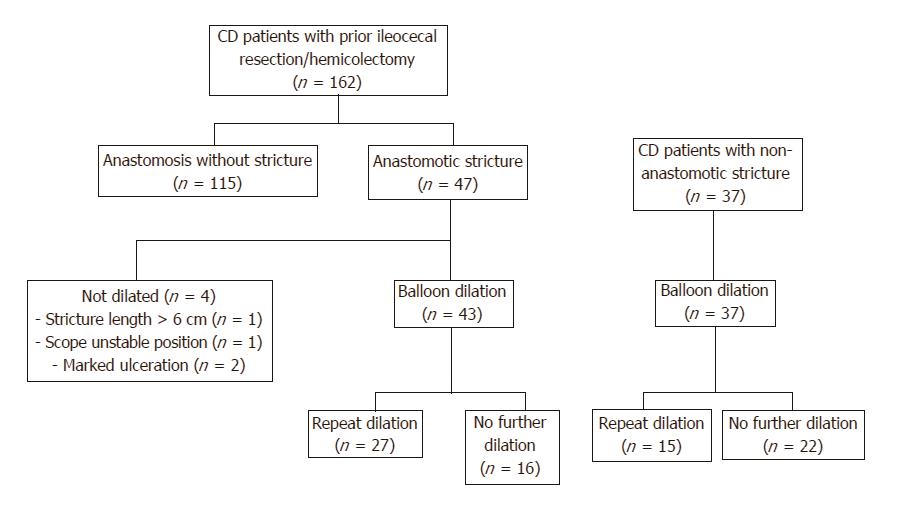
Figure 1 Flowchart with study design.
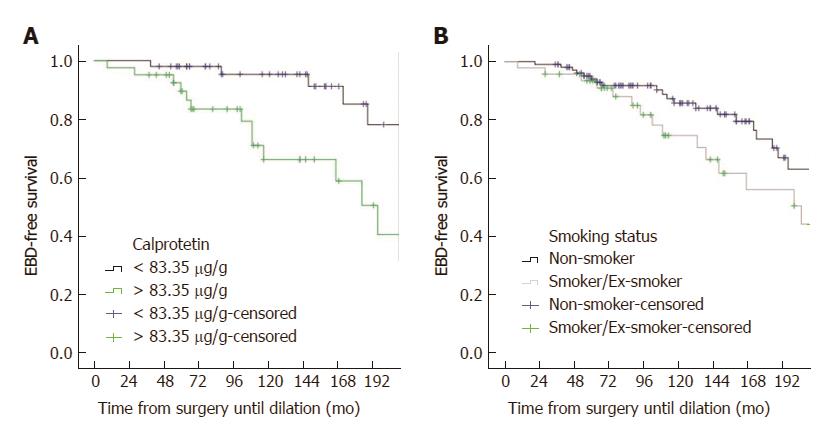
Figure 2 Kaplan-Meier curves showing time from surgery to dilation (in mo) considering calprotectin levels (A) and smoking status (B).
- Citation: Lopes S, Rodrigues-Pinto E, Andrade P, Afonso J, Baron TH, Magro F, Macedo G. Endoscopic balloon dilation of Crohn’s disease strictures-safety, efficacy and clinical impact. World J Gastroenterol 2017; 23(41): 7397-7406
- URL: https://www.wjgnet.com/1007-9327/full/v23/i41/7397.htm
- DOI: https://dx.doi.org/10.3748/wjg.v23.i41.7397


