Copyright
©The Author(s) 2017.
World J Gastroenterol. Nov 7, 2017; 23(41): 7369-7386
Published online Nov 7, 2017. doi: 10.3748/wjg.v23.i41.7369
Published online Nov 7, 2017. doi: 10.3748/wjg.v23.i41.7369
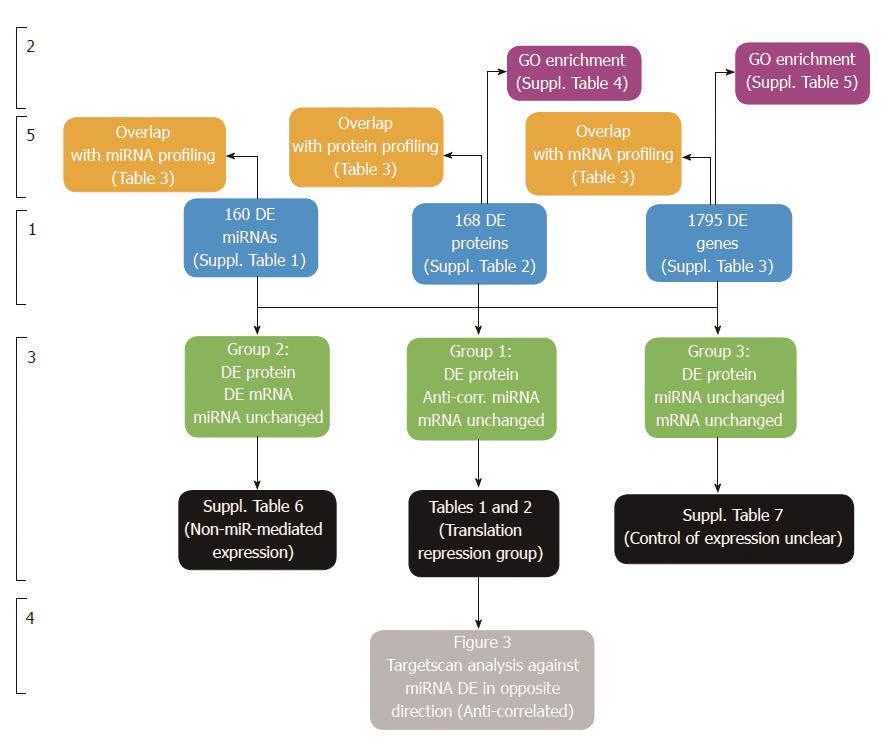
Figure 1 Overview of Tri-Omics data analysis approach.
Stage 1: Differential expression analysis of “Tri-Omics” data (miRNA, protein, mRNA) between HT-29 and Caco-2 cell lines (for a full list of results, including fold-changes and associated P value statistics, see Supplementary Tables 1-3). Stage 2: Enrichment analysis using Pathway Studio to determine overrepresented GO biological processes in the DE miRNA, protein and mRNA lists (see Supplementary Tables 4-6). Stage 3: Integration of three parallel datasets to generate 3 groups of interesting candidates; (1) Potential targets of miRNA translational repression (protein DE without mRNA change and targeted by anti-correlated miRNA): see Table 1 (Downregulated Proteins targeted by Upregulated miRNAs) and Table 2 (Upregulated Proteins targeted by Downregulated miRNAs); (2) Non- microRNA-mediated gene-protein expression (matching mRNA transcripts and proteins were DE, no corresponding anti-correlated microRNA data or results were below detection level): see Supplementary Table 7 and (3) Targets where control of differential protein expression was unclear (protein DE without mRNA or corresponding targeting microRNA change). Stage 4: TargetScan analysis of both groups against miRNAs DE in the opposite direction. Stage 5: Overlap analysis of Supplementary Tables 1-3 with published profiling studies on same cell lines: see Table 3.
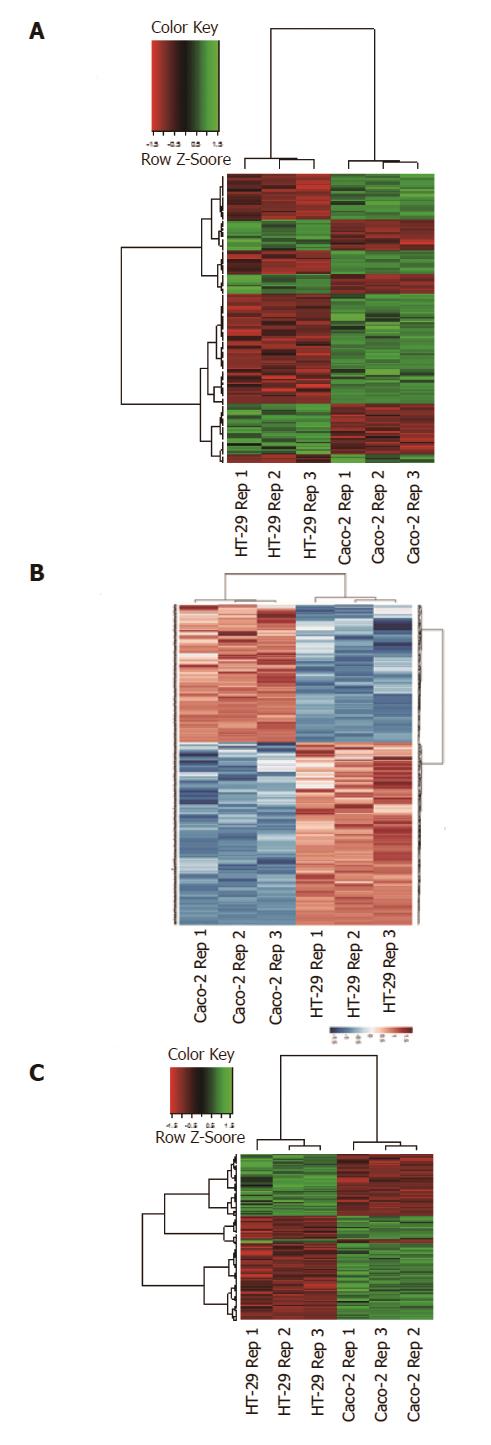
Figure 2 Bioinformatics QC analysis of HT-29 and Caco-2 replicates.
2-way hierarchical HCA clustering analysis on the HT-29 and Caco-2 cell line replicates using (A) DE miRNA probeset list (160 probesets) (B) DE proteomics list (168 proteins) and (C) DE mRNA probeset list (1795 probesets) confirms that the DE candidates separate the samples into their respective cell line replicate groups. For (A) and (C), red indicates diminished expression and green indicates increased expression for all three replicate groups; for (B) blue indicates diminished expression and red indicates increased expression for all three replicate groups.
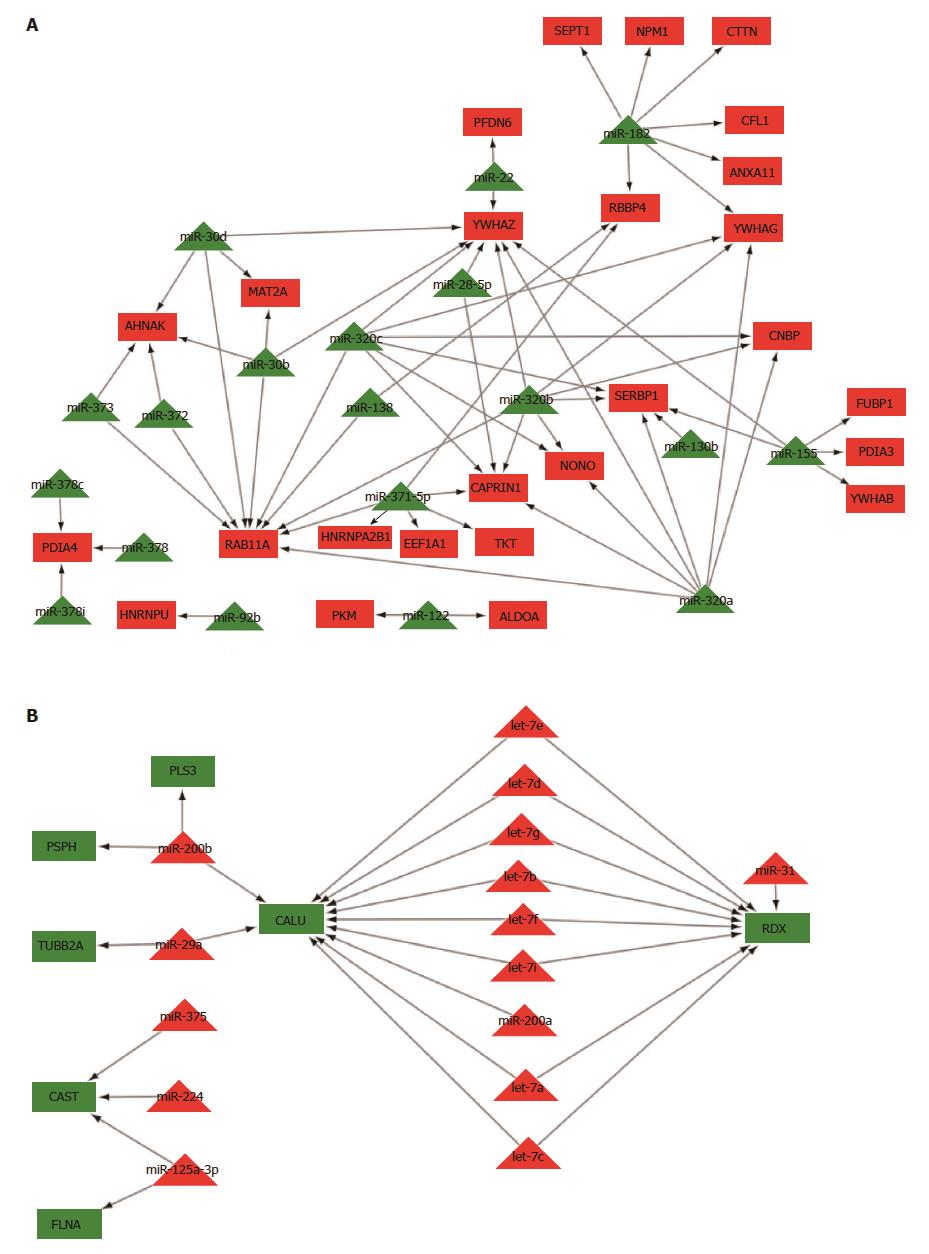
Figure 3 Summary of TargetScan predicted miRNA targets.
A: TargetScan prediction analysis for post-transcriptionally downregulated (green) proteins and anti-correlated/upregulated (red) miRNAs; B: TargetScan prediction analysis for post-transcriptionally upregulated (red) proteins and anti-correlated/downregulated (green) miRNAs. The prioritisation of these targets was possible only through integration of the miRNA, protein and mRNA datasets.
- Citation: O’Sullivan F, Keenan J, Aherne S, O’Neill F, Clarke C, Henry M, Meleady P, Breen L, Barron N, Clynes M, Horgan K, Doolan P, Murphy R. Parallel mRNA, proteomics and miRNA expression analysis in cell line models of the intestine. World J Gastroenterol 2017; 23(41): 7369-7386
- URL: https://www.wjgnet.com/1007-9327/full/v23/i41/7369.htm
- DOI: https://dx.doi.org/10.3748/wjg.v23.i41.7369


