Copyright
©The Author(s) 2017.
World J Gastroenterol. Nov 7, 2017; 23(41): 7359-7368
Published online Nov 7, 2017. doi: 10.3748/wjg.v23.i41.7359
Published online Nov 7, 2017. doi: 10.3748/wjg.v23.i41.7359
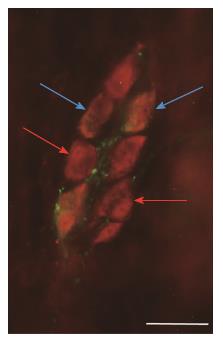
Figure 1 Representative fluorescent micrograph of a whole-mount preparation of submucous ganglia from the colon of a diabetic rat after nNOS-HuC/D double-labelling immunohistochemistry.
Red arrows indicate neurons labelled for HuC/D only, blue arrows show neurons double-labelled for both nNOS and HuC/D; Scale bar: 50 μm.
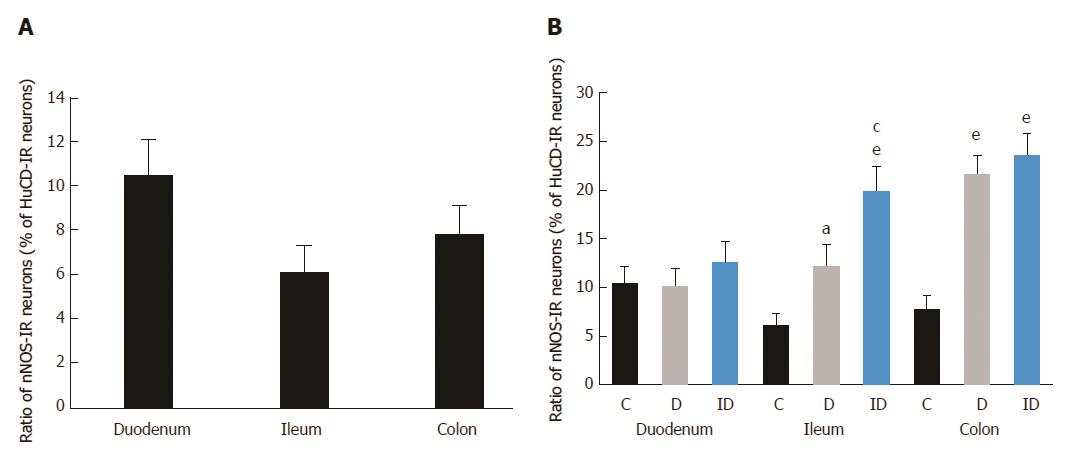
Figure 2 Proportion of nitric oxide synthase-immunoreactive neurons related to the total number of submucous neurons in the duodenum, ileum and colon.
A: Only in controls; B: in control, diabetic and insulin-treated diabetic rats. Data are expressed as mean ± SE; aP < 0.05 and eP < 0.0001 vs controls, cP < 0.05 vs diabetics. IR: Immunoreactive; C: Controls; D: Diabetics; ID: Insulin-treated diabetics.
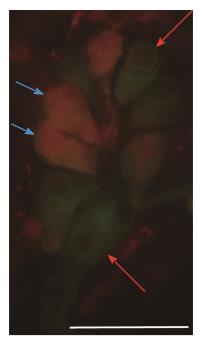
Figure 3 Representative fluorescent micrograph of a whole-mount preparation of submucous ganglia from the colon of a control rat after HO1-peripherin double-labelling immunohistochemistry.
Red arrows indicate neurons labelled for peripherin only, blue arrows show neurons double-labelled for both HO1 and peripherin; Scale bar: 50 μm.
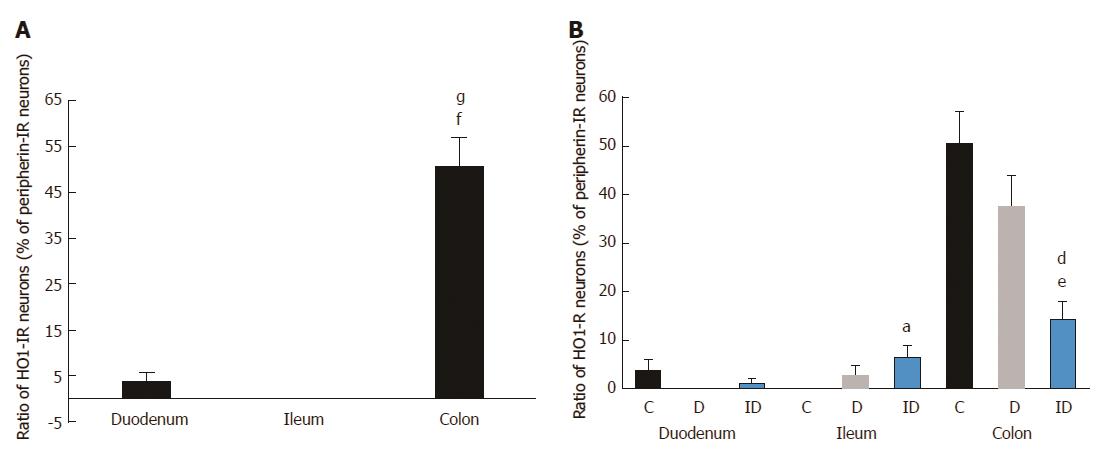
Figure 4 Proportion of HO1-immunoreactive neurons related to the total number of submucous neurons in the duodenum, ileum and colon.
A: Only in controls; B: In control, diabetic and insulin-treated diabetic rats. Data are expressed as mean ± SE; fP < 0.0001 vs control duodenum; gP < 0.0001 vs control ileum, aP < 0.05 and eP < 0.0001 vs controls, and dP < 0.01 vs diabetics. IR: Immunoreactive; C: Controls; D: Diabetics; ID: Insulin-treated diabetics.
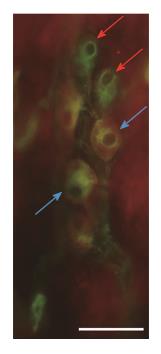
Figure 5 Representative fluorescent micrograph of a whole-mount preparation of submucous ganglia from the colon of a control rat after HO2-peripherin double-labelling immunohistochemistry.
Red arrows indicate neurons labelled for peripherin only, blue arrows show neurons double-labelled for both HO2 and peripherin; Scale bar: 50 μm.
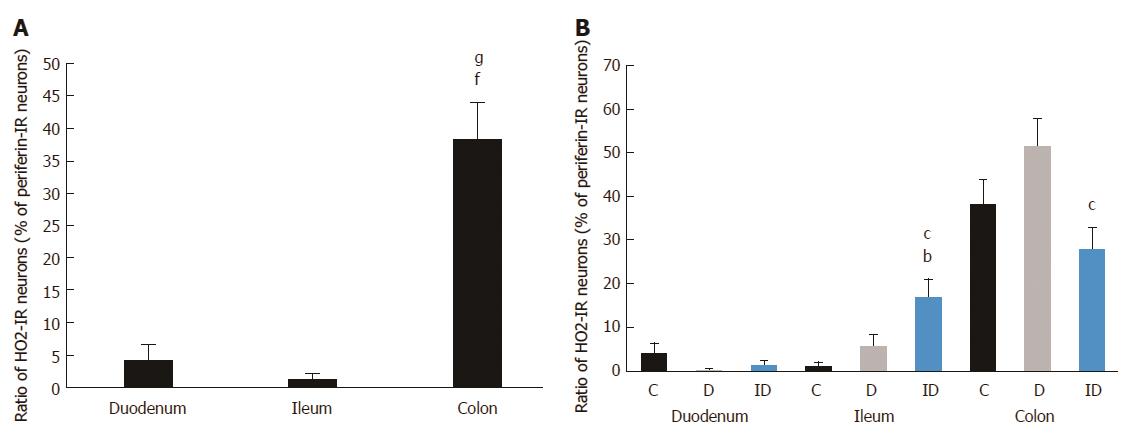
Figure 6 Proportion of HO2-immunoreactive neurons related to the total number of submucous neurons in the duodenum, ileum and colon.
A: Only in controls; B: In control, diabetic and insulin-treated diabetic rats. Data are expressed as mean ± SE; fP < 0.0001 vs control duodenum, gP < 0.0001 vs control ileum, bP < 0.001 vs controls, and cP < 0.05 vs diabetics; C: Controls; D: Diabetics. IR: Immunoreactive; ID: Insulin-treated diabetics.
- Citation: Bódi N, Szalai Z, Chandrakumar L, Bagyánszki M. Region-dependent effects of diabetes and insulin-replacement on neuronal nitric oxide synthase- and heme oxygenase-immunoreactive submucous neurons. World J Gastroenterol 2017; 23(41): 7359-7368
- URL: https://www.wjgnet.com/1007-9327/full/v23/i41/7359.htm
- DOI: https://dx.doi.org/10.3748/wjg.v23.i41.7359


