Copyright
©The Author(s) 2017.
World J Gastroenterol. Nov 7, 2017; 23(41): 7347-7358
Published online Nov 7, 2017. doi: 10.3748/wjg.v23.i41.7347
Published online Nov 7, 2017. doi: 10.3748/wjg.v23.i41.7347
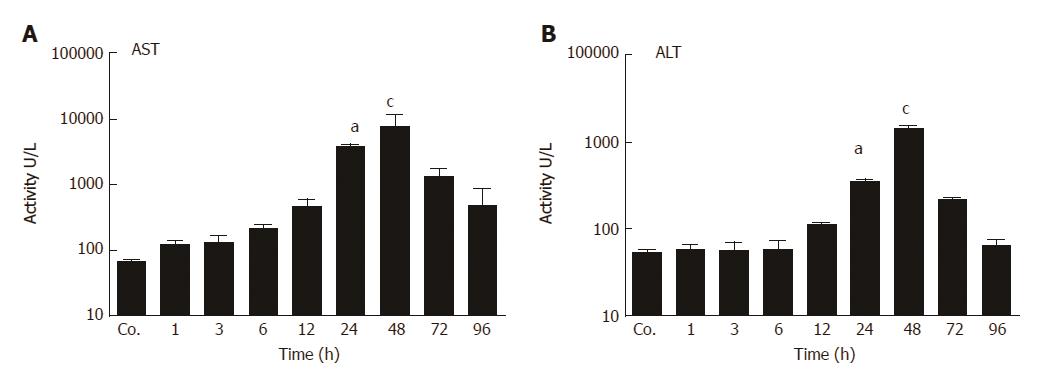
Figure 1 Serum enzyme levels in control and thioacetamide-injected rats.
Serum aspartate aminotransferase (AST) (A) and alanine aminotransferase (ALT) (B) levels showed a statically significant (aP ≤ 0.05; cP ≤ 0.001) increase at 24 and 48 h followed by a decrease thereafter. Results represent mean values ± SEM, measured in duplicate in four animals for each time point, compared to controls (Co.).
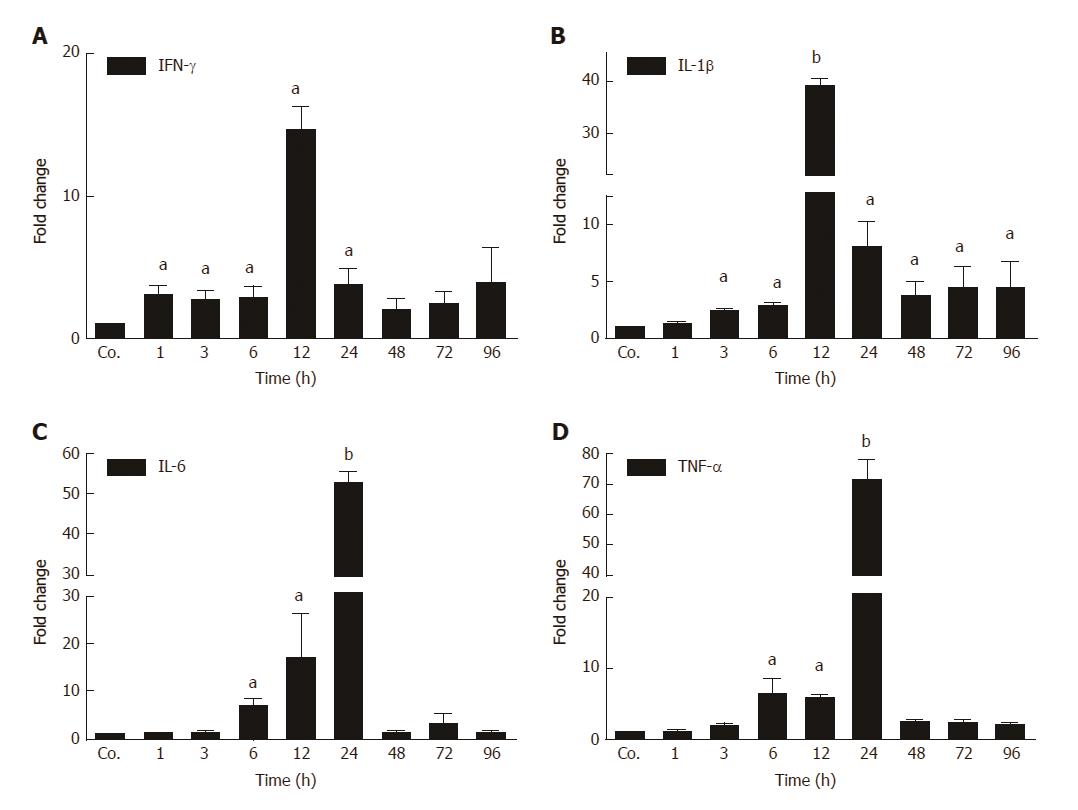
Figure 2 Early up-regulation of the expression of several acute-phase cytokines was observed.
A-D: Significant increase of mRNA expression of acute-phase cytokines (IFN-γ, IL-1β, IL-6, TNF-α) in liver of thioacetamide -injected rats after various time points (aP ≤ 0.05; bP ≤ 0.01). Real-time PCR was normalized to GAPDH. Results represent mean values ± SEM, measured in duplicate in four animals for each time point, compared to controls (Co.).
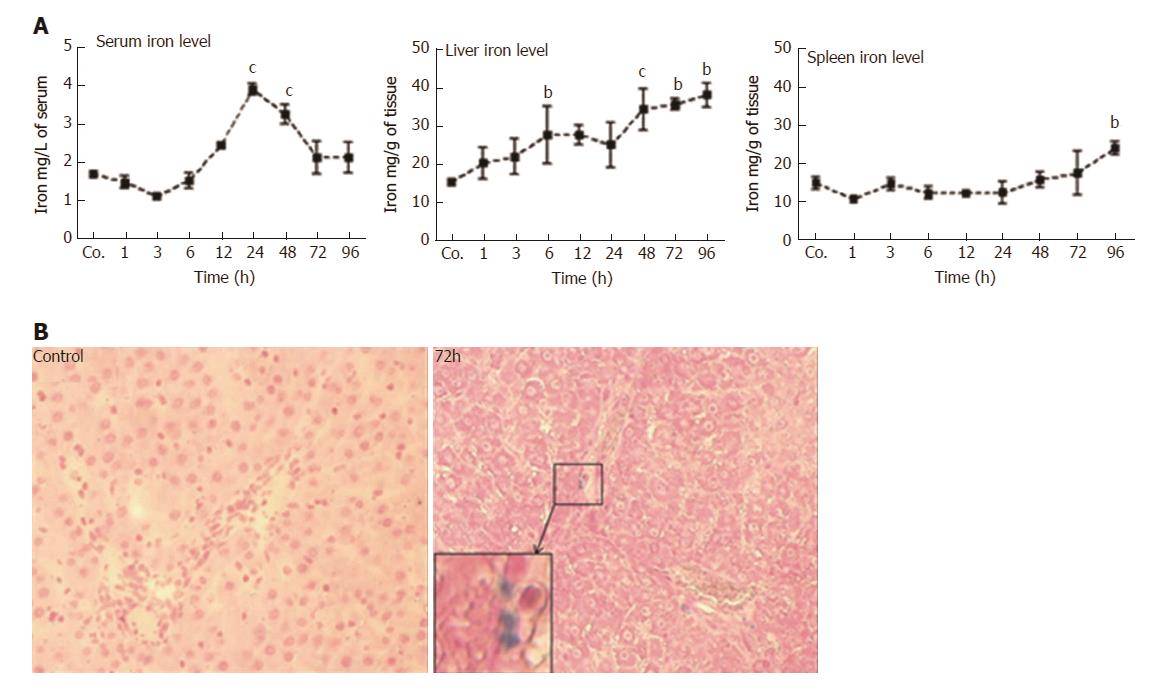
Figure 3 Measurement of serum, hepatic and splenic iron levels.
A: Serum, liver and spleen iron levels at various time points after TAA injection in rats, as compared to controls (Co.). A mild decrease in serum iron levels was followed by a significant (cP ≤ 0.001) increase at 24 h and 48 h after TAA injection. Liver iron levels showed a significant (bP ≤ 0.01; cP ≤ 0.001) increase almost throughout the whole course of the study (a clear tendency is seen already after 1 h and 3 h). However, splenic iron content increased significantly (bP ≤ 0.01) only after 96 h. Results show mean ± SEM of each four animals; B: Prussian blue iron staining in liver of control and TAA-injected rats. Inset shows a higher magnification of the boxed area. A few positive cells are visible in rats after 72 h. Original magnification × 200.
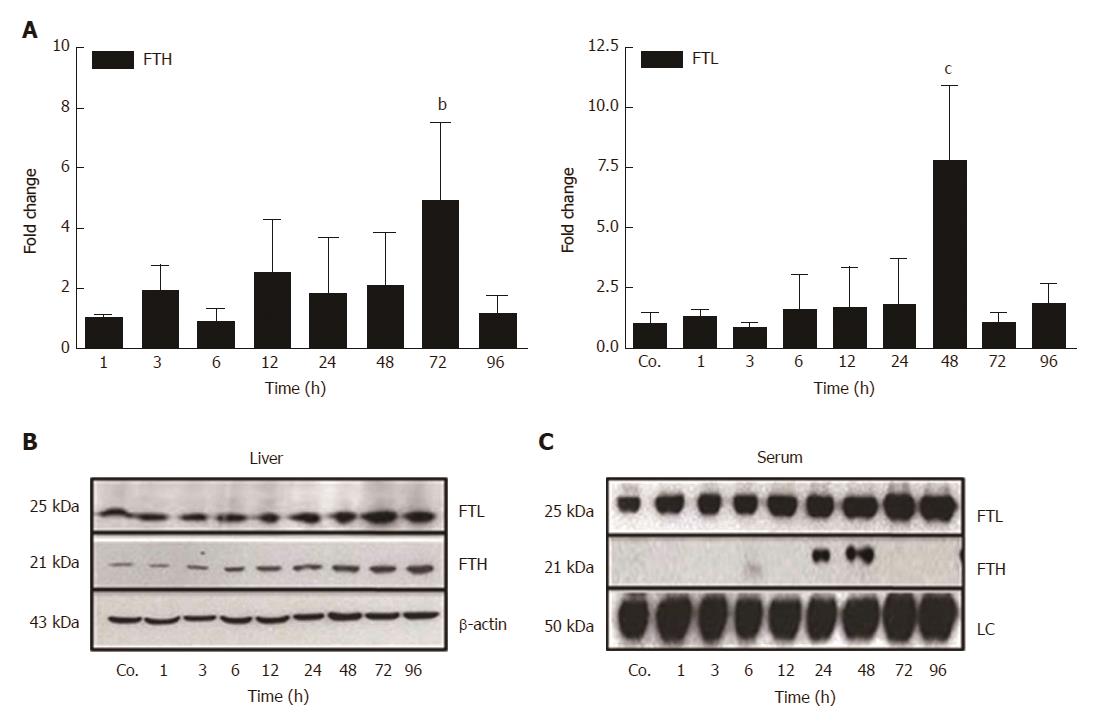
Figure 4 Changes in hepatic and serum levels of ferritin heavy chain and ferritin light chain after thioacetamide-induced liver damage.
A: Significant (bP ≤ 0.01; cP ≤ 0.001) fold-change of hepatic mRNA expression of ferritin heavy chain (FTH) and ferritin light chain (FTL) in TAA-injected animals vs controls (Co.) after 72 h and 48 h, respectively, analyzed by qPCR and normalized against the house-keeping gene UBC. Results represent mean values ± SEM of each four animals per group. Controls were set as 1; B, C: Western blot analysis of FTL and FTH in total liver and in serum of control (Co.) and TAA-injected animals at indicated time points. β-actin (about 43 kDa) was used as loading control for liver tissue, while in serum the loading control (LC) represents an internal control (about 50 kDa).
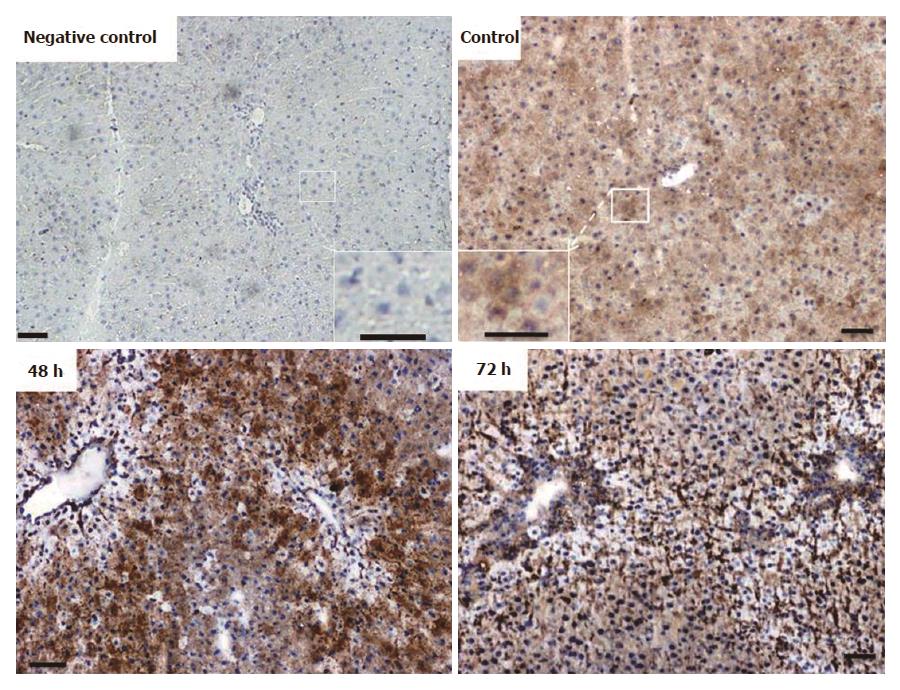
Figure 5 Immunoperoxidase staining of ferritin light chain in cryostat sections of rat liver from control and thioacetamide-injected animals.
Insets show higher magnification of corresponding areas. Negative control represents the omission of primary antibodies. Note massive increase in signal intensity after 48 h and 72 h. Original magnification × 100; bar = 50 μm.
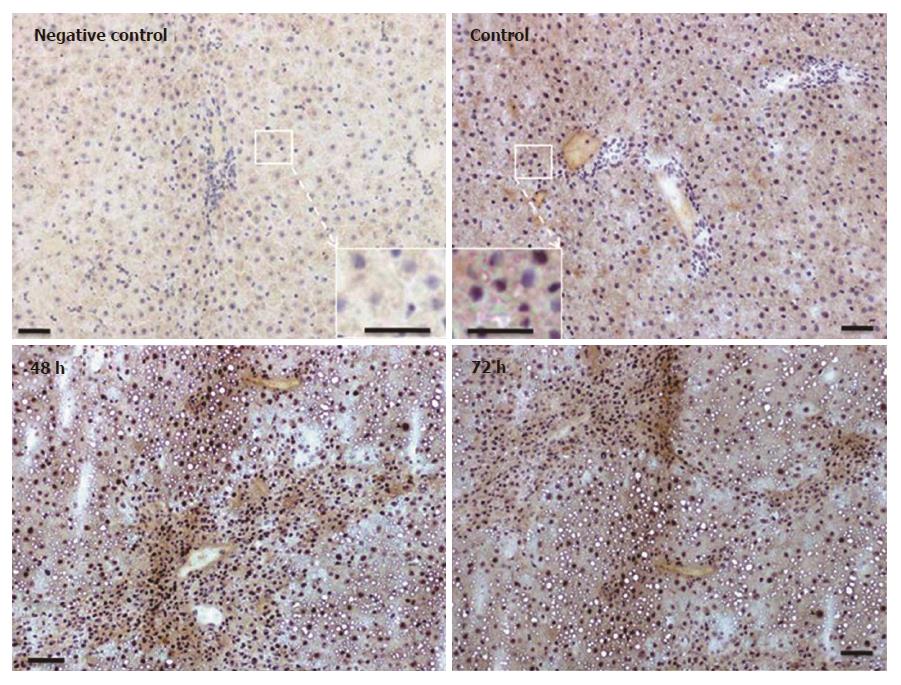
Figure 6 Immunodetection of ferritin heavy chain in cryostat sections of rat liver from control and thioacetamide-injected animals utilizing peroxidase-conjugated secondary antibodies.
Insets show higher magnification of corresponding areas. Negative control represents the omission of primary antibodies. Note increase in signal intensity after 48 h and 72 h. Original magnification × 100; bar = 50 μm.
- Citation: Malik IA, Wilting J, Ramadori G, Naz N. Reabsorption of iron into acutely damaged rat liver: A role for ferritins. World J Gastroenterol 2017; 23(41): 7347-7358
- URL: https://www.wjgnet.com/1007-9327/full/v23/i41/7347.htm
- DOI: https://dx.doi.org/10.3748/wjg.v23.i41.7347


