Copyright
©The Author(s) 2017.
World J Gastroenterol. Oct 28, 2017; 23(40): 7242-7252
Published online Oct 28, 2017. doi: 10.3748/wjg.v23.i40.7242
Published online Oct 28, 2017. doi: 10.3748/wjg.v23.i40.7242
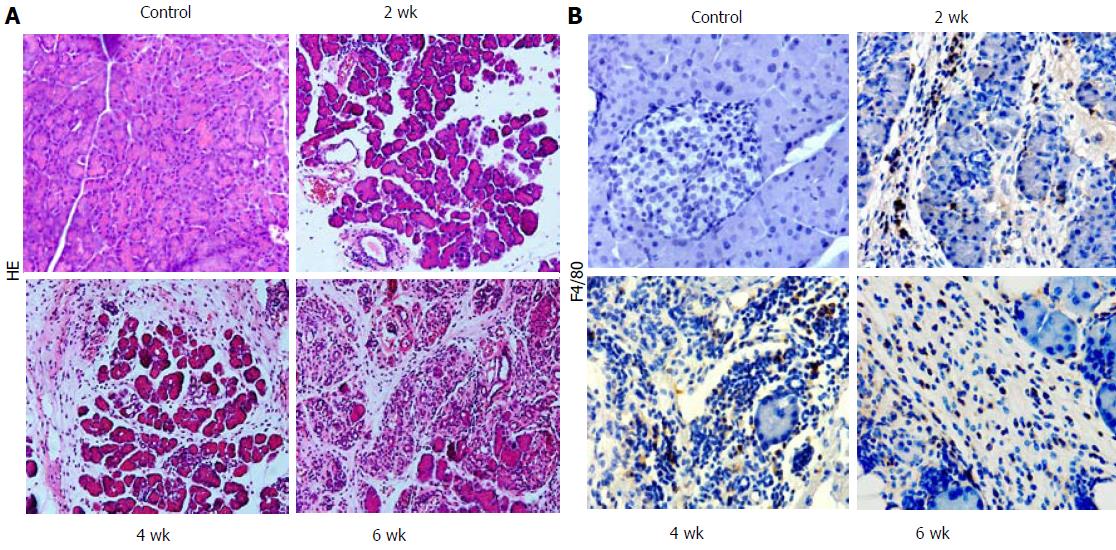
Figure 1 Morphological changes and macrophage infiltration in pancreatic sections obtained from mice with chronic pancreatitis induced by L-arginine.
A: Pancreatic morphology at different time points of L-arginine induction using hematoxylin and eosin staining (original magnification, × 100); B: Macrophage infiltration in pancreas was detected using immunohistochemistry. Macrophages were stained using an anti-mouse F4/80 antibody (original magnification, × 200).
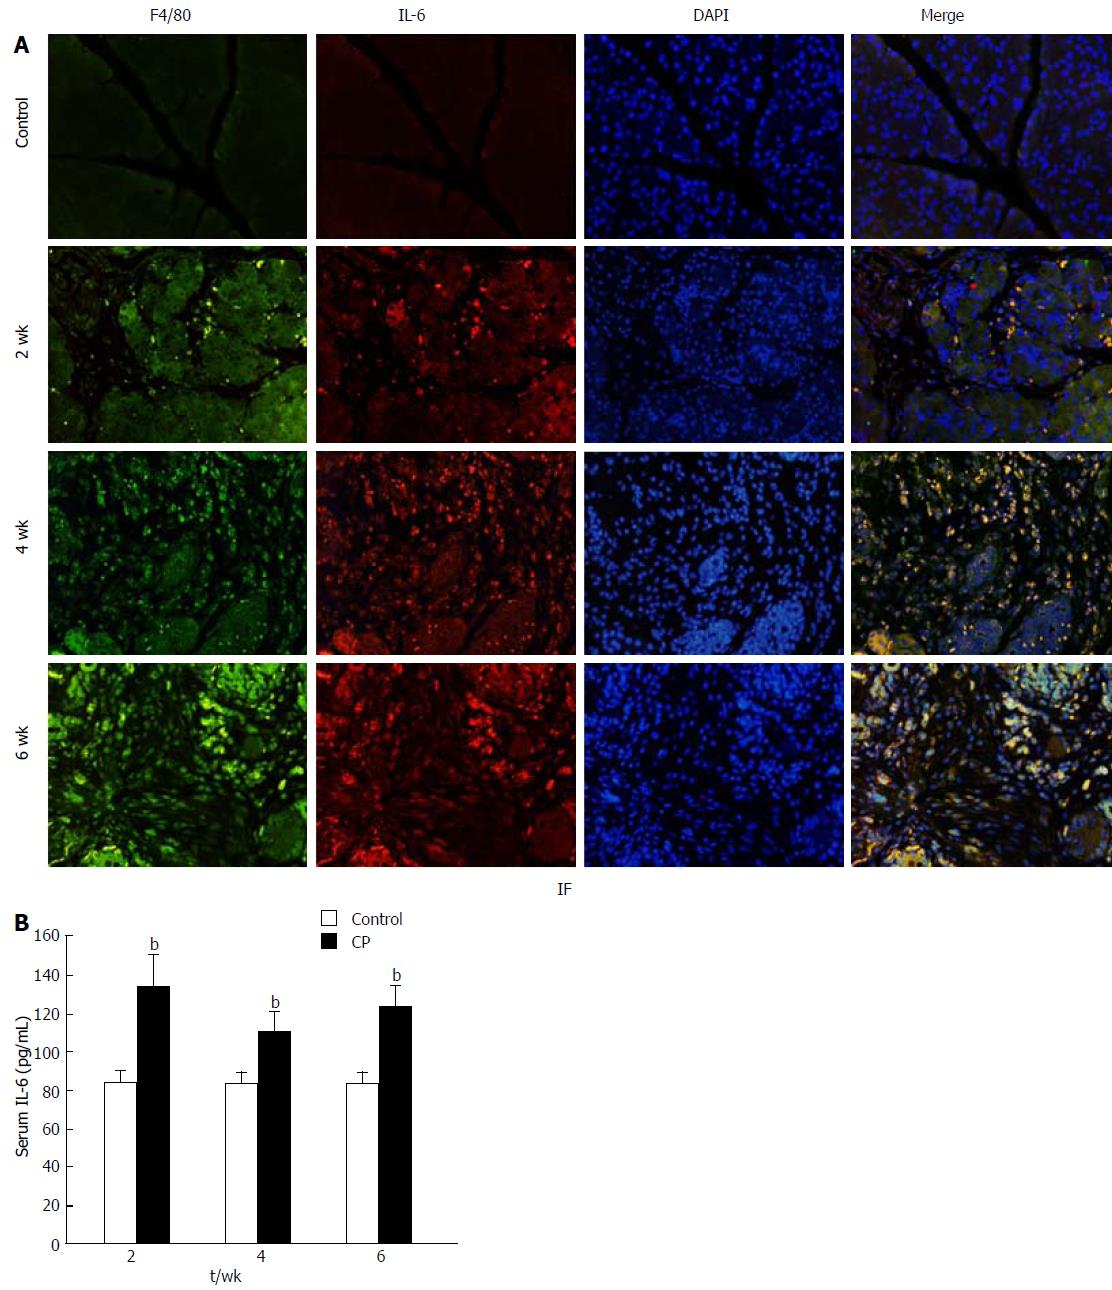
Figure 2 Interleukin-6 production is related to macrophage infiltration.
A: Double immunofluorescent signals from F4/80 and interleukin-6 in L-arginine-induced chronic pancreatitis tissue at different time points (original magnification, × 200); B: Interleukin-6 levels in the sera of mice with chronic pancreatitis. Values are shown as mean ± SD (n = 36). aP < 0.05, bP < 0.01 vs control.
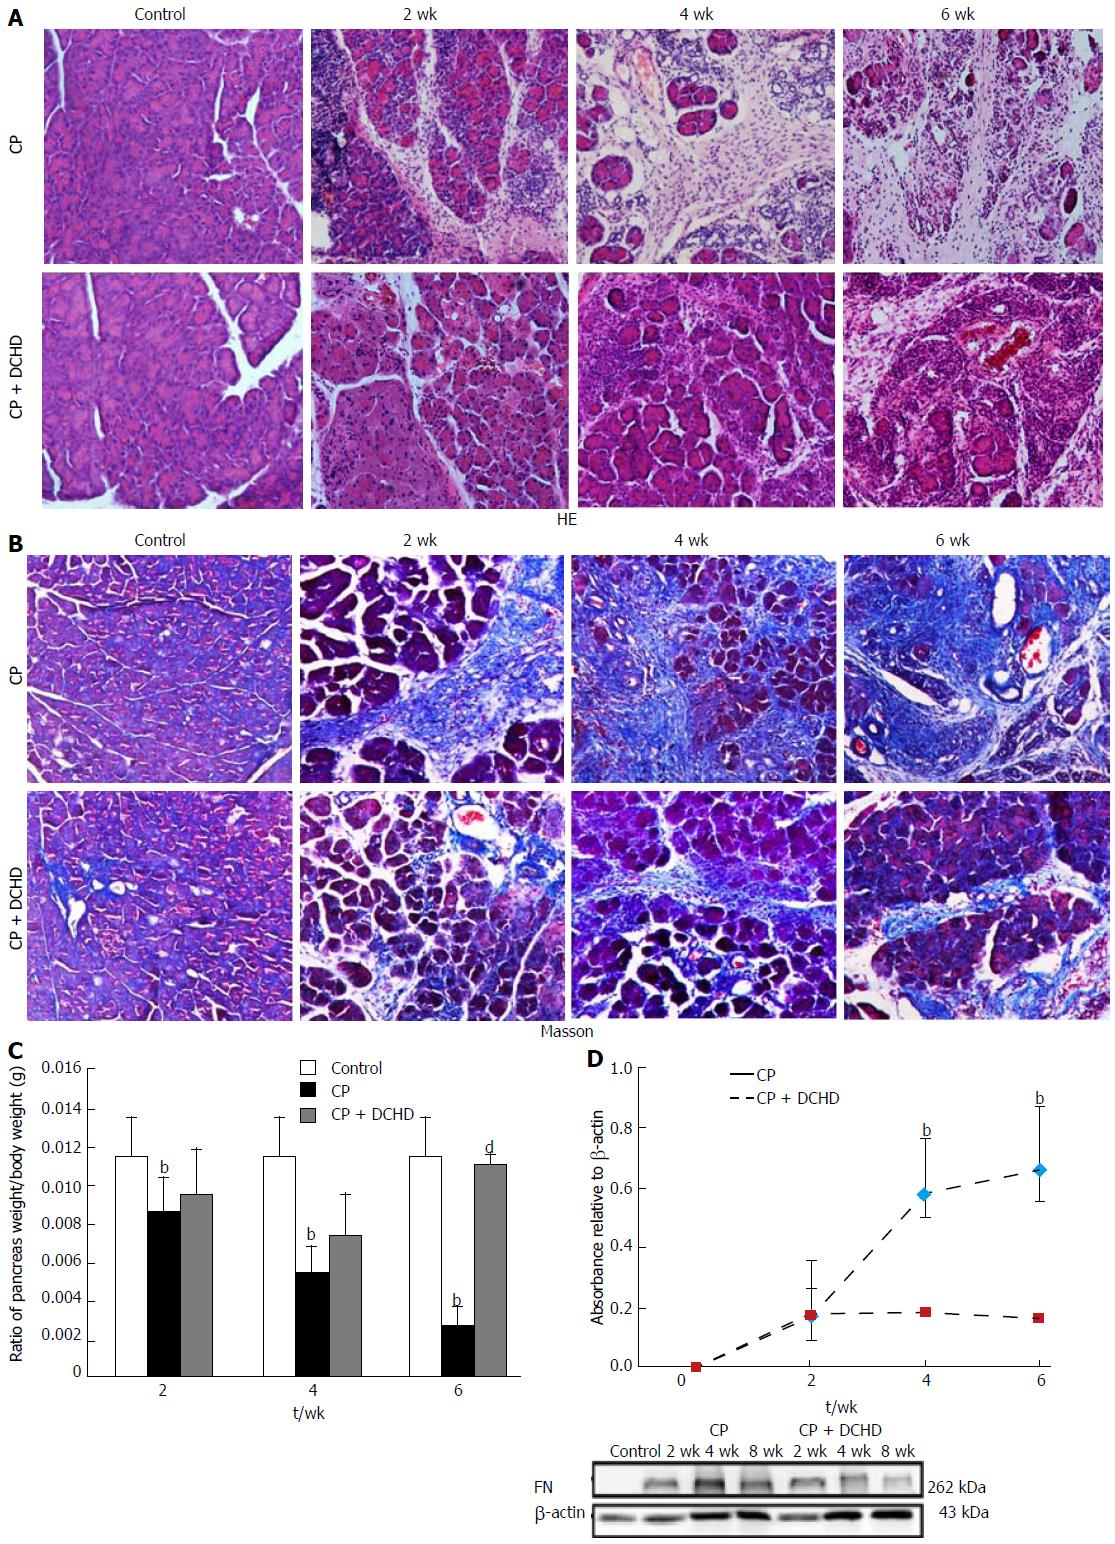
Figure 3 Dachaihu decoction protects against pancreatic injury and pancreatic fibrosis in mice with chronic pancreatitis.
A: Changes in pancreatic morphology at different time points were evaluated by hematoxylin and eosin staining (original magnification, × 100); B: Collagen deposition was detected by Masson staining (original magnification, × 100); C: Ratio of pancreas weight/body weight changes in the different groups; D: The expression of fibronectin in the pancreas following the development of chronic pancreatitis. Values are shown as mean ± SD (n = 9). aP < 0.05, bP < 0.01 vs control; cP < 0.05, dP < 0.01 vs CP group.
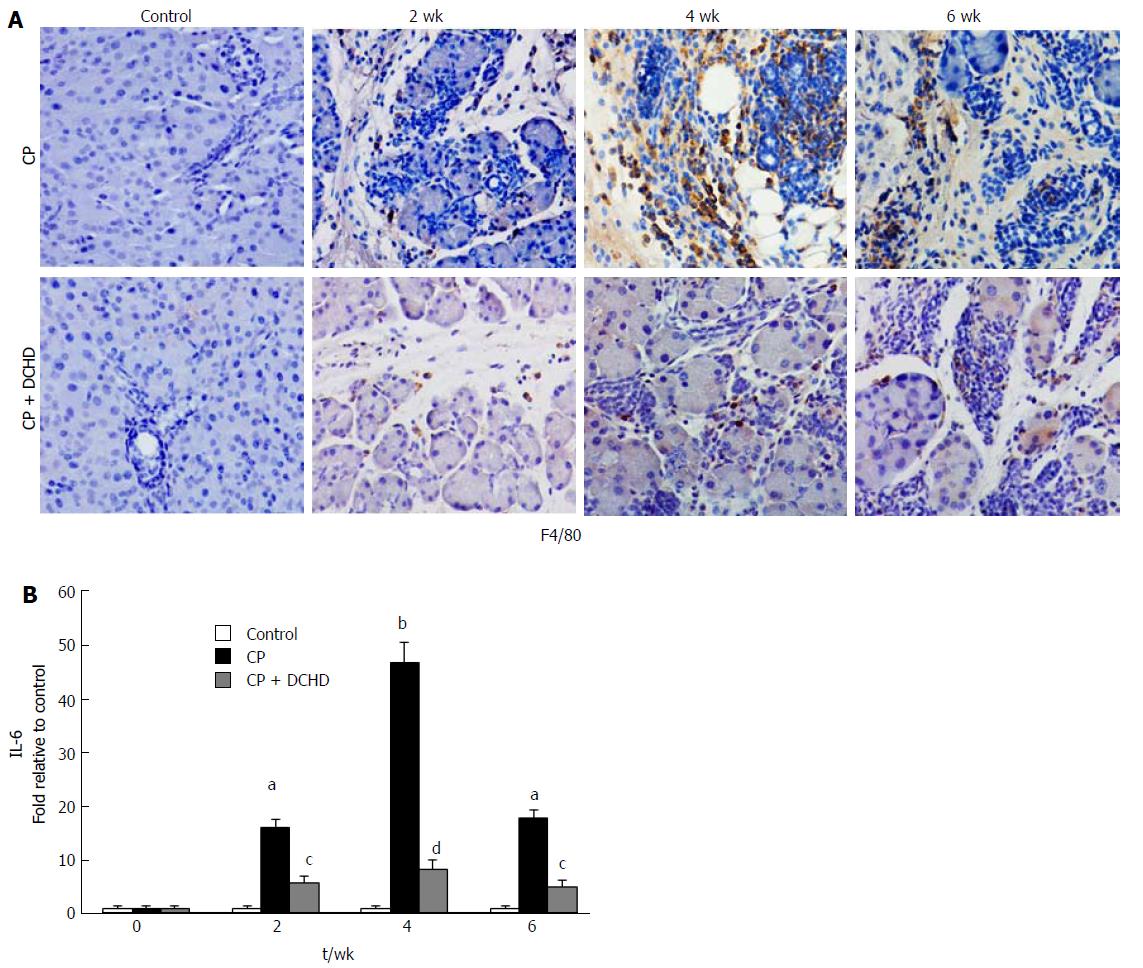
Figure 4 Dachaihu decoction attenuated macrophage infiltration and interleukin-6 expression in the pancreas.
A: Immunohistochemistry of macrophages associated with chronic pancreatitis (original magnification, × 200); B: Interleukin-6 mRNA levels in the pancreas determined by RT-PCR. Values are shown as mean ± SD (n = 9). aP < 0.05, bP < 0.01 vs control; cP < 0.05, dP < 0.01 vs CP group.
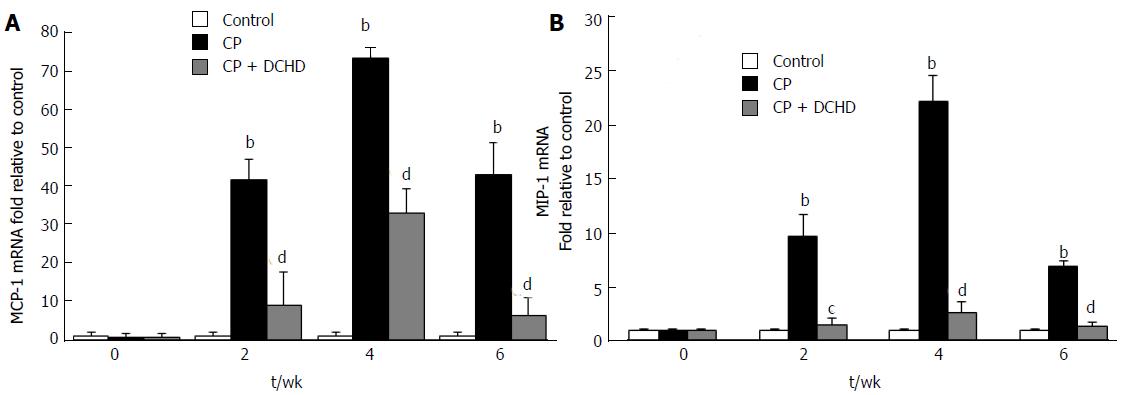
Figure 5 Effects of Dachaihu decoction on MCP-1 and MIP-1α mRNA levels in the pancreas of mice with chronic pancreatitis.
A: MCP-1 mRNA levels in the pancreas as determined by real time-polymerase chain reaction; B: MIP-1α levels in the pancreas as determined by real time-polymerase chain reaction. Values are shown as mean ± SD (n = 9). aP < 0.05, bP < 0.01 vs control; cP < 0.05, dP < 0.01 vs CP group.
- Citation: Duan LF, Xu XF, Zhu LJ, Liu F, Zhang XQ, Wu N, Fan JW, Xin JQ, Zhang H. Dachaihu decoction ameliorates pancreatic fibrosis by inhibiting macrophage infiltration in chronic pancreatitis. World J Gastroenterol 2017; 23(40): 7242-7252
- URL: https://www.wjgnet.com/1007-9327/full/v23/i40/7242.htm
- DOI: https://dx.doi.org/10.3748/wjg.v23.i40.7242


