Copyright
©The Author(s) 2017.
World J Gastroenterol. Oct 28, 2017; 23(40): 7211-7220
Published online Oct 28, 2017. doi: 10.3748/wjg.v23.i40.7211
Published online Oct 28, 2017. doi: 10.3748/wjg.v23.i40.7211
Figure 1 Influence of glucagon-like peptide-2 on the neurally-induced contractile responses.
A: Typical tracing showing the electrical field stimulation (EFS)-induced contractile responses at different stimulation frequencies (left panel). Ten min after the addition of 2 nmol/L glucagon-like peptide-2 (GLP-2) to the bath medium (right panel), the amplitude of the EFS-induced excitatory responses is decreased in the whole range of stimulation frequencies employed; B: Bar chart of the effects of GLP-2 (2 and 20 nmol/L) on the mean amplitude of the EFS-induced contractile responses elicited at different stimulation frequencies. Excitatory responses are expressed as percentage of the muscular contraction evoked by 2 μmol/L methacholine, taken as 100%. All values are mean ± SE of six preparations. aP < 0.05 vs the ctr bP < 0.05 and P > 0.05 vs the ctr and vs 2 nmol/L GLP-2, respectively, ANOVA and Newman-Keuls post-test).
Figure 2 Lack of effects of glucagon-like peptide-2 on the neurally-induced contractile responses in the presence of the nitric oxide synthesis inhibitor L-NNA.
A: Typical tracing showing the electrical field stimulation (EFS)-induced contractile responses at different stimulation frequencies (left panel). Following the addition of L-NNA (200 µmol/L) to the bath medium, the amplitude of the EFS-induced excitatory responses is enhanced (middle panel). In the presence of L-NNA, glucagon-like peptide-2 (GLP-2, 20 nmol/L) no longer depresses the amplitude of the neurally-induced contractile responses (right panel); B: Bar chart of the effects of GLP-2 (20 nmol/L) on the mean amplitude of the EFS-induced contractile responses in the presence of L-NNA (200 µmol/L). Excitatory responses are expressed as percentage of the muscular contraction evoked by 2 μmol/L methacholine, taken as 100%. All values are mean ± SE of six preparations. aP < 0.05 vs the ctr bP < 0.05 and P > 0.05 vs the ctr and vs GLP-2, respectively (ANOVA and Newman-Keuls post-test).
Figure 3 Effects of glucagon-like peptide-2 on gastric strips precontracted with carbachol.
Typical tracings showing the effect of the addition of glucagon-like peptide-2 (GLP-2, 2 and 20 nmol/L) to the bath medium. GLP-2 causes a dose-dependent slow and long-lasting relaxation. CCh: Carbachol.
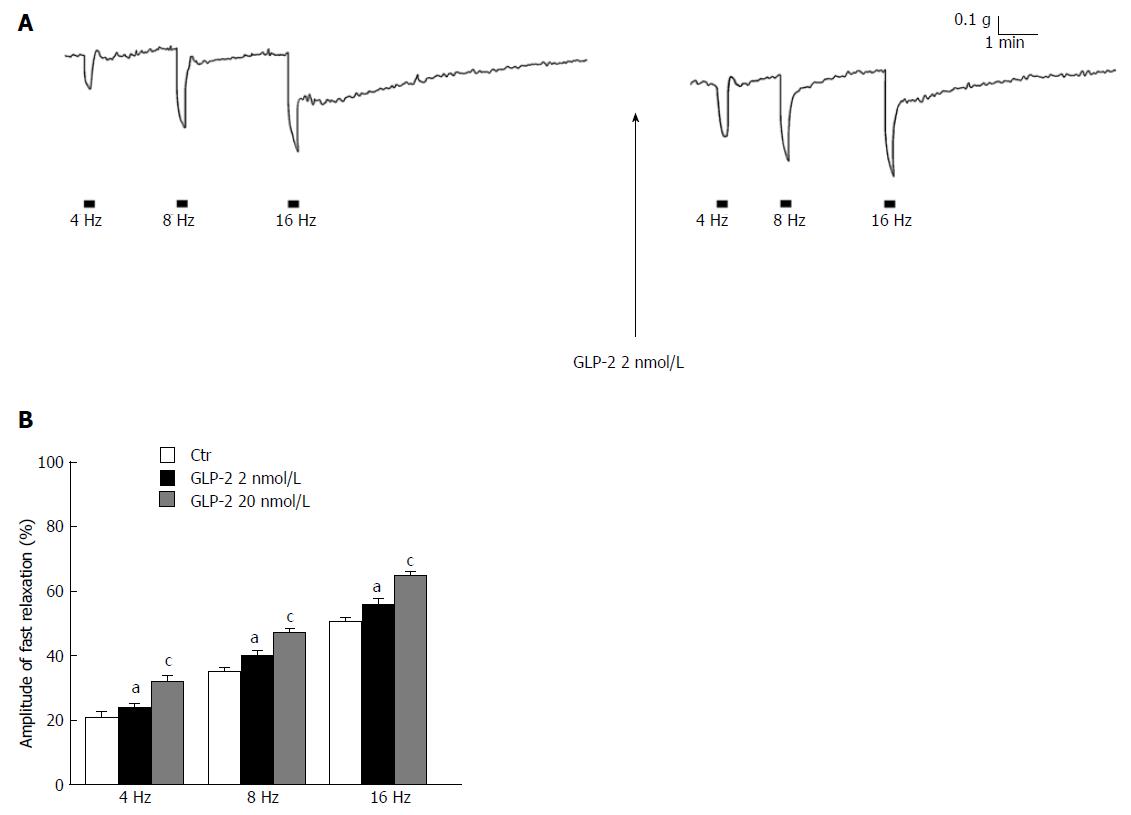
Figure 4 Influence of glucagon-like peptide-2 on the neurally-induced relaxant responses.
A: Typical tracing showing the electrical field stimulation (EFS)-induced relaxant responses at different stimulation frequencies (left panel). EFS evokes fast relaxant responses, followed by a slow component at the higher stimulation frequencies (≥ 8 Hz). GLP-2 at 2 nmol/L causes (right panel) an increase in amplitude of the EFS-induced fast relaxation in whole range of stimulation frequencies employed and a decrease of the slow one; B: Bar chart of the effects of GLP-2 (glucagon-like peptide-2, 2 and 20 nmol/L) on the mean amplitude of the EFS-induced fast relaxation. Note that GLP-2 increases the amplitude of the EFS-induced fast relaxant responses in a dose-related manner. Relaxant responses are expressed as percentage decrease relative to the muscular tension induced by 1 μmol/L CCh taken as 100%. Amplitude values of EFS-induced fast relaxations refer to the maximal peak obtained during the stimulation period. All values are mean ± SE of six preparations. aP < 0.05 vs the ctr; cP < 0.05 vs the ctr and vs 2 nmol/L GLP-2 (ANOVA and Newman-Keuls post-test).
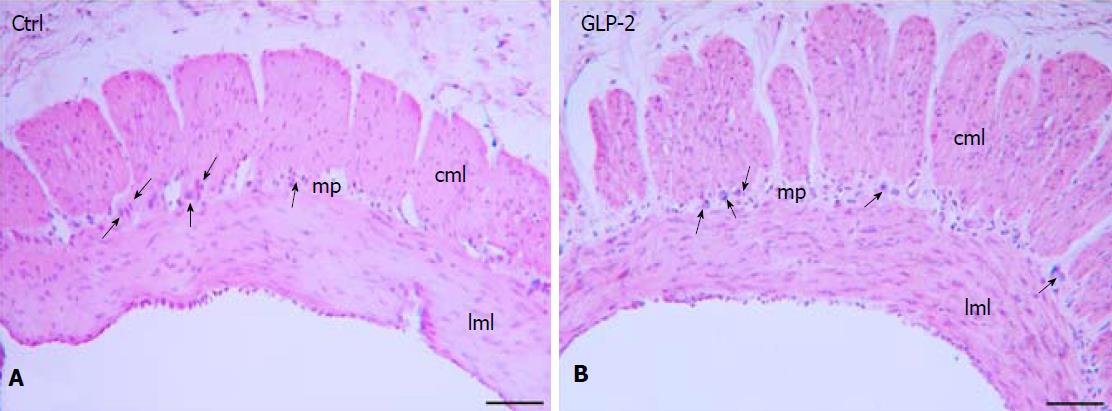
Figure 5 H&E staining of gastric fundus strip.
The longitudinal and circular muscle layers (lml, cml) and the myenteric plexus (mp) are shown both in control (A) and in GLP-2 treated (B) specimens. The arrows indicated some myenteric neurons. Bar: A, B = 10 μm.
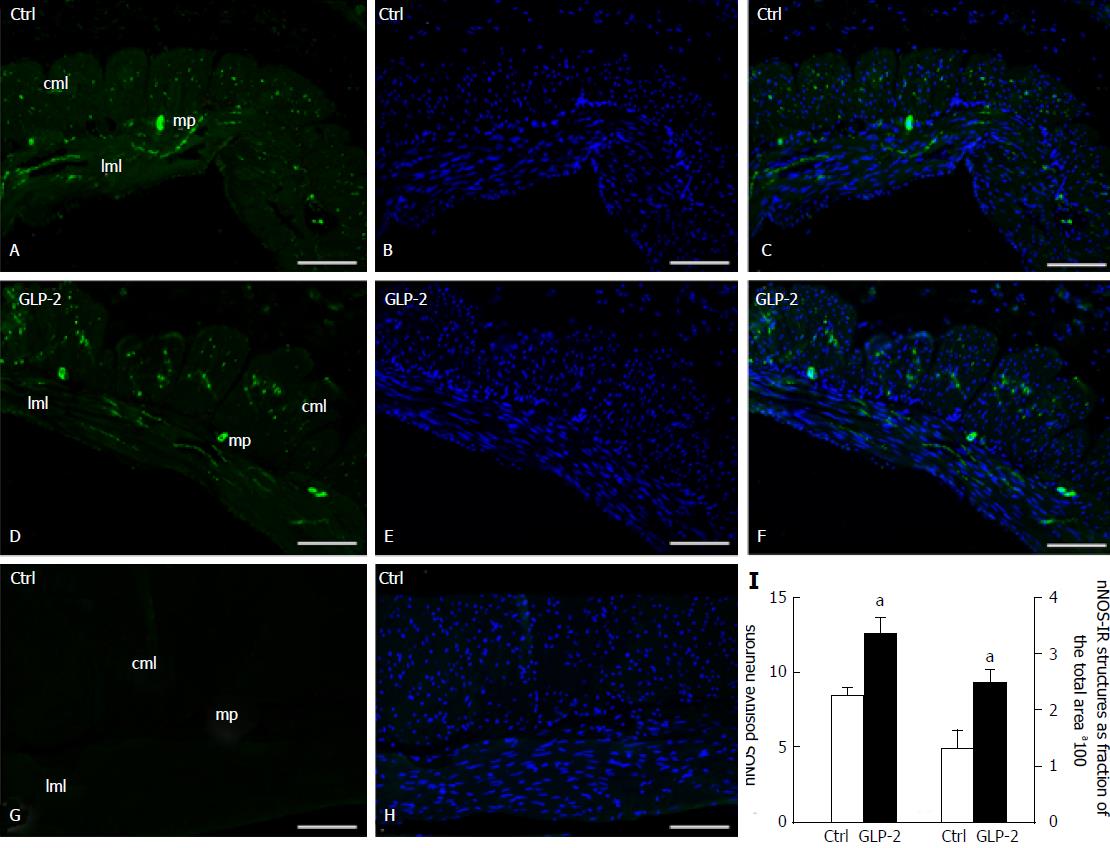
Figure 6 Neuronal nitric oxide synthase-immunoreactivity in control and glucagon-like peptide-2 treated specimens.
In control (A) and glucagon-like peptide-2 (GLP-2) treated (D) specimens, neuronal nitric oxide synthase-immunoreactivity (nNOS-IR) (green) is present in the soma of some myenteric neurons and in several nerve fibers. DAPI fluorescent staining for DNA (blue) identified the nuclei of both smooth muscle and neural cells (B-E). In C and F, merged images of nNOS and Bisbenzimide Hoechst Trihydrochloride (BHT) fluorescent staining are shown. When the primary antibody is omitted (G), only the BHT labelling is observed (H). The quantitative analysis showed a significant increase (I) in nNOS-IR myenteric neurons (left side) and in IR fibers in the entire muscle coat (right side). aP < 0.05 vs controls (unpaired Student's t-test). mp: Myenteric plexus; cml: Circular muscle layer; lml: Longitudinal muscle layer. Bar: A-H = 10 μm.
- Citation: Garella R, Idrizaj E, Traini C, Squecco R, Vannucchi MG, Baccari MC. Glucagon-like peptide-2 modulates the nitrergic neurotransmission in strips from the mouse gastric fundus. World J Gastroenterol 2017; 23(40): 7211-7220
- URL: https://www.wjgnet.com/1007-9327/full/v23/i40/7211.htm
- DOI: https://dx.doi.org/10.3748/wjg.v23.i40.7211


