Copyright
©The Author(s) 2017.
World J Gastroenterol. Jan 28, 2017; 23(4): 712-722
Published online Jan 28, 2017. doi: 10.3748/wjg.v23.i4.712
Published online Jan 28, 2017. doi: 10.3748/wjg.v23.i4.712
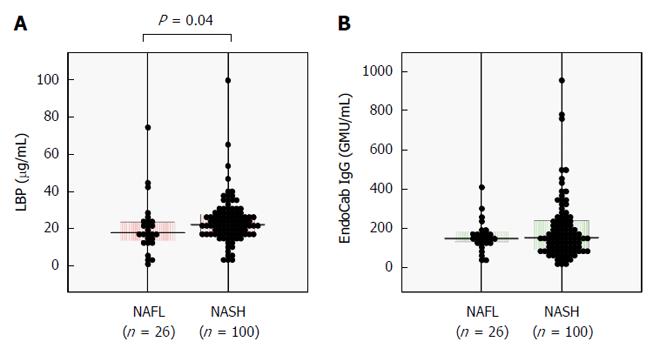
Figure 1 Comparisons of serum lipopolysaccharide-binding protein (A) and EndoCab IgG (B) between 26 nonalcoholic fatty liver and 100 nonalcoholic steatohepatitis patients.
The clinicopathological features of the patients are shown in Table 1. Bars represent median values. P values were calculated using the Mann-Whitney U test. NAFL: Nonalcoholic fatty liver; NASH: Nonalcoholic steatohepatitis.
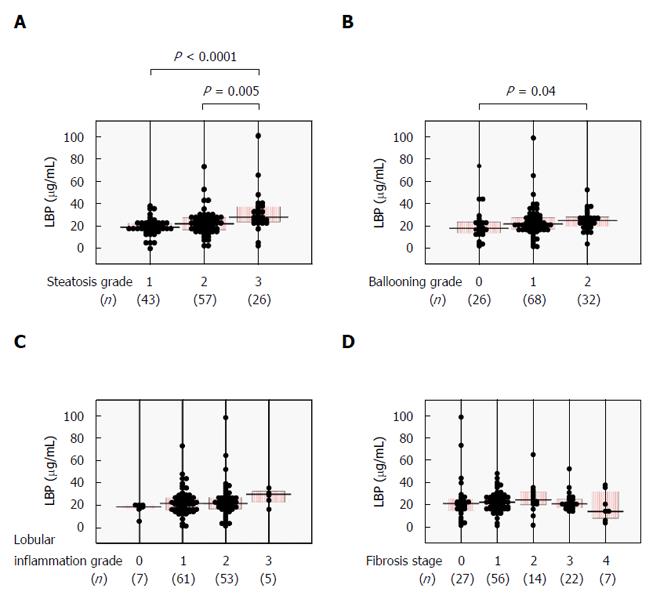
Figure 2 Relationships between serum lipopolysaccharide-binding protein and histological findings in 126 biopsy-proven nonalcoholic fatty liver disease patients.
A: Steatosis (1-3); B: Ballooning (0-2); C: Lobular inflammation (0-3); and D: Fibrosis (0-4) scores. Comparisons among subgroups were conducted using one-way ANOVA with Bonferroni’s correction. LBP: Lipopolysaccharide-binding protein.
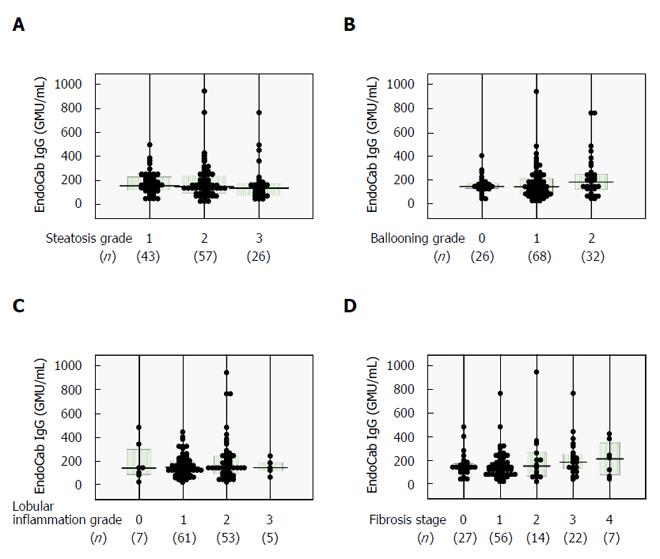
Figure 3 Relationships between serum EndoCab IgG and histological findings in 126 biopsy-proven nonalcoholic fatty liver disease patients.
A: Steatosis (1-3); B: Ballooning (0-2); C: Lobular inflammation (0-3); and D: Fibrosis (0-4) scores. Comparisons among subgroups were conducted using one-way ANOVA with Bonferroni’s correction.
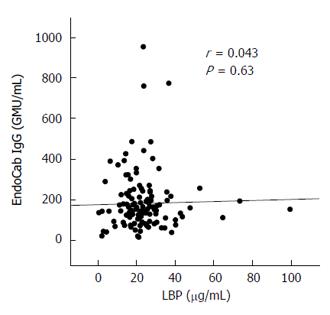
Figure 4 Correlation between serum lipopolysaccharide-binding protein and EndoCab IgG in 126 biopsy-proven nonalcoholic fatty liver disease patients.
A correlation efficient (r) and P value were calculated using Spearman’s test. LBP: Lipopolysaccharide-binding protein.
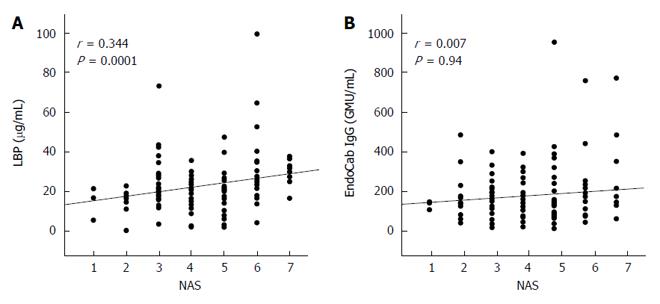
Figure 5 Correlation of nonalcoholic fatty liver disease activity score with serum lipopolysaccharide-binding protein (A) and EndoCab IgG (B) in 126 biopsy-proven nonalcoholic fatty liver disease patients.
Correlation efficients (r) and P values were calculated using Spearman’s test. LBP: Lipopolysaccharide-binding protein; NAS: Nonalcoholic fatty liver disease activity score.
- Citation: Kitabatake H, Tanaka N, Fujimori N, Komatsu M, Okubo A, Kakegawa K, Kimura T, Sugiura A, Yamazaki T, Shibata S, Ichikawa Y, Joshita S, Umemura T, Matsumoto A, Koinuma M, Sano K, Aoyama T, Tanaka E. Association between endotoxemia and histological features of nonalcoholic fatty liver disease. World J Gastroenterol 2017; 23(4): 712-722
- URL: https://www.wjgnet.com/1007-9327/full/v23/i4/712.htm
- DOI: https://dx.doi.org/10.3748/wjg.v23.i4.712


