Copyright
©The Author(s) 2017.
World J Gastroenterol. Sep 28, 2017; 23(36): 6694-6704
Published online Sep 28, 2017. doi: 10.3748/wjg.v23.i36.6694
Published online Sep 28, 2017. doi: 10.3748/wjg.v23.i36.6694
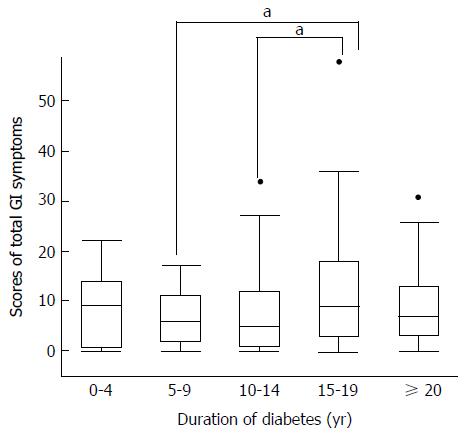
Figure 1 Distribution of the sum of scores of symptoms related to all GI areas by duration of diabetes.
aP < 0.05, significantly different. Sums of symptom scores peaked during the 15- to 19-yr diabetes duration period, compared by Student’s t-tests for paired periods (P = 0.01 and P = 0.02 when compared with 5-9 yr and 10-14 yr disease durations, respectively).
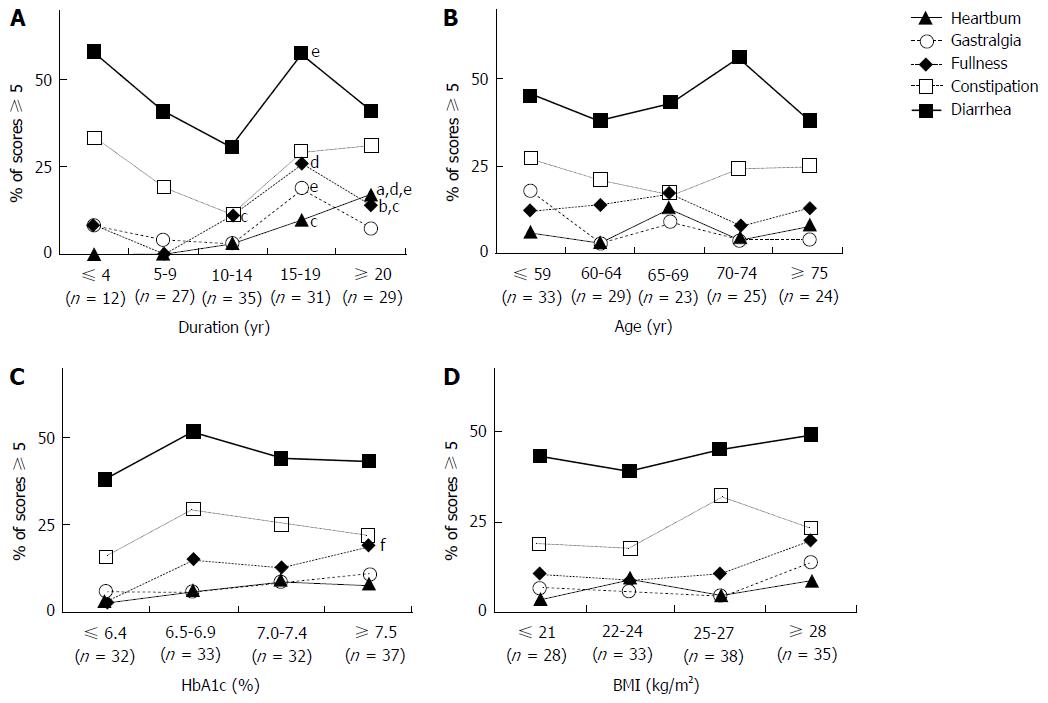
Figure 2 Relationships of abdominal symptoms with duration of diabetes, age, body mass index and hemoglobin A1c.
The lines show the percentages of subjects with a score of 5 or higher, for each GI region, among those considered to be sufficiently symptomatic to impair quality of life. Comparisons among groups with five disease duration periods (A), five age ranges (B), four HbA1c levels (C) and four BMI levels (D) were performed using a Cochran-Armitage-trend-test. aP < 0.05 or bP < 0.01, significantly different. As shown in the figure (A), scores for heartburn (P = 0.004) and postprandial fullness (P = 0.029) consistently and significantly increased with disease duration. Student’s t-tests for paired samples were performed to compare percentages of subjects with a score of 5 or higher, for each GI region, among five durations of diabetes (A), five age ranges (B), four HbA1c levels (C) and four BMI levels (D). cP < 0.05 vs 5-9 years, dP < 0.01 vs 5-9 years, or eP < 0.05 vs 10-14 years when compared with other disease duration periods and fP < 0.05 vs 6.4% or less which indicate significant differences. As shown in the figure (A), percentages of subjects with a score of 5 or higher for all symptoms except constipation in the disease duration period of 15-19 years were significantly higher than those in the 5-9 years and 10-14 years periods; P = 0.048 for heartburn, P = 0.024 for gastralgia, P = 0.008 for fullness and P = 0.03 for diarrhea. Likewise, percentages of subjects with a score of 5 or higher for heartburn and fullness in the disease duration period of 20 years or more were significantly higher than those in the 5-9 years and 10-14 years periods; P = 0.01 and P = 0.04 for heartburn and P = 0.02 for fullness. Furthermore, the percentage of subjects with a score of 5 or higher for fullness in the disease duration period of 10-14 yr was significantly higher than that in the 5-9 years period (P = 0.029). As shown in the figure (C), the percentage of subjects with a score of 5 or higher for fullness in those with HbA1c levels of 7.5% or above was significantly higher than that in those whose HbA1c was 6.4% or less (P = 0.030). BMI: Body mass index; HbA1c: Hemoglobin A1c.
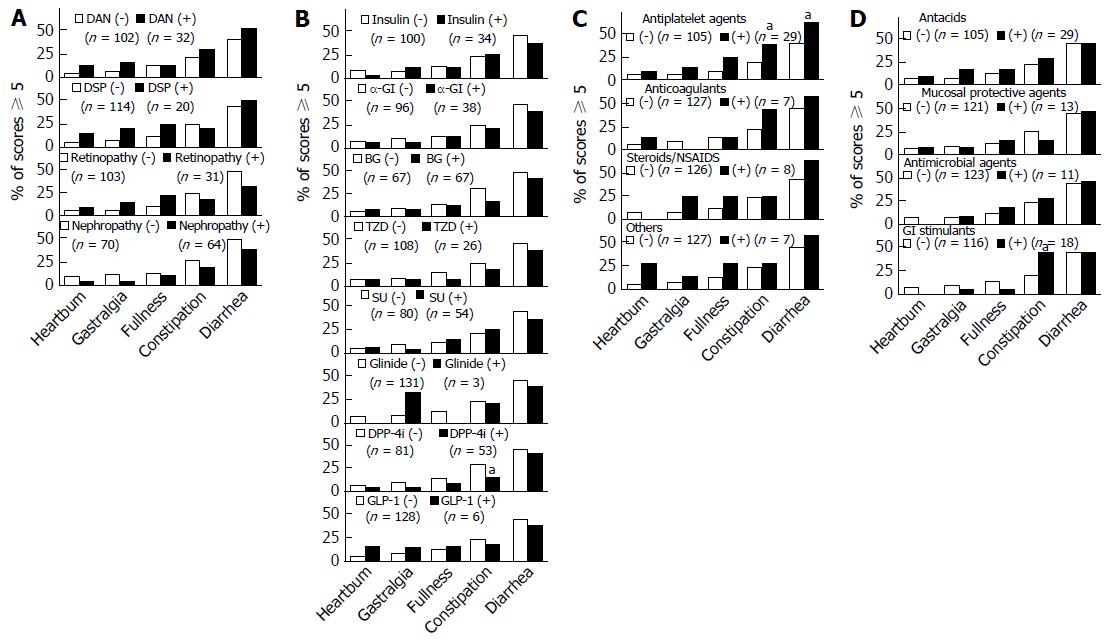
Figure 3 Relationships between various parameters and gastrointestinal symptoms involving each gastrointestinal region (“Heartburn” for esophagus, “Gastralgia” and “Postprandial Fullness” for upper abdomen, and “Constipation” and “Diarrhea” for lower abdomen).
Bars: White indicates the absence and black the presence of each parameter. The percentages of subjects with a score of 5 or higher, for each GI region, considered to be sufficiently symptomatic to cause impaired quality of life, are shown. aP < 0.05, significant difference between presence and absence of each parameter, as analyzed by Fisher’s exact test. A: Comparison between subjects with and without diabetic microangiopathy. The indicated percentages were obtained by dividing the number of subjects with a score of 5 or higher by the total number of patients in the same group (with or without diabetic microangiopathy); B: Comparisons between groups of patients with and without antidiabetic agent administration; C: Comparisons between groups of patients with and without antithrombotic or anti-inflammatory agents. ‘Others’ includes other antithrombotic agents such as prostaglandin E1 derivatives, prostaglandin I2 derivatives, or ethyl esters of eicosapentaenoic acid; D: Comparisons between groups of patients with and without GI agents. αGI: Alpha-glucosidase inhibitors; DAN: Diabetic autonomic neuropathy; DPP-4i: Dipeptidyl-peptidase 4 inhibitor; DSP: Distal symmetric polyneuropathy; GI: Gastrointestinal; GLP-1: Glucagon-like peptide-1; NSAIDs: Nonsteroidal anti-inflammatory drugs; SU: Sulphonyl urea; TZD: Thiazolidinedione.
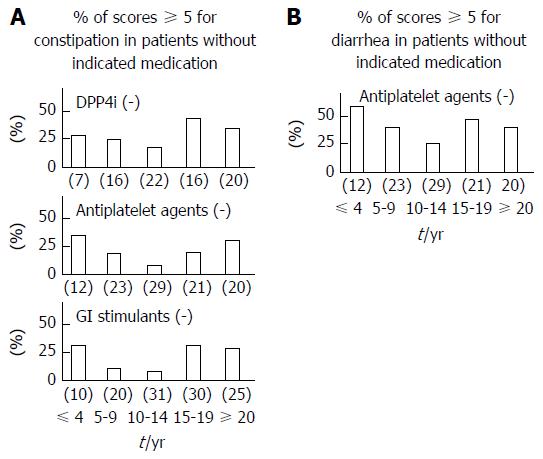
Figure 4 Relationships between various medications, which demonstrated significance as shown in Figure 3, and diabetes duration in terms of the presence of related gastrointestinal symptoms.
White bars show the percentages of subjects with a score of 5 or higher for the indicated GI symptoms (A: Constipation, B: Diarrhea) without use of the indicated medications. Numbers under each bar within brackets are the number of patients not using the indicated medications. DPP-4i: Dipeptidyl-peptidase 4 inhibitor; GI: Gastrointestinal.
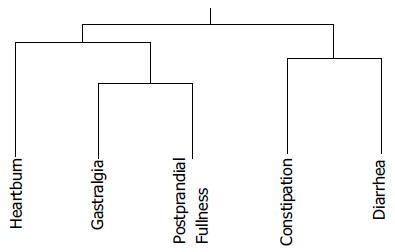
Figure 5 Cluster analysis was conducted for various gastrointestinal symptoms.
The treeplot shows relationships among the five symptoms. Lengths of branches between symptoms indicate symptom similarity.
- Citation: Fujishiro M, Kushiyama A, Yamazaki H, Kaneko S, Koketsu Y, Yamamotoya T, Kikuchi T, Sakoda H, Suzuki R, Kadowaki T. Gastrointestinal symptom prevalence depends on disease duration and gastrointestinal region in type 2 diabetes mellitus. World J Gastroenterol 2017; 23(36): 6694-6704
- URL: https://www.wjgnet.com/1007-9327/full/v23/i36/6694.htm
- DOI: https://dx.doi.org/10.3748/wjg.v23.i36.6694


